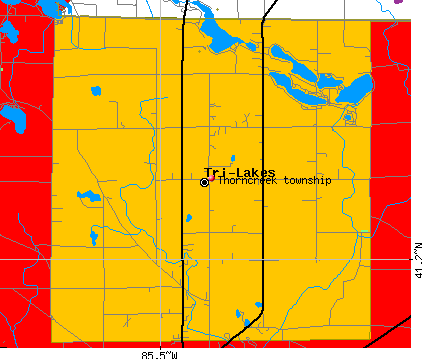
Thorncreek township, Whitley County, Indiana (IN) detailed profile
Number of foreign born residents: 1 (100% naturalized citizens)
| Thorncreek township: | 0.5% |
| Whole state: | 3.1% |
58% of Thorncreek township residents lived in the same house 5 years ago.
Out of people who lived in different houses, 49% lived in this county.
Out of people who lived in different counties, 78% lived in Indiana.
Place of birth for U.S.-born residents:
- This state: 3014
- Northeast: 55
- Midwest: 440
- South: 212
- West: 59
Median price asked for vacant for-sale houses in 2000: $225,000
Percentage of households with unmarried partners: 5.3%
Likely homosexual households (counted as self-reported same-sex unmarried-partner households)
- Lesbian couples: 0.3% of all households
- Gay men: 0.1% of all households
Housing units in structures:
- One, detached: 1,622
- 3 or 4: 6
- Mobile homes: 28
Median worth of mobile homes: $27,500
Housing units in Thorncreek township with a mortgage: 810 (116 second mortgage, 117 home equity loan, 0 both second mortgage and home equity loan)
Houses without a mortgage: 296
- Transportation equipment (17%)
- Construction (11%)
- Metal and metal products (7%)
- Repair and maintenance (5%)
- Miscellaneous manufacturing (4%)
- Computer and electronic products (4%)
- Professional, scientific, and technical services (4%)
- Health care (10%)
- Educational services (9%)
- Transportation equipment (8%)
- Finance and insurance (7%)
- Accommodation and food services (5%)
- Professional, scientific, and technical services (5%)
- Religious, grantmaking, civic, professional, and similar organizations (4%)
- Electrical equipment mechanics and other installation, maintenance, and repair occupations including supervisors (9%)
- Other sales and related workers including supervisors (6%)
- Operations specialties managers except financial managers (6%)
- Other production occupations including supervisors (5%)
- Other management occupations except farmers and farm managers (5%)
- Metal workers and plastic workers (4%)
- Engineers (4%)
- Other office and administrative support workers including supervisors (5%)
- Retail sales workers except cashiers (5%)
- Assemblers and fabricators (5%)
- Preschool, kindergarten, elementary and middle school teachers (5%)
- Secretaries and administrative assistants (4%)
- Other production occupations including supervisors (4%)
- Cooks and food preparation workers (4%)
Most common first ancestries reported in Thorncreek township:
- German (33.8%)
- United States or American (20.0%)
- English (10.7%)
- Irish (8.2%)
- Swedish (3.6%)
- Polish (3.4%)
- French (except Basque) (2.1%)
Most common places of birth for the foreign-born residents:
- Canada (55%)
- China, excluding Hong Kong and Taiwan (45%)
Means of transportation to work:
- Drove a car alone: 1,714 (84%)
- Carpooled: 274 (13%)
- Walked: 13 (1%)
- Worked at home: 33 (2%)
Most commonly used house heating fuel:
- Utility gas (56%)
- Bottled, tank, or LP gas (27%)
- Electricity (11%)
- Wood (4%)
- Other fuel (1%)
98.1% of residents of Thorncreek township speak English at home.
1.3% of residents speak Spanish at home (74% speak English very well, 26% speak English well).
0.6% of residents speak other Indo-European language at home (100% speak English very well).
Household type by relationship:
Households: 3,799- In family households: 3,407 (987 male householders, 170 female householders)
972 spouses, 1,157 children (1,030 natural, 55 adopted, 72 stepchildren), 5 grandchildren, 0 brothers or sisters, 23 parents, 13 other relatives, 80 non-relatives
- In nonfamily households: 392 (190 male householders (153 living alone)), 142 female householders (118 living alone)), 60 nonrelatives
- In group quarters: 1 (0 institutionalized population)
Size of family households: 551 2-persons, 259 3-persons, 215 4-persons, 91 5-persons, 35 6-persons, 6 7-or-more-persons,
Size of nonfamily households: 271 1-person, 61 2-persons,
836 married couples with children.
126 single-parent households (68 men, 58 women).
Private vs. public school enrollment:
Students in private schools in grades 1 to 8 (elementary and middle school): 26
| Here: | 5.5% |
| Indiana: | 11.8% |
Students in private schools in grades 9 to 12 (high school): 5
| Here: | 2.4% |
| Indiana: | 8.8% |
Students in private undergraduate colleges: 24
| Here: | 23.1% |
| Indiana: | 23.4% |