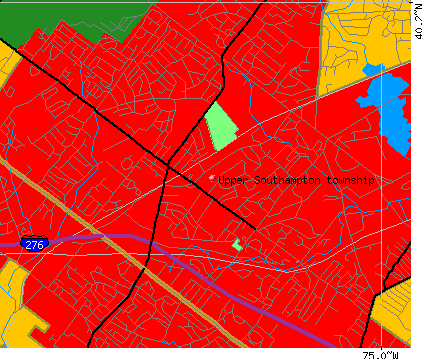
Upper Southampton township, Bucks County, Pennsylvania (PA) detailed profile
Number of foreign born residents: 5 (69% naturalized citizens)
| Upper Southampton township: | 5.0% |
| Whole state: | 4.1% |
71% of Upper Southampton township residents lived in the same house 5 years ago.
Out of people who lived in different houses, 45% lived in this county.
Out of people who lived in different counties, 86% lived in Pennsylvania.
Place of birth for U.S.-born residents:
- This state: 13239
- Northeast: 938
- Midwest: 241
- South: 416
- West: 106
Median price asked for vacant for-sale houses in 2000: $118,900
Percentage of households with unmarried partners: 3.0%
Likely homosexual households (counted as self-reported same-sex unmarried-partner households)
- Lesbian couples: 0.1% of all households
- Gay men: 0.1% of all households
People in group quarters in Upper Southampton township, Pennsylvania:
- 132 people in other group homes
- 34 people in other noninstitutional group quarters
- 8 people in homes for the mentally retarded
- 3 people in religious group quarters
Housing units in structures:
- One, detached: 4,369
- One, attached: 569
- Two: 93
- 3 or 4: 167
- 5 to 9: 336
- 10 to 19: 153
- 20 to 49: 89
- 50 or more: 340
- Mobile homes: 7
Median worth of mobile homes: $187,500
Housing units in Upper Southampton township with a mortgage: 3,070 (192 second mortgage, 583 home equity loan, 9 both second mortgage and home equity loan)
Houses without a mortgage: 1,521
- Construction (14%)
- Professional, scientific, and technical services (8%)
- Health care (6%)
- Finance and insurance (5%)
- Motor vehicle and parts dealers (3%)
- Educational services (3%)
- Administrative and support and waste management services (3%)
- Health care (17%)
- Educational services (14%)
- Finance and insurance (10%)
- Professional, scientific, and technical services (6%)
- Administrative and support and waste management services (5%)
- Public administration (3%)
- Accommodation and food services (3%)
- Sales representatives, services, wholesale and manufacturing (6%)
- Other management occupations except farmers and farm managers (5%)
- Other sales and related workers including supervisors (5%)
- Electrical equipment mechanics and other installation, maintenance, and repair occupations including supervisors (5%)
- Material recording, scheduling, dispatching, and distributing workers (4%)
- Retail sales workers except cashiers (4%)
- Construction trades workers except carpenters, electricians, painters, plumbers, and construction laborers (4%)
- Secretaries and administrative assistants (11%)
- Preschool, kindergarten, elementary and middle school teachers (8%)
- Registered nurses (7%)
- Information and record clerks except customer service representatives (6%)
- Other office and administrative support workers including supervisors (6%)
- Business operations specialists (4%)
- Other management occupations except farmers and farm managers (4%)
Most common first ancestries reported in Upper Southampton township:
- German (22.2%)
- Irish (21.7%)
- Italian (12.8%)
- United States or American (6.9%)
- Polish (5.5%)
- English (5.4%)
- Russian (4.5%)
Most common places of birth for the foreign-born residents:
- Ukraine (23%)
- Russia (14%)
- Germany (9%)
- Other Western Asia (7%)
- Other Eastern Europe (5%)
- Italy (4%)
- Yugoslavia (4%)
Means of transportation to work:
- Drove a car alone: 6,672 (84%)
- Carpooled: 552 (7%)
- Subway or elevated: 28 (0%)
- Railroad: 260 (3%)
- Motorcycle: 7 (0%)
- Bicycle: 24 (0%)
- Walked: 80 (1%)
- Other means: 16 (0%)
- Worked at home: 288 (4%)
Most commonly used house heating fuel:
- Utility gas (59%)
- Fuel oil, kerosene, etc. (25%)
- Electricity (14%)
- Bottled, tank, or LP gas (1%)
People in group quarters in Upper Southampton township, Pennsylvania:
- 132 people in other group homes
- 34 people in other noninstitutional group quarters
- 8 people in homes for the mentally retarded
- 3 people in religious group quarters
92.2% of residents of Upper Southampton township speak English at home.
1.6% of residents speak Spanish at home (83% speak English very well, 15% speak English well, 2% speak English not well).
5.2% of residents speak other Indo-European language at home (64% speak English very well, 25% speak English well, 10% speak English not well, 1% don't speak English at all).
0.4% of residents speak Asian or Pacific Island language at home (59% speak English very well, 23% speak English well, 18% speak English not well).
0.5% of residents speak other language at home (76% speak English very well, 15% speak English well, 9% speak English not well).
Household type by relationship:
Households: 15,588- In family households: 13,816 (3,653 male householders, 825 female householders)
3,971 spouses, 4,698 children (4,469 natural, 79 adopted, 150 stepchildren), 186 grandchildren, 42 brothers or sisters, 115 parents, 192 other relatives, 134 non-relatives
- In nonfamily households: 1,772 (575 male householders (470 living alone)), 977 female householders (886 living alone)), 220 nonrelatives
- In group quarters: 176 (0 institutionalized population)
Size of family households: 1,999 2-persons, 982 3-persons, 919 4-persons, 390 5-persons, 145 6-persons, 43 7-or-more-persons,
Size of nonfamily households: 1,356 1-person, 177 2-persons, 5 3-persons, 8 4-persons, 6 5-persons,
2,810 married couples with children.
337 single-parent households (82 men, 255 women).
Private vs. public school enrollment:
Students in private schools in grades 1 to 8 (elementary and middle school): 412
| Here: | 25.3% |
| Pennsylvania: | 16.0% |
Students in private schools in grades 9 to 12 (high school): 127
| Here: | 16.3% |
| Pennsylvania: | 13.1% |
Students in private undergraduate colleges: 216
| Here: | 35.0% |
| Pennsylvania: | 37.3% |