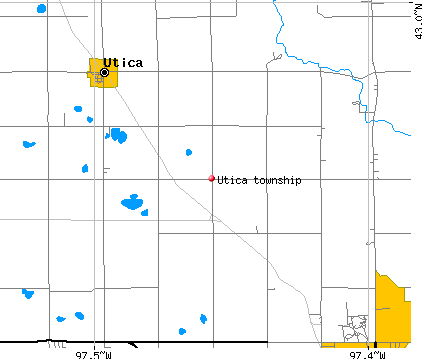
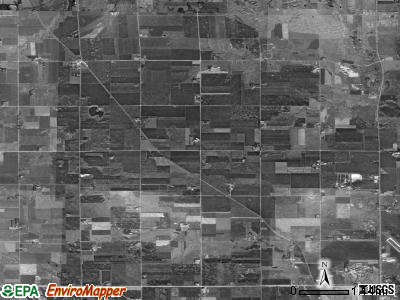
Utica township, Yankton County, South Dakota (SD) detailed profile
Land area: 35.9 sq. mi.
Water area: 0.1 sq. mi.
Population: 715 (all rural)
| Males: 468 | |
| Females: 247 |
Occupied houses/apartments: 319 (243 owner occupied, 76 renter occupied)
| % of renters here: | 24% |
| State: | 32% |
Races in Utica township:
- White Non-Hispanic: 85.0%
- Black: 1.7%
- American Indian and Alaska Native: 9.4%
- Asian: 1.1%
- Two or more races: 1.7%
Median age of males: 37.5
Median age of females: 39.5
Discuss South Dakota on our huge forum. We have over 16 million posts!
Average household size: 2.80
| Utica township: | 2.8 people |
| South Dakota: | 2.5 people |
Average family size: 3.20
| Utica township: | $48,104 |
| South Dakota: | $48,947 |
| Here: | $459 |
| State: | $529 |
Estimated median house or condo value in 2013: $132,442 (it was $73,800 in 2000)
| : | $132,442 |
| South Dakota: | $138,400 |
| Population density: 20 people per square mile | (low). |
Cities in this township include: Utica.
Notable locations in this township outside city limits:
Notable location: South Dakota Human Services Center (A). Display/hide its location on the map
78% of Utica township residents lived in the same house 5 years ago.
Out of people who lived in different houses, 33% lived in this county.
Out of people who lived in different counties, 100% lived in South Dakota.
Place of birth for U.S.-born residents:
- This state: 27
- Northeast: 0
- Midwest: 0
- South: 0
- West: 0
Percentage of households with unmarried partners: 5.3%
No gay or lesbian households reported
People in group quarters in Utica township, South Dakota:
- 188 people in mental (psychiatric) hospitals or wards
- 170 people in state prisons
- 38 people in hospitals or wards for drug/alcohol abuse
Housing units in structures:
- One, detached: 10
- Mobile homes: 6
Median worth of mobile homes: $85,000
- Metal and metal products (26%)
- Agriculture, forestry, fishing and hunting (18%)
- Machinery (9%)
- Professional, scientific, and technical services (9%)
- Accommodation and food services (8%)
- Repair and maintenance (7%)
- Electronic shopping and mail-order houses (6%)
- Educational services (21%)
- Health care (20%)
- Finance and insurance (12%)
- Accommodation and food services (10%)
- Public administration (7%)
- Professional, scientific, and technical services (6%)
- Transportation equipment (6%)
- Other production occupations including supervisors (21%)
- Farmers and farm managers (18%)
- Metal workers and plastic workers (14%)
- Accountants and auditors (9%)
- Cooks and food preparation workers (8%)
- Vehicle and mobile equipment mechanics, installers, and repairers (7%)
- Material recording, scheduling, dispatching, and distributing workers (6%)
- Other office and administrative support workers including supervisors (21%)
- Secretaries and administrative assistants (17%)
- Registered nurses (13%)
- Other sales and related workers including supervisors (9%)
- Building and grounds cleaning and maintenance occupations (7%)
- Financial clerks except bookkeeping, accounting, and auditing clerks (7%)
- Assemblers and fabricators (6%)
Most common first ancestries reported in Utica township:
- Norwegian (66.7%)
- German (33.3%)
Means of transportation to work:
- Drove a car alone: 2 (14%)
- Other means: 4 (29%)
- Worked at home: 8 (57%)
Most commonly used house heating fuel:
- Bottled, tank, or LP gas (77%)
- Electricity (23%)
People in group quarters in Utica township, South Dakota:
- 188 people in mental (psychiatric) hospitals or wards
- 170 people in state prisons
- 38 people in hospitals or wards for drug/alcohol abuse
92.6% of residents of Utica township speak English at home.
7.4% of residents speak other Indo-European language at home (100% speak English very well).
Household type by relationship:
Households: 27- In family households: 22 (8 male householders, 0 female householders)
7 spouses, 7 children (7 natural, 0 adopted, 0 stepchildren), 0 grandchildren, 0 brothers or sisters, 0 parents, 0 other relatives, 0 non-relatives
- In nonfamily households: 5 (5 male householders (5 living alone)), 0 female householders (0 living alone)), 0 nonrelatives
Size of family households: 4 2-persons, 4 4-persons,
Size of nonfamily households: 5 1-person,
85 married couples with children.
8 single-parent households (5 men, 3 women).
Private vs. public school enrollment:
Students in private schools in grades 1 to 8 (elementary and middle school): 0
| Here: | 0.0% |
| South Dakota: | 8.0% |
Students in private schools in grades 9 to 12 (high school): 0
| Here: | 0.0% |
| South Dakota: | 5.6% |