Work and Jobs in Brooklyn, New York (NY) Detailed Stats
Occupations, Industries, Unemployment, Workers, Commute
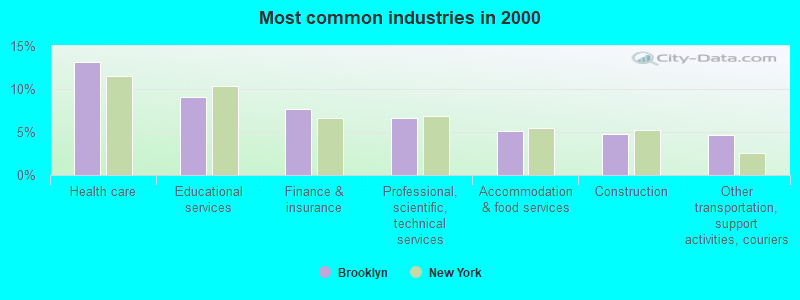
The most common industries in Brooklyn are: Health care (13.1% of civilian employees), Educational services (9.1% of civilian employees), Finance & insurance (7.6% of civilian employees). 64.4% of workers are employees of private companies, which is about the same as the rate of 63.7% across the entire state of New York.
Most common industries
Most common industries | |||
|---|---|---|---|
Industry | All | Males | Females |
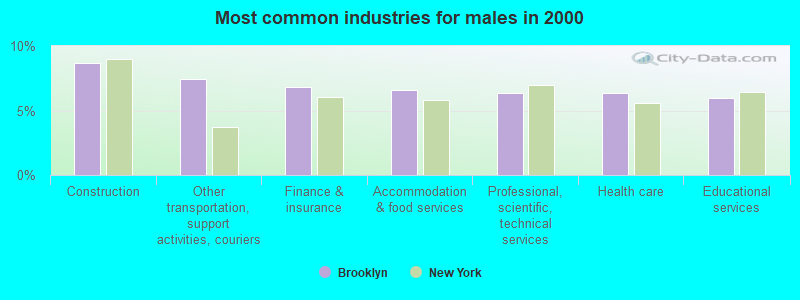
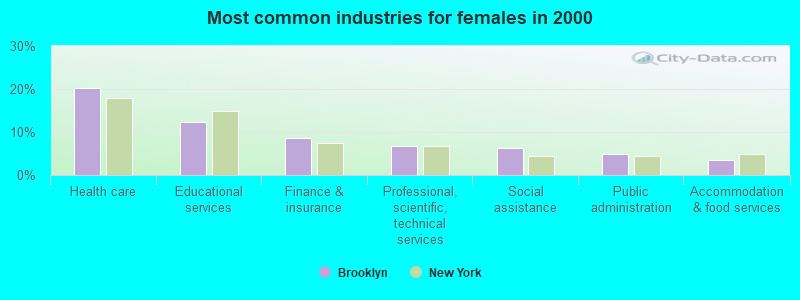
| Health care | 13.1% (121,609) | 6.3% (29,974) | 20.1% (91,635) |
| Educational services | 9.1% (84,571) | 6.0% (28,113) | 12.4% (56,458) |
| Finance and insurance | 7.6% (70,880) | 6.8% (32,224) | 8.5% (38,656) |
| Professional, scientific, and technical services | 6.6% (60,980) | 6.4% (30,119) | 6.8% (30,861) |
| Accommodation and food services | 5.1% (47,335) | 6.6% (31,118) | 3.6% (16,217) |
| Construction | 4.8% (44,696) | 8.7% (41,056) | 0.8% (3,640) |
| Other transportation, and support activities, and couriers | 4.7% (43,525) | 7.5% (35,213) | 1.8% (8,312) |
| Public administration | 4.7% (43,443) | 4.5% (21,337) | 4.9% (22,106) |
| Administrative and support and waste management services | 3.9% (35,738) | 4.5% (21,337) | 3.2% (14,401) |
| Social assistance | 3.6% (33,287) | 1.1% (5,030) | 6.2% (28,257) |
| Real estate and rental and leasing | 2.6% (23,945) | 3.5% (16,387) | 1.7% (7,558) |
| Religious, grantmaking, civic, professional, and similar organizations | 2.2% (20,056) | 1.6% (7,725) | 2.7% (12,331) |
| Apparel | 2.1% (19,264) | 1.2% (5,475) | 3.0% (13,789) |
| Publishing, and motion picture and sound recording industries | 2.0% (19,000) | 2.0% (9,557) | 2.1% (9,443) |
| Food and beverage stores | 2.0% (18,520) | 2.8% (13,123) | 1.2% (5,397) |
| Arts, entertainment, and recreation | 1.9% (17,472) | 2.0% (9,489) | 1.8% (7,983) |
| Broadcasting and telecommunications | 1.7% (15,424) | 1.9% (8,961) | 1.4% (6,463) |
| Personal and laundry services | 1.5% (13,614) | 1.4% (6,484) | 1.6% (7,130) |
| Miscellaneous manufacturing | 1.4% (13,009) | 1.7% (7,910) | 1.1% (5,099) |
| Clothing and accessories, including shoe, stores | 1.3% (11,622) | 1.1% (4,971) | 1.5% (6,651) |
| Repair and maintenance | 1.1% (10,106) | 1.9% (9,143) | 0.2% (963) |
| Department and other general merchandise stores | 1.0% (9,179) | 0.8% (3,851) | 1.2% (5,328) |
| Private households | 1.0% (9,147) | 0.1% (537) | 1.9% (8,610) |
| U. S. Postal service | 0.9% (8,597) | 1.2% (5,609) | 0.7% (2,988) |
| Data processing, libraries, and other information services | 0.8% (7,215) | 0.8% (3,858) | 0.7% (3,357) |
| Other direct selling establishments | 0.7% (6,600) | 0.8% (3,841) | 0.6% (2,759) |
| Food | 0.7% (6,408) | 1.0% (4,734) | 0.4% (1,674) |
| Groceries and related products merchant wholesalers | 0.6% (5,399) | 1.0% (4,615) | 0.2% (784) |
| Pharmacies and drug stores | 0.5% (5,083) | 0.5% (2,209) | 0.6% (2,874) |
| Printing and related support activities | 0.5% (4,944) | 0.8% (3,654) | 0.3% (1,290) |
| Miscellaneous nondurable goods merchant wholesalers | 0.5% (4,931) | 0.7% (3,291) | 0.4% (1,640) |
| Apparel, fabrics, and notions merchant wholesalers | 0.5% (4,464) | 0.5% (2,216) | 0.5% (2,248) |
| Truck transportation | 0.5% (4,441) | 0.9% (4,188) | 0.1% (253) |
| Used merchandise, gift, novelty, and souvenir, and other miscellaneous stores | 0.4% (4,019) | 0.4% (1,988) | 0.4% (2,031) |
| Radio, TV, and computer stores | 0.4% (4,003) | 0.6% (2,903) | 0.2% (1,100) |
| Utilities | 0.4% (3,899) | 0.6% (2,914) | 0.2% (985) |
| Furniture and home furnishings, and household appliance stores | 0.4% (3,755) | 0.5% (2,437) | 0.3% (1,318) |
| Air transportation | 0.4% (3,705) | 0.5% (2,245) | 0.3% (1,460) |
| Metal and metal products | 0.4% (3,575) | 0.6% (2,835) | 0.2% (740) |
| Textile mills and textile products | 0.4% (3,484) | 0.3% (1,425) | 0.5% (2,059) |
| Miscellaneous durable goods merchant wholesalers | 0.4% (3,431) | 0.4% (1,965) | 0.3% (1,466) |
| Chemicals | 0.4% (3,394) | 0.4% (1,865) | 0.3% (1,529) |
| Building material and garden equipment and supplies dealers | 0.3% (3,112) | 0.5% (2,333) | 0.2% (779) |
| Computer and electronic products | 0.3% (2,869) | 0.4% (2,081) | 0.2% (788) |
| Motor vehicle and parts dealers | 0.3% (2,618) | 0.4% (2,088) | 0.1% (530) |
| Jewelry, luggage, and leather goods stores | 0.3% (2,469) | 0.3% (1,227) | 0.3% (1,242) |
| Electronic shopping and mail-order houses | 0.2% (2,259) | 0.3% (1,391) | 0.2% (868) |
| Sporting goods, camera, and hobby and toy stores | 0.2% (2,144) | 0.3% (1,248) | 0.2% (896) |
| Furniture and related product manufacturing | 0.2% (2,144) | 0.4% (1,804) | 0.1% (340) |
| Professional and commercial equipment and supplies merchant wholesalers | 0.2% (2,025) | 0.3% (1,367) | 0.1% (658) |
| Health and personal care, except drug, stores | 0.2% (1,916) | 0.2% (782) | 0.2% (1,134) |
| Machinery | 0.2% (1,883) | 0.3% (1,575) | 0.1% (308) |
| Book stores and news dealers | 0.2% (1,763) | 0.2% (961) | 0.2% (802) |
| Paper | 0.2% (1,654) | 0.2% (1,107) | 0.1% (547) |
| Drugs, sundries, and chemical and allied products merchant wholesalers | 0.1% (1,238) | 0.1% (612) | 0.1% (626) |
| Plastics and rubber products | 0.1% (1,225) | 0.2% (837) | 0.1% (388) |
| Music stores | 0.1% (1,215) | 0.2% (850) | 0.1% (365) |
| Gasoline stations | 0.1% (1,206) | 0.2% (1,064) | 0.0% (142) |
| Machinery, equipment, and supplies merchant wholesalers | 0.1% (1,204) | 0.2% (865) | 0.1% (339) |
| Electrical and electronic goods merchant wholesalers | 0.1% (1,116) | 0.2% (853) | 0.1% (263) |
| Rail transportation | 0.1% (1,116) | 0.2% (879) | 0.1% (237) |
| Office supplies and stationery stores | 0.1% (1,060) | 0.1% (656) | 0.1% (404) |
| Electrical equipment, appliances, and components | 0.1% (973) | 0.2% (712) | 0.1% (261) |
| Transportation equipment | 0.1% (863) | 0.1% (669) | 0.0% (194) |
| Alcoholic beverages merchant wholesalers | 0.1% (821) | 0.1% (645) | 0.0% (176) |
| Nonmetallic mineral products | 0.1% (808) | 0.1% (632) | 0.0% (176) |
| Paper and paper products merchant wholesalers | 0.1% (784) | 0.1% (520) | 0.1% (264) |
| Retail florists | 0.1% (784) | 0.1% (547) | 0.1% (237) |
| Beverage and tobacco products | 0.1% (777) | 0.1% (538) | 0.1% (239) |
| Warehousing and storage | 0.1% (748) | 0.1% (653) | 0.0% (95) |
| Furniture and home furnishing merchant wholesalers | 0.1% (721) | 0.1% (541) | 0.0% (180) |
| Recyclable material merchant wholesalers | 0.1% (567) | 0.1% (538) | 0.0% (29) |
Unemployment in Brooklyn
- Unemployment by race in 2000
- Unemployment rate for White non-Hispanic residents
- 6.1%Males
- 6.1%Females
- Unemployment rate for Black residents
- 15.7%Males
- 13.9%Females
- Unemployment rate for American Indian and Alaska Native residents
- 13.2%Males
- 19.0%Females
- Unemployment rate for Asian residents
- 7.1%Males
- 7.2%Females
- Unemployment rate for other race residents
- 12.5%Males
- 17.9%Females
- Unemployment rate for two or more race residents
- 9.9%Males
- 12.7%Females
- Unemployment rate for Hispanic or Latino residents
- 12.5%Males
- 16.6%Females
Time leaving home to go to work

<5am:
| Brooklyn: | 2.3% (20,860) |
| New York: | 2.4% (194,562) |
5:30am:
| Brooklyn: | 2.2% (19,962) |
| New York: | 2.1% (174,328) |
6am:
| Brooklyn: | 2.5% (22,181) |
| New York: | 3.1% (253,826) |
6:30am:
| Brooklyn: | 6.4% (57,971) |
| New York: | 7.0% (573,349) |
7am:
| Brooklyn: | 6.4% (57,660) |
| New York: | 8.6% (706,982) |
7:30am:
| Brooklyn: | 14.3% (128,986) |
| New York: | 14.0% (1,147,579) |
8am:
| Brooklyn: | 14.6% (131,540) |
| New York: | 14.8% (1,213,706) |
8:30am:
| Brooklyn: | 17.3% (155,478) |
| New York: | 13.9% (1,144,298) |
9am:
| Brooklyn: | 7.4% (66,563) |
| New York: | 7.5% (614,475) |
10am:
| Brooklyn: | 8.6% (77,498) |
| New York: | 7.2% (593,377) |
11am:
| Brooklyn: | 3.2% (28,786) |
| New York: | 2.7% (224,011) |
12pm:
| Brooklyn: | 1.5% (13,260) |
| New York: | 1.3% (105,049) |
4pm:
| Brooklyn: | 5.8% (51,926) |
| New York: | 6.3% (517,309) |
>4pm:
| Brooklyn: | 5.3% (47,693) |
| New York: | 6.1% (501,196) |
Travel time to work


Less than 5 minutes:
| Brooklyn: | 1.1% (9,807) |
| New York: | 2.7% (219,036) |
5 to 9 minutes:
| Brooklyn: | 3.2% (28,844) |
| New York: | 8.3% (680,270) |
10 to 14 minutes:
| Brooklyn: | 5.5% (49,278) |
| New York: | 11.6% (956,590) |
15 to 19 minutes:
| Brooklyn: | 7.0% (62,705) |
| New York: | 12.4% (1,020,084) |
20 to 24 minutes:
| Brooklyn: | 7.7% (69,823) |
| New York: | 12.3% (1,013,757) |
25 to 29 minutes:
| Brooklyn: | 3.0% (26,930) |
| New York: | 4.9% (399,384) |
30 to 34 minutes:
| Brooklyn: | 15.1% (135,866) |
| New York: | 12.9% (1,058,688) |
35 to 39 minutes:
| Brooklyn: | 2.8% (25,017) |
| New York: | 2.5% (203,722) |
40 to 44 minutes:
| Brooklyn: | 6.2% (55,730) |
| New York: | 4.1% (340,311) |
45 to 59 minutes:
| Brooklyn: | 18.2% (164,110) |
| New York: | 9.8% (806,556) |
60 to 89 minutes:
| Brooklyn: | 20.4% (184,007) |
| New York: | 10.3% (848,185) |
90 or more minutes:
| Brooklyn: | 7.6% (68,247) |
| New York: | 5.1% (417,464) |
Means of transportation to work


Drove car alone:
| Brooklyn: | 22.4% (202,070) |
| New York: | 56.3% (4,620,178) |
Carpooled:
| Brooklyn: | 8.0% (72,231) |
| New York: | 9.2% (756,918) |
Bus or trolley bus:
| Brooklyn: | 10.4% (93,767) |
| New York: | 5.8% (475,389) |
Streetcar or trolley car:
| Brooklyn: | 0.2% (1,799) |
| New York: | 0.1% (6,058) |
Subway or elevated:
| Brooklyn: | 44.8% (403,327) |
| New York: | 14.8% (1,217,009) |
Railroad:
| Brooklyn: | 1.4% (12,169) |
| New York: | 2.8% (228,215) |
Ferryboat:
| Brooklyn: | 0.0% (424) |
| New York: | 0.1% (11,626) |
Taxicab:
| Brooklyn: | 0.7% (6,149) |
| New York: | 0.8% (67,897) |
Motorcycle:
| Brooklyn: | 0.0% (374) |
| New York: | 0.0% (3,625) |
Bicycle:
| Brooklyn: | 0.5% (4,846) |
| New York: | 0.3% (25,036) |
Walked:
| Brooklyn: | 8.8% (78,933) |
| New York: | 6.2% (511,721) |
Other means:
| Brooklyn: | 0.5% (4,275) |
| New York: | 0.5% (40,375) |
Private vehicle occupancy

Drove alone:
| Brooklyn: | 73.7% (202,070) |
| New York: | 85.9% (4,620,178) |
In 2 person carpool:
| Brooklyn: | 17.9% (49,024) |
| New York: | 11.0% (590,255) |
In 3 person carpool:
| Brooklyn: | 4.4% (12,178) |
| New York: | 1.8% (96,470) |
In 4 person carpool:
| Brooklyn: | 1.9% (5,203) |
| New York: | 0.7% (36,112) |
In 5-6 person carpool:
| Brooklyn: | 1.0% (2,683) |
| New York: | 0.3% (16,644) |
In 7+ person carpool:
| Brooklyn: | 1.1% (3,143) |
| New York: | 0.3% (17,437) |
Class of workers
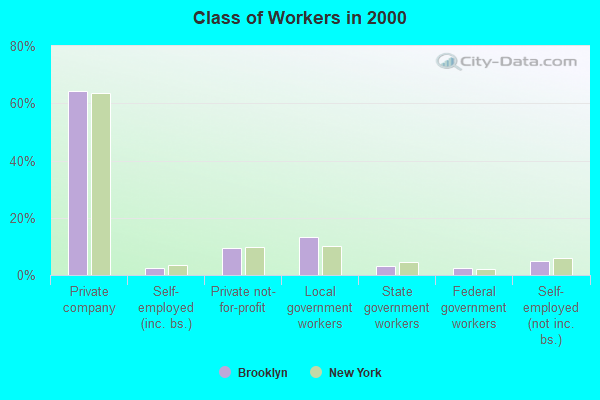
Employee of private company:
| Brooklyn: | 64.4% (596,823) |
| New York: | 63.7% (5,340,134) |
Self-employed in own incorporated business:
| Brooklyn: | 2.5% (23,615) |
| New York: | 3.4% (283,619) |
Private not-for-profit wage and salary workers:
| Brooklyn: | 9.4% (87,302) |
| New York: | 9.7% (810,356) |
Local government workers:
| Brooklyn: | 13.1% (121,570) |
| New York: | 10.2% (858,120) |
State government workers:
| Brooklyn: | 3.0% (27,527) |
| New York: | 4.6% (383,673) |
Federal government workers:
| Brooklyn: | 2.4% (21,988) |
| New York: | 2.2% (185,100) |
Self-employed workers in own not incorporated business:
| Brooklyn: | 5.0% (45,971) |
| New York: | 6.0% (501,068) |
Unpaid family workers:
| Brooklyn: | 0.2% (2,234) |
| New York: | 0.2% (20,918) |

Employee of private company - Males:
| Brooklyn: | 67.2% (317,464) |
| New York: | 66.2% (2,902,064) |
Self-employed in own incorporated business - Males:
| Brooklyn: | 3.9% (18,308) |
| New York: | 4.9% (215,651) |
Private not-for-profit wage and salary workers - Males:
| Brooklyn: | 6.8% (32,278) |
| New York: | 6.3% (277,787) |
Local government workers - Males:
| Brooklyn: | 10.9% (51,382) |
| New York: | 8.7% (380,426) |
State government workers - Males:
| Brooklyn: | 2.5% (11,804) |
| New York: | 4.1% (181,784) |
Federal government workers - Males:
| Brooklyn: | 2.4% (11,123) |
| New York: | 2.3% (102,647) |
Self-employed workers in own not incorporated business - Males:
| Brooklyn: | 6.1% (28,897) |
| New York: | 7.1% (312,497) |
Unpaid family workers - Males:
| Brooklyn: | 0.2% (931) |
| New York: | 0.2% (9,470) |

Employee of private company - Females:
| Brooklyn: | 61.4% (279,359) |
| New York: | 60.9% (2,438,070) |
Self-employed in own incorporated business - Females:
| Brooklyn: | 1.2% (5,307) |
| New York: | 1.7% (67,968) |
Private not-for-profit wage and salary workers - Females:
| Brooklyn: | 12.1% (55,024) |
| New York: | 13.3% (532,569) |
Local government workers - Females:
| Brooklyn: | 15.4% (70,188) |
| New York: | 11.9% (477,694) |
State government workers - Females:
| Brooklyn: | 3.5% (15,723) |
| New York: | 5.0% (201,889) |
Federal government workers - Females:
| Brooklyn: | 2.4% (10,865) |
| New York: | 2.1% (82,453) |
Self-employed workers in own not incorporated business - Females:
| Brooklyn: | 3.8% (17,074) |
| New York: | 4.7% (188,571) |
Unpaid family workers - Females:
| Brooklyn: | 0.3% (1,303) |
| New York: | 0.3% (11,448) |