Work and Jobs in Cortlandt, New York (NY) Detailed Stats
Occupations, Industries, Unemployment, Workers, Commute
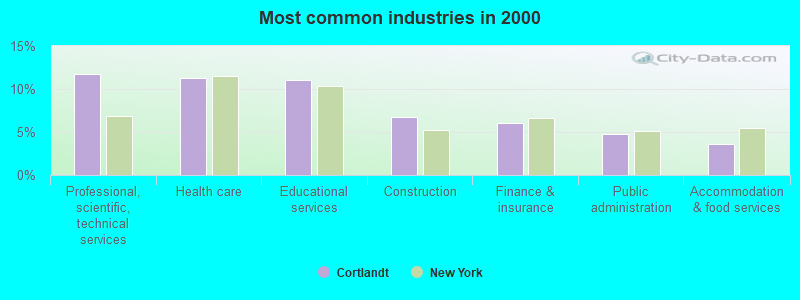
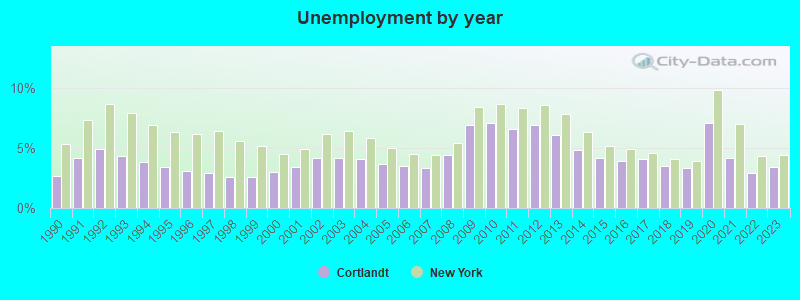
The unemployment rate in 2023 in Cortlandt, NY was 3.4%, which was 29.4% less than the unemployment rate of 4.4% across the entire state of New York. Compared to the unemployment rate of 6.1% in 2013, this represents a decrease of 79.4%. The most common industries in Cortlandt are: Professional, scientific, technical services (11.8% of civilian employees), Health care (11.3% of civilian employees), Educational services (11.0% of civilian employees). 59.9% of workers are employees of private companies, which is 6.4% less than the rate of 63.7% across the entire state of New York.
Most common industries
Most common industries | |||
|---|---|---|---|
Industry | All | Males | Females |
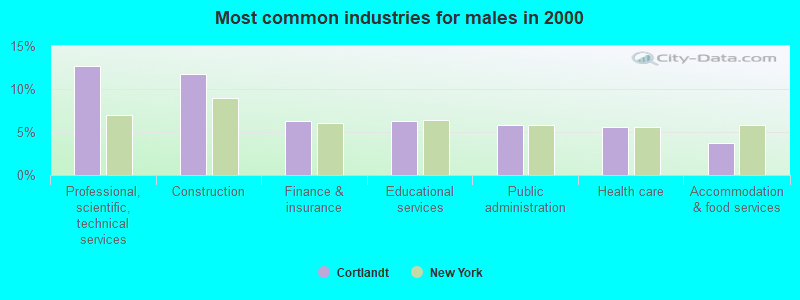
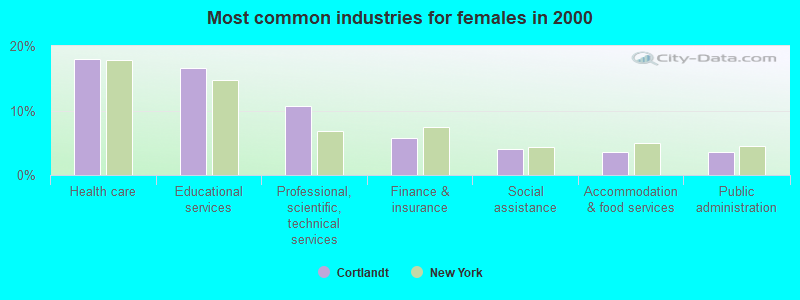
| Professional, scientific, and technical services | 11.8% (2,241) | 12.6% (1,299) | 10.7% (942) |
| Health care | 11.3% (2,154) | 5.6% (573) | 18.0% (1,581) |
| Educational services | 11.0% (2,097) | 6.2% (642) | 16.6% (1,455) |
| Construction | 6.7% (1,279) | 11.7% (1,204) | 0.9% (75) |
| Finance and insurance | 6.0% (1,150) | 6.3% (645) | 5.8% (505) |
| Public administration | 4.7% (904) | 5.8% (598) | 3.5% (306) |
| Accommodation and food services | 3.6% (690) | 3.7% (379) | 3.5% (311) |
| Administrative and support and waste management services | 3.1% (583) | 3.2% (334) | 2.8% (249) |
| Publishing, and motion picture and sound recording industries | 3.1% (582) | 2.8% (290) | 3.3% (292) |
| Broadcasting and telecommunications | 2.3% (442) | 3.1% (315) | 1.4% (127) |
| Food and beverage stores | 2.2% (413) | 2.4% (246) | 1.9% (167) |
| Real estate and rental and leasing | 2.1% (408) | 2.0% (205) | 2.3% (203) |
| Social assistance | 2.1% (399) | 0.4% (46) | 4.0% (353) |
| Arts, entertainment, and recreation | 2.1% (396) | 1.5% (151) | 2.8% (245) |
| Religious, grantmaking, civic, professional, and similar organizations | 1.7% (326) | 1.3% (134) | 2.2% (192) |
| Utilities | 1.6% (306) | 2.8% (283) | 0.3% (23) |
| Computer and electronic products | 1.5% (284) | 1.7% (176) | 1.2% (108) |
| Personal and laundry services | 1.4% (266) | 1.1% (117) | 1.7% (149) |
| Rail transportation | 1.4% (263) | 2.4% (244) | 0.2% (19) |
| Other transportation, and support activities, and couriers | 1.3% (246) | 1.9% (192) | 0.6% (54) |
| Chemicals | 1.3% (245) | 1.0% (107) | 1.6% (138) |
| Repair and maintenance | 1.1% (210) | 1.7% (174) | 0.4% (36) |
| Department and other general merchandise stores | 1.0% (194) | 0.7% (72) | 1.4% (122) |
| Building material and garden equipment and supplies dealers | 1.0% (184) | 1.5% (152) | 0.4% (32) |
| Clothing and accessories, including shoe, stores | 0.9% (162) | 0.6% (62) | 1.1% (100) |
| Motor vehicle and parts dealers | 0.8% (148) | 1.1% (118) | 0.3% (30) |
| Data processing, libraries, and other information services | 0.7% (137) | 0.6% (65) | 0.8% (72) |
| Radio, TV, and computer stores | 0.7% (134) | 1.0% (100) | 0.4% (34) |
| U. S. Postal service | 0.6% (118) | 0.8% (87) | 0.4% (31) |
| Other direct selling establishments | 0.6% (117) | 0.5% (51) | 0.8% (66) |
| Used merchandise, gift, novelty, and souvenir, and other miscellaneous stores | 0.6% (116) | 0.4% (43) | 0.8% (73) |
| Groceries and related products merchant wholesalers | 0.5% (98) | 0.7% (67) | 0.4% (31) |
| Furniture and home furnishings, and household appliance stores | 0.5% (94) | 0.4% (43) | 0.6% (51) |
| Beverage and tobacco products | 0.4% (83) | 0.3% (26) | 0.6% (57) |
| Miscellaneous manufacturing | 0.4% (77) | 0.7% (71) | 0.1% (6) |
| Pharmacies and drug stores | 0.4% (76) | 0.3% (32) | 0.5% (44) |
| Apparel, fabrics, and notions merchant wholesalers | 0.4% (71) | 0.3% (29) | 0.5% (42) |
| Private households | 0.4% (68) | 0.2% (18) | 0.6% (50) |
| Professional and commercial equipment and supplies merchant wholesalers | 0.3% (65) | 0.4% (46) | 0.2% (19) |
| Miscellaneous nondurable goods merchant wholesalers | 0.3% (65) | 0.3% (33) | 0.4% (32) |
| Truck transportation | 0.3% (61) | 0.5% (48) | 0.1% (13) |
| Metal and metal products | 0.3% (61) | 0.4% (40) | 0.2% (21) |
| Food | 0.3% (55) | 0.4% (42) | 0.1% (13) |
| Drugs, sundries, and chemical and allied products merchant wholesalers | 0.3% (53) | 0.4% (40) | 0.1% (13) |
| Health and personal care, except drug, stores | 0.3% (52) | 0.1% (10) | 0.5% (42) |
| Alcoholic beverages merchant wholesalers | 0.3% (50) | 0.5% (50) | 0.0% (0) |
| Electrical equipment, appliances, and components | 0.2% (47) | 0.3% (33) | 0.2% (14) |
| Textile mills and textile products | 0.2% (45) | 0.2% (23) | 0.3% (22) |
| Electronic shopping and mail-order houses | 0.2% (45) | 0.3% (34) | 0.1% (11) |
| Machinery | 0.2% (44) | 0.2% (16) | 0.3% (28) |
| Machinery, equipment, and supplies merchant wholesalers | 0.2% (40) | 0.3% (31) | 0.1% (9) |
| Miscellaneous durable goods merchant wholesalers | 0.2% (39) | 0.3% (26) | 0.1% (13) |
| Printing and related support activities | 0.2% (38) | 0.3% (28) | 0.1% (10) |
| Fuel dealers | 0.2% (38) | 0.3% (30) | 0.1% (8) |
| Electrical and electronic goods merchant wholesalers | 0.2% (35) | 0.3% (30) | 0.1% (5) |
| Furniture and related product manufacturing | 0.2% (31) | 0.3% (28) | 0.0% (3) |
| Gasoline stations | 0.2% (29) | 0.3% (26) | 0.0% (3) |
| Music stores | 0.2% (29) | 0.2% (25) | 0.0% (4) |
| Apparel | 0.1% (27) | 0.2% (19) | 0.1% (8) |
| Petroleum and petroleum products merchant wholesalers | 0.1% (27) | 0.2% (22) | 0.1% (5) |
| Nonmetallic mineral products | 0.1% (27) | 0.3% (27) | 0.0% (0) |
| Motor vehicles, parts and supplies merchant wholesalers | 0.1% (26) | 0.2% (19) | 0.1% (7) |
| Sporting goods, camera, and hobby and toy stores | 0.1% (26) | 0.2% (16) | 0.1% (10) |
| Agriculture, forestry, fishing and hunting | 0.1% (25) | 0.1% (14) | 0.1% (11) |
| Wood products | 0.1% (24) | 0.2% (24) | 0.0% (0) |
| Management of companies and enterprises | 0.1% (22) | 0.1% (6) | 0.2% (16) |
| Paper | 0.1% (20) | 0.0% (5) | 0.2% (15) |
| Paper and paper products merchant wholesalers | 0.1% (14) | 0.1% (14) | 0.0% (0) |
| Office supplies and stationery stores | 0.1% (14) | 0.1% (11) | 0.0% (3) |
| Recyclable material merchant wholesalers | 0.1% (13) | 0.1% (13) | 0.0% (0) |
| Lumber and other construction materials merchant wholesalers | 0.1% (13) | 0.1% (13) | 0.0% (0) |
| Book stores and news dealers | 0.1% (11) | 0.1% (11) | 0.0% (0) |
Unemployment in Cortlandt
- Unemployment by race in 2000
- Unemployment rate for White non-Hispanic residents
- 2.0%Males
- 3.4%Females
- Unemployment rate for Black residents
- 7.3%Males
- 3.5%Females
- Unemployment rate for Asian residents
- 2.7%Females
- Unemployment rate for other race residents
- 4.2%Females
- Unemployment rate for two or more race residents
- 2.9%Males
- Unemployment rate for Hispanic or Latino residents
- 1.3%Males
- 3.8%Females
Unemployment in 2023:
| Cortlandt: | 3.4% |
| New York: | 4.4% |
Unemployment in 2022:
| Cortlandt: | 2.9% |
| New York: | 4.3% |
Unemployment in 2021:
| Cortlandt: | 4.2% |
| New York: | 7.0% |
Unemployment in 2020:
| Cortlandt: | 7.1% |
| New York: | 9.8% |
Unemployment in 2019:
| Cortlandt: | 3.3% |
| New York: | 3.9% |
Unemployment in 2018:
| Cortlandt: | 3.5% |
| New York: | 4.1% |
Unemployment in 2017:
| Cortlandt: | 4.1% |
| New York: | 4.6% |
Unemployment in 2016:
| Cortlandt: | 3.9% |
| New York: | 4.9% |
Unemployment in 2015:
| Cortlandt: | 4.2% |
| New York: | 5.2% |
Unemployment in 2014:
| Cortlandt: | 4.8% |
| New York: | 6.3% |
Unemployment in 2013:
| Cortlandt: | 6.1% |
| New York: | 7.8% |
Unemployment in 2012:
| Cortlandt: | 6.9% |
| New York: | 8.6% |
Unemployment in 2011:
| Cortlandt: | 6.6% |
| New York: | 8.3% |
Unemployment in 2010:
| Cortlandt: | 7.1% |
| New York: | 8.7% |
Unemployment in 2009:
| Cortlandt: | 6.9% |
| New York: | 8.4% |
Unemployment in 2008:
| Cortlandt: | 4.4% |
| New York: | 5.4% |
Unemployment in 2007:
| Cortlandt: | 3.3% |
| New York: | 4.4% |
Unemployment in 2006:
| Cortlandt: | 3.5% |
| New York: | 4.5% |
Unemployment in 2005:
| Cortlandt: | 3.7% |
| New York: | 5.0% |
Unemployment in 2004:
| Cortlandt: | 4.1% |
| New York: | 5.8% |
Unemployment in 2003:
| Cortlandt: | 4.2% |
| New York: | 6.4% |
Unemployment in 2002:
| Cortlandt: | 4.2% |
| New York: | 6.2% |
Unemployment in 2001:
| Cortlandt: | 3.4% |
| New York: | 4.9% |
Unemployment in 2000:
| Cortlandt: | 3.0% |
| New York: | 4.5% |
Unemployment in 1999:
| Cortlandt: | 2.6% |
| New York: | 5.2% |
Unemployment in 1998:
| Cortlandt: | 2.6% |
| New York: | 5.6% |
Unemployment in 1997:
| Cortlandt: | 2.9% |
| New York: | 6.4% |
Unemployment in 1996:
| Cortlandt: | 3.1% |
| New York: | 6.2% |
Unemployment in 1995:
| Cortlandt: | 3.4% |
| New York: | 6.3% |
Unemployment in 1994:
| Cortlandt: | 3.8% |
| New York: | 6.9% |
Unemployment in 1993:
| Cortlandt: | 4.3% |
| New York: | 7.9% |
Unemployment in 1992:
| Cortlandt: | 4.9% |
| New York: | 8.7% |
Unemployment in 1991:
| Cortlandt: | 4.2% |
| New York: | 7.3% |
Unemployment in 1990:
| Cortlandt: | 2.7% |
| New York: | 5.3% |
Time leaving home to go to work

<5am:
| Cortlandt: | 1.6% (297) |
| New York: | 2.4% (194,562) |
5:30am:
| Cortlandt: | 1.5% (290) |
| New York: | 2.1% (174,328) |
6am:
| Cortlandt: | 2.2% (405) |
| New York: | 3.1% (253,826) |
6:30am:
| Cortlandt: | 8.5% (1,587) |
| New York: | 7.0% (573,349) |
7am:
| Cortlandt: | 9.5% (1,787) |
| New York: | 8.6% (706,982) |
7:30am:
| Cortlandt: | 17.3% (3,254) |
| New York: | 14.0% (1,147,579) |
8am:
| Cortlandt: | 15.5% (2,916) |
| New York: | 14.8% (1,213,706) |
8:30am:
| Cortlandt: | 14.0% (2,624) |
| New York: | 13.9% (1,144,298) |
9am:
| Cortlandt: | 6.9% (1,287) |
| New York: | 7.5% (614,475) |
10am:
| Cortlandt: | 5.8% (1,096) |
| New York: | 7.2% (593,377) |
11am:
| Cortlandt: | 2.9% (546) |
| New York: | 2.7% (224,011) |
12pm:
| Cortlandt: | 0.9% (172) |
| New York: | 1.3% (105,049) |
4pm:
| Cortlandt: | 4.3% (813) |
| New York: | 6.3% (517,309) |
>4pm:
| Cortlandt: | 3.8% (708) |
| New York: | 6.1% (501,196) |
Travel time to work


Less than 5 minutes:
| Cortlandt: | 3.1% (582) |
| New York: | 2.7% (219,036) |
5 to 9 minutes:
| Cortlandt: | 8.9% (1,663) |
| New York: | 8.3% (680,270) |
10 to 14 minutes:
| Cortlandt: | 10.1% (1,896) |
| New York: | 11.6% (956,590) |
15 to 19 minutes:
| Cortlandt: | 7.8% (1,471) |
| New York: | 12.4% (1,020,084) |
20 to 24 minutes:
| Cortlandt: | 6.0% (1,119) |
| New York: | 12.3% (1,013,757) |
25 to 29 minutes:
| Cortlandt: | 3.8% (716) |
| New York: | 4.9% (399,384) |
30 to 34 minutes:
| Cortlandt: | 11.6% (2,186) |
| New York: | 12.9% (1,058,688) |
35 to 39 minutes:
| Cortlandt: | 3.8% (710) |
| New York: | 2.5% (203,722) |
40 to 44 minutes:
| Cortlandt: | 5.2% (984) |
| New York: | 4.1% (340,311) |
45 to 59 minutes:
| Cortlandt: | 11.7% (2,197) |
| New York: | 9.8% (806,556) |
60 to 89 minutes:
| Cortlandt: | 13.9% (2,614) |
| New York: | 10.3% (848,185) |
90 or more minutes:
| Cortlandt: | 8.8% (1,644) |
| New York: | 5.1% (417,464) |
Means of transportation to work


Drove car alone:
| Cortlandt: | 69.6% (13,068) |
| New York: | 56.3% (4,620,178) |
Carpooled:
| Cortlandt: | 7.9% (1,487) |
| New York: | 9.2% (756,918) |
Bus or trolley bus:
| Cortlandt: | 0.8% (158) |
| New York: | 5.8% (475,389) |
Subway or elevated:
| Cortlandt: | 0.1% (24) |
| New York: | 14.8% (1,217,009) |
Railroad:
| Cortlandt: | 13.4% (2,525) |
| New York: | 2.8% (228,215) |
Taxicab:
| Cortlandt: | 0.1% (22) |
| New York: | 0.8% (67,897) |
Motorcycle:
| Cortlandt: | 0.1% (10) |
| New York: | 0.0% (3,625) |
Bicycle:
| Cortlandt: | 0.0% (6) |
| New York: | 0.3% (25,036) |
Walked:
| Cortlandt: | 2.1% (402) |
| New York: | 6.2% (511,721) |
Other means:
| Cortlandt: | 0.4% (80) |
| New York: | 0.5% (40,375) |
Private vehicle occupancy

Drove alone:
| Cortlandt: | 89.8% (13,068) |
| New York: | 85.9% (4,620,178) |
In 2 person carpool:
| Cortlandt: | 8.5% (1,239) |
| New York: | 11.0% (590,255) |
In 3 person carpool:
| Cortlandt: | 1.1% (162) |
| New York: | 1.8% (96,470) |
In 4 person carpool:
| Cortlandt: | 0.4% (62) |
| New York: | 0.7% (36,112) |
In 5-6 person carpool:
| Cortlandt: | 0.1% (8) |
| New York: | 0.3% (16,644) |
In 7+ person carpool:
| Cortlandt: | 0.1% (16) |
| New York: | 0.3% (17,437) |
Class of workers
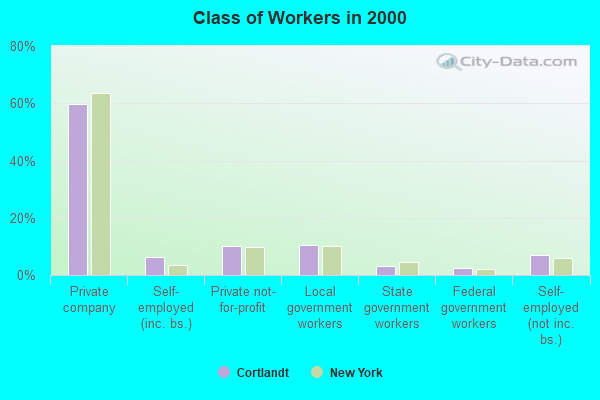
Employee of private company:
| Cortlandt: | 59.9% (11,411) |
| New York: | 63.7% (5,340,134) |
Self-employed in own incorporated business:
| Cortlandt: | 6.4% (1,220) |
| New York: | 3.4% (283,619) |
Private not-for-profit wage and salary workers:
| Cortlandt: | 10.1% (1,933) |
| New York: | 9.7% (810,356) |
Local government workers:
| Cortlandt: | 10.3% (1,967) |
| New York: | 10.2% (858,120) |
State government workers:
| Cortlandt: | 3.3% (628) |
| New York: | 4.6% (383,673) |
Federal government workers:
| Cortlandt: | 2.6% (488) |
| New York: | 2.2% (185,100) |
Self-employed workers in own not incorporated business:
| Cortlandt: | 7.2% (1,364) |
| New York: | 6.0% (501,068) |
Unpaid family workers:
| Cortlandt: | 0.2% (41) |
| New York: | 0.2% (20,918) |

Employee of private company - Males:
| Cortlandt: | 60.6% (6,229) |
| New York: | 66.2% (2,902,064) |
Self-employed in own incorporated business - Males:
| Cortlandt: | 8.8% (901) |
| New York: | 4.9% (215,651) |
Private not-for-profit wage and salary workers - Males:
| Cortlandt: | 6.3% (643) |
| New York: | 6.3% (277,787) |
Local government workers - Males:
| Cortlandt: | 9.1% (939) |
| New York: | 8.7% (380,426) |
State government workers - Males:
| Cortlandt: | 3.7% (379) |
| New York: | 4.1% (181,784) |
Federal government workers - Males:
| Cortlandt: | 3.3% (341) |
| New York: | 2.3% (102,647) |
Self-employed workers in own not incorporated business - Males:
| Cortlandt: | 8.1% (832) |
| New York: | 7.1% (312,497) |
Unpaid family workers - Males:
| Cortlandt: | 0.2% (17) |
| New York: | 0.2% (9,470) |

Employee of private company - Females:
| Cortlandt: | 59.1% (5,182) |
| New York: | 60.9% (2,438,070) |
Self-employed in own incorporated business - Females:
| Cortlandt: | 3.6% (319) |
| New York: | 1.7% (67,968) |
Private not-for-profit wage and salary workers - Females:
| Cortlandt: | 14.7% (1,290) |
| New York: | 13.3% (532,569) |
Local government workers - Females:
| Cortlandt: | 11.7% (1,028) |
| New York: | 11.9% (477,694) |
State government workers - Females:
| Cortlandt: | 2.8% (249) |
| New York: | 5.0% (201,889) |
Federal government workers - Females:
| Cortlandt: | 1.7% (147) |
| New York: | 2.1% (82,453) |
Self-employed workers in own not incorporated business - Females:
| Cortlandt: | 6.1% (532) |
| New York: | 4.7% (188,571) |
Unpaid family workers - Females:
| Cortlandt: | 0.3% (24) |
| New York: | 0.3% (11,448) |