Work and Jobs in East Jefferson, Texas (TX) Detailed Stats
Occupations, Industries, Unemployment, Workers, Commute
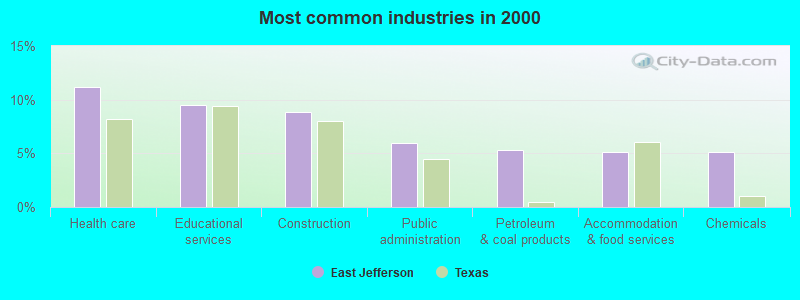
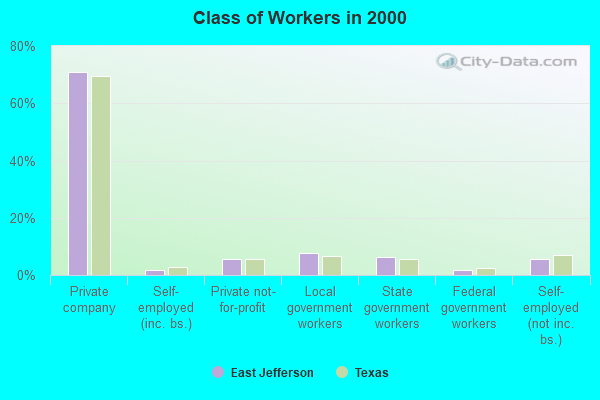
The most common industries in East Jefferson are: Health care (11.2% of civilian employees), Educational services (9.5% of civilian employees), Construction (8.9% of civilian employees). 70.9% of workers are employees of private companies, which is about the same as the rate of 69.6% across the entire state of Texas.
Most common industries
Most common industries | |||
|---|---|---|---|
Industry | All | Males | Females |
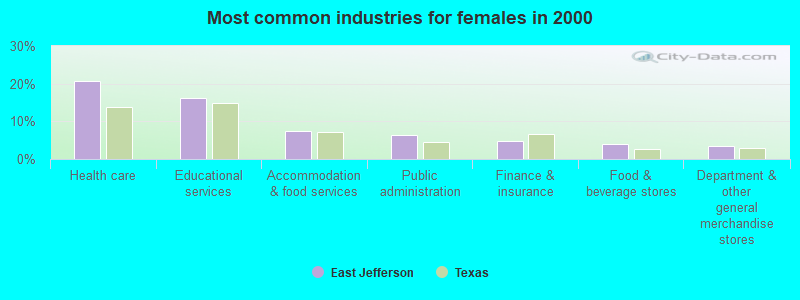
| Health care | 11.2% (4,879) | 3.1% (731) | 20.7% (4,148) |
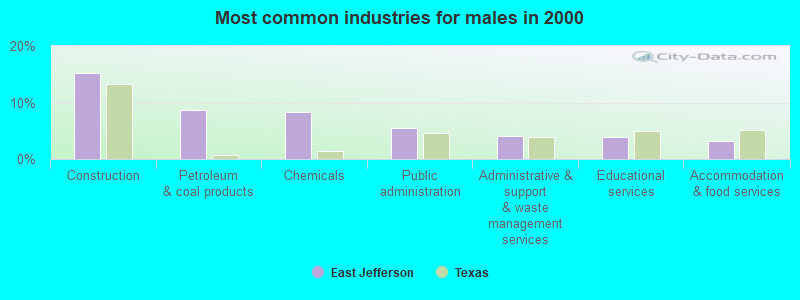
| Educational services | 9.5% (4,141) | 3.9% (911) | 16.1% (3,230) |
| Construction | 8.9% (3,866) | 15.2% (3,576) | 1.4% (290) |
| Public administration | 6.0% (2,608) | 5.5% (1,309) | 6.5% (1,299) |
| Petroleum and coal products | 5.3% (2,303) | 8.7% (2,050) | 1.3% (253) |
| Accommodation and food services | 5.1% (2,236) | 3.3% (772) | 7.3% (1,464) |
| Chemicals | 5.1% (2,234) | 8.3% (1,952) | 1.4% (282) |
| Food and beverage stores | 3.5% (1,522) | 3.1% (739) | 3.9% (783) |
| Administrative and support and waste management services | 3.4% (1,479) | 4.0% (952) | 2.6% (527) |
| Professional, scientific, and technical services | 3.2% (1,405) | 3.1% (720) | 3.4% (685) |
| Finance and insurance | 3.0% (1,291) | 1.5% (345) | 4.7% (946) |
| Department and other general merchandise stores | 2.3% (1,009) | 1.3% (304) | 3.5% (705) |
| Other transportation, and support activities, and couriers | 2.0% (851) | 2.8% (657) | 1.0% (194) |
| Repair and maintenance | 1.9% (841) | 3.2% (745) | 0.5% (96) |
| Motor vehicle and parts dealers | 1.9% (826) | 3.0% (701) | 0.6% (125) |
| Religious, grantmaking, civic, professional, and similar organizations | 1.7% (720) | 1.5% (361) | 1.8% (359) |
| Social assistance | 1.6% (701) | 0.0% (0) | 3.5% (701) |
| Metal and metal products | 1.4% (622) | 2.5% (598) | 0.1% (24) |
| Personal and laundry services | 1.4% (613) | 0.7% (161) | 2.3% (452) |
| Broadcasting and telecommunications | 1.4% (607) | 0.9% (224) | 1.9% (383) |
| Mining, quarrying, and oil and gas extraction | 1.2% (529) | 2.0% (479) | 0.2% (50) |
| Building material and garden equipment and supplies dealers | 1.2% (527) | 1.4% (340) | 0.9% (187) |
| Real estate and rental and leasing | 1.2% (517) | 1.3% (309) | 1.0% (208) |
| Truck transportation | 1.1% (486) | 1.9% (454) | 0.2% (32) |
| Transportation equipment | 1.0% (439) | 1.7% (390) | 0.2% (49) |
| Utilities | 0.8% (359) | 1.2% (290) | 0.3% (69) |
| Machinery, equipment, and supplies merchant wholesalers | 0.8% (345) | 1.2% (277) | 0.3% (68) |
| Plastics and rubber products | 0.8% (329) | 1.1% (252) | 0.4% (77) |
| Arts, entertainment, and recreation | 0.7% (298) | 0.5% (125) | 0.9% (173) |
| Agriculture, forestry, fishing and hunting | 0.7% (296) | 1.1% (254) | 0.2% (42) |
| U. S. Postal service | 0.6% (246) | 0.3% (79) | 0.8% (167) |
| Pharmacies and drug stores | 0.6% (244) | 0.4% (103) | 0.7% (141) |
| Miscellaneous manufacturing | 0.5% (216) | 0.6% (153) | 0.3% (63) |
| Publishing, and motion picture and sound recording industries | 0.5% (203) | 0.5% (129) | 0.4% (74) |
| Radio, TV, and computer stores | 0.5% (202) | 0.4% (95) | 0.5% (107) |
| Other direct selling establishments | 0.5% (199) | 0.2% (48) | 0.8% (151) |
| Machinery | 0.4% (181) | 0.6% (140) | 0.2% (41) |
| Clothing and accessories, including shoe, stores | 0.4% (176) | 0.3% (59) | 0.6% (117) |
| Used merchandise, gift, novelty, and souvenir, and other miscellaneous stores | 0.4% (158) | 0.3% (62) | 0.5% (96) |
| Private households | 0.4% (156) | 0.1% (16) | 0.7% (140) |
| Petroleum and petroleum products merchant wholesalers | 0.4% (154) | 0.5% (113) | 0.2% (41) |
| Groceries and related products merchant wholesalers | 0.3% (140) | 0.4% (100) | 0.2% (40) |
| Furniture and home furnishings, and household appliance stores | 0.3% (136) | 0.3% (82) | 0.3% (54) |
| Jewelry, luggage, and leather goods stores | 0.3% (129) | 0.2% (39) | 0.4% (90) |
| Miscellaneous nondurable goods merchant wholesalers | 0.3% (123) | 0.4% (97) | 0.1% (26) |
| Retail florists | 0.3% (117) | 0.1% (30) | 0.4% (87) |
| Water transportation | 0.3% (111) | 0.5% (111) | 0.0% (0) |
| Gasoline stations | 0.3% (111) | 0.2% (44) | 0.3% (67) |
| Nonmetallic mineral products | 0.2% (109) | 0.4% (83) | 0.1% (26) |
| Air transportation | 0.2% (103) | 0.3% (62) | 0.2% (41) |
| Professional and commercial equipment and supplies merchant wholesalers | 0.2% (100) | 0.3% (63) | 0.2% (37) |
| Sporting goods, camera, and hobby and toy stores | 0.2% (97) | 0.2% (41) | 0.3% (56) |
| Food | 0.2% (92) | 0.3% (60) | 0.2% (32) |
| Printing and related support activities | 0.2% (91) | 0.2% (41) | 0.2% (50) |
| Rail transportation | 0.2% (86) | 0.3% (80) | 0.0% (6) |
| Computer and electronic products | 0.2% (77) | 0.2% (37) | 0.2% (40) |
| Furniture and related product manufacturing | 0.2% (75) | 0.3% (68) | 0.0% (7) |
| Warehousing and storage | 0.2% (70) | 0.3% (63) | 0.0% (7) |
| Data processing, libraries, and other information services | 0.1% (63) | 0.1% (13) | 0.2% (50) |
| Electrical and electronic goods merchant wholesalers | 0.1% (53) | 0.2% (46) | 0.0% (7) |
| Paper | 0.1% (50) | 0.2% (45) | 0.0% (5) |
| Book stores and news dealers | 0.1% (49) | 0.0% (0) | 0.2% (49) |
| Hardware, plumbing and heating equipment, and supplies merchant wholesalers | 0.1% (48) | 0.1% (27) | 0.1% (21) |
| Textile mills and textile products | 0.1% (47) | 0.2% (40) | 0.0% (7) |
| Wood products | 0.1% (47) | 0.2% (36) | 0.1% (11) |
| Electrical equipment, appliances, and components | 0.1% (44) | 0.2% (36) | 0.0% (8) |
| Lumber and other construction materials merchant wholesalers | 0.1% (44) | 0.2% (44) | 0.0% (0) |
| Beverage and tobacco products | 0.1% (39) | 0.2% (36) | 0.0% (3) |
| Health and personal care, except drug, stores | 0.1% (38) | 0.1% (26) | 0.1% (12) |
| Drugs, sundries, and chemical and allied products merchant wholesalers | 0.1% (36) | 0.2% (36) | 0.0% (0) |
| Music stores | 0.1% (32) | 0.1% (25) | 0.0% (7) |
Unemployment in East Jefferson
- Unemployment by race in 2000
- Unemployment rate for White non-Hispanic residents
- 4.7%Males
- 5.6%Females
- Unemployment rate for Black residents
- 19.4%Males
- 13.0%Females
- Unemployment rate for American Indian and Alaska Native residents
- 8.2%Males
- 27.7%Females
- Unemployment rate for Asian residents
- 17.1%Males
- 20.1%Females
- Unemployment rate for other race residents
- 13.7%Males
- 18.6%Females
- Unemployment rate for two or more race residents
- 12.1%Males
- 18.9%Females
- Unemployment rate for Hispanic or Latino residents
- 12.8%Males
- 13.3%Females
Time leaving home to go to work

<5am:
| East Jefferson: | 4.9% (2,111) |
| Texas: | 3.1% (281,361) |
5:30am:
| East Jefferson: | 4.5% (1,914) |
| Texas: | 2.9% (262,060) |
6am:
| East Jefferson: | 4.9% (2,097) |
| Texas: | 4.4% (403,423) |
6:30am:
| East Jefferson: | 9.6% (4,112) |
| Texas: | 8.8% (808,876) |
7am:
| East Jefferson: | 11.3% (4,829) |
| Texas: | 10.7% (976,557) |
7:30am:
| East Jefferson: | 14.1% (6,019) |
| Texas: | 16.4% (1,500,904) |
8am:
| East Jefferson: | 18.2% (7,770) |
| Texas: | 16.8% (1,536,308) |
8:30am:
| East Jefferson: | 7.7% (3,272) |
| Texas: | 10.0% (913,601) |
9am:
| East Jefferson: | 3.5% (1,482) |
| Texas: | 4.4% (398,656) |
10am:
| East Jefferson: | 3.9% (1,671) |
| Texas: | 5.2% (472,592) |
11am:
| East Jefferson: | 2.3% (991) |
| Texas: | 2.2% (197,844) |
12pm:
| East Jefferson: | 0.9% (397) |
| Texas: | 0.9% (86,997) |
4pm:
| East Jefferson: | 5.9% (2,510) |
| Texas: | 5.5% (503,565) |
>4pm:
| East Jefferson: | 7.0% (2,969) |
| Texas: | 6.1% (563,107) |
Travel time to work


Less than 5 minutes:
| East Jefferson: | 3.9% (1,680) |
| Texas: | 3.0% (277,642) |
5 to 9 minutes:
| East Jefferson: | 14.7% (6,253) |
| Texas: | 10.3% (942,891) |
10 to 14 minutes:
| East Jefferson: | 20.9% (8,928) |
| Texas: | 14.4% (1,317,555) |
15 to 19 minutes:
| East Jefferson: | 20.9% (8,897) |
| Texas: | 16.0% (1,467,945) |
20 to 24 minutes:
| East Jefferson: | 15.1% (6,436) |
| Texas: | 13.9% (1,276,781) |
25 to 29 minutes:
| East Jefferson: | 5.2% (2,208) |
| Texas: | 5.3% (482,838) |
30 to 34 minutes:
| East Jefferson: | 11.3% (4,828) |
| Texas: | 14.3% (1,309,699) |
35 to 39 minutes:
| East Jefferson: | 1.0% (440) |
| Texas: | 2.4% (219,873) |
40 to 44 minutes:
| East Jefferson: | 0.7% (291) |
| Texas: | 3.1% (280,916) |
45 to 59 minutes:
| East Jefferson: | 1.9% (814) |
| Texas: | 7.6% (692,006) |
60 to 89 minutes:
| East Jefferson: | 1.2% (512) |
| Texas: | 4.6% (418,905) |
90 or more minutes:
| East Jefferson: | 2.0% (857) |
| Texas: | 2.4% (218,800) |
Means of transportation to work


Drove car alone:
| East Jefferson: | 83.8% (35,768) |
| Texas: | 77.7% (7,115,590) |
Carpooled:
| East Jefferson: | 11.8% (5,025) |
| Texas: | 14.5% (1,326,012) |
Bus or trolley bus:
| East Jefferson: | 0.3% (148) |
| Texas: | 1.7% (157,014) |
Taxicab:
| East Jefferson: | 0.0% (19) |
| Texas: | 0.1% (6,102) |
Motorcycle:
| East Jefferson: | 0.1% (60) |
| Texas: | 0.1% (12,068) |
Bicycle:
| East Jefferson: | 0.1% (43) |
| Texas: | 0.2% (21,551) |
Walked:
| East Jefferson: | 1.4% (609) |
| Texas: | 1.9% (173,670) |
Other means:
| East Jefferson: | 1.1% (472) |
| Texas: | 0.9% (86,692) |
Private vehicle occupancy

Drove alone:
| East Jefferson: | 87.7% (35,768) |
| Texas: | 84.3% (7,115,590) |
In 2 person carpool:
| East Jefferson: | 9.4% (3,841) |
| Texas: | 11.6% (982,994) |
In 3 person carpool:
| East Jefferson: | 1.6% (653) |
| Texas: | 2.4% (201,602) |
In 4 person carpool:
| East Jefferson: | 0.8% (320) |
| Texas: | 1.0% (83,518) |
In 5-6 person carpool:
| East Jefferson: | 0.3% (139) |
| Texas: | 0.5% (40,662) |
In 7+ person carpool:
| East Jefferson: | 0.2% (72) |
| Texas: | 0.2% (17,236) |
Class of workers
Employee of private company:
| East Jefferson: | 70.9% (30,928) |
| Texas: | 69.6% (6,425,274) |
Self-employed in own incorporated business:
| East Jefferson: | 1.8% (766) |
| Texas: | 2.7% (250,864) |
Private not-for-profit wage and salary workers:
| East Jefferson: | 5.6% (2,423) |
| Texas: | 5.7% (526,631) |
Local government workers:
| East Jefferson: | 7.7% (3,371) |
| Texas: | 6.6% (608,479) |
State government workers:
| East Jefferson: | 6.3% (2,760) |
| Texas: | 5.4% (501,082) |
Federal government workers:
| East Jefferson: | 1.8% (795) |
| Texas: | 2.6% (237,177) |
Self-employed workers in own not incorporated business:
| East Jefferson: | 5.5% (2,411) |
| Texas: | 7.1% (653,527) |
Unpaid family workers:
| East Jefferson: | 0.4% (157) |
| Texas: | 0.3% (31,338) |

Employee of private company - Males:
| East Jefferson: | 76.3% (17,997) |
| Texas: | 72.7% (3,684,731) |
Self-employed in own incorporated business - Males:
| East Jefferson: | 2.4% (570) |
| Texas: | 3.6% (183,838) |
Private not-for-profit wage and salary workers - Males:
| East Jefferson: | 3.3% (785) |
| Texas: | 3.4% (173,484) |
Local government workers - Males:
| East Jefferson: | 5.7% (1,345) |
| Texas: | 5.1% (260,804) |
State government workers - Males:
| East Jefferson: | 4.1% (971) |
| Texas: | 3.8% (190,371) |
Federal government workers - Males:
| East Jefferson: | 1.6% (385) |
| Texas: | 2.6% (133,009) |
Self-employed workers in own not incorporated business - Males:
| East Jefferson: | 6.4% (1,506) |
| Texas: | 8.4% (428,111) |
Unpaid family workers - Males:
| East Jefferson: | 0.2% (37) |
| Texas: | 0.3% (14,338) |

Employee of private company - Females:
| East Jefferson: | 64.6% (12,931) |
| Texas: | 65.8% (2,740,543) |
Self-employed in own incorporated business - Females:
| East Jefferson: | 1.0% (196) |
| Texas: | 1.6% (67,026) |
Private not-for-profit wage and salary workers - Females:
| East Jefferson: | 8.2% (1,638) |
| Texas: | 8.5% (353,147) |
Local government workers - Females:
| East Jefferson: | 10.1% (2,026) |
| Texas: | 8.3% (347,675) |
State government workers - Females:
| East Jefferson: | 8.9% (1,789) |
| Texas: | 7.5% (310,711) |
Federal government workers - Females:
| East Jefferson: | 2.0% (410) |
| Texas: | 2.5% (104,168) |
Self-employed workers in own not incorporated business - Females:
| East Jefferson: | 4.5% (905) |
| Texas: | 5.4% (225,416) |
Unpaid family workers - Females:
| East Jefferson: | 0.6% (120) |
| Texas: | 0.4% (17,000) |