Work and Jobs in Emigration, Utah (UT) Detailed Stats
Occupations, Industries, Unemployment, Workers, Commute
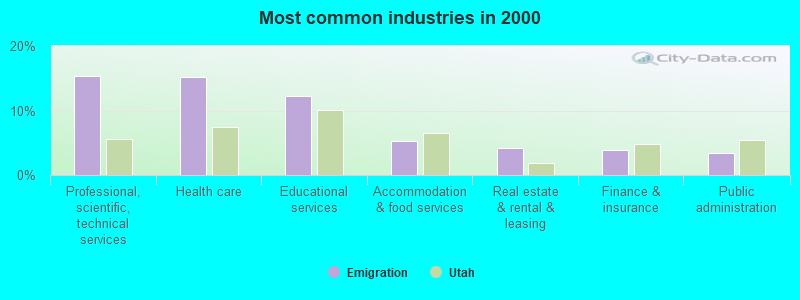
The most common industries in Emigration are: Professional, scientific, technical services (15.4% of civilian employees), Health care (15.2% of civilian employees), Educational services (12.2% of civilian employees). 55.3% of workers are employees of private companies, which is 22.9% less than the rate of 68.0% across the entire state of Utah.
Most common industries
Most common industries | |||
|---|---|---|---|
Industry | All | Males | Females |
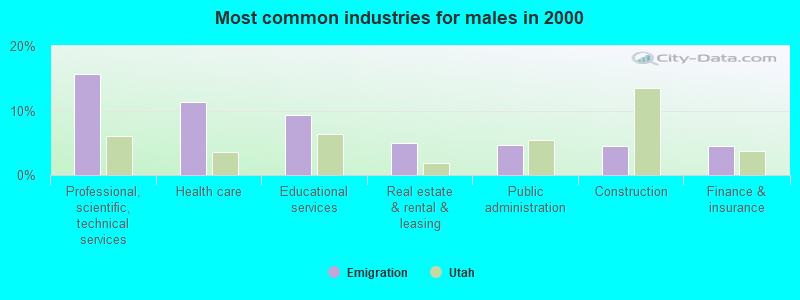
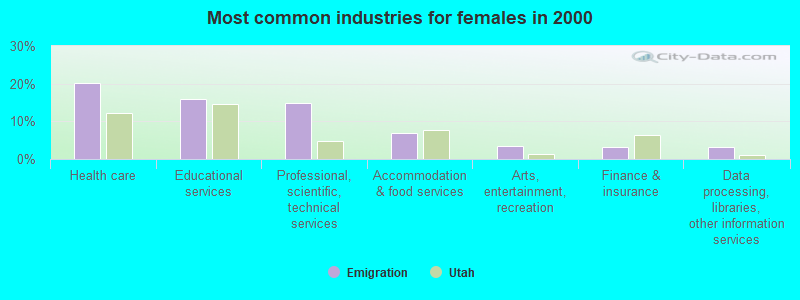
| Professional, scientific, and technical services | 15.4% (637) | 15.7% (367) | 14.9% (270) |
| Health care | 15.2% (629) | 11.3% (265) | 20.1% (364) |
| Educational services | 12.2% (507) | 9.4% (219) | 15.9% (288) |
| Accommodation and food services | 5.3% (220) | 4.0% (94) | 7.0% (126) |
| Real estate and rental and leasing | 4.1% (172) | 5.0% (118) | 3.0% (54) |
| Finance and insurance | 3.9% (161) | 4.4% (104) | 3.2% (57) |
| Public administration | 3.4% (139) | 4.7% (109) | 1.7% (30) |
| Construction | 3.0% (125) | 4.5% (105) | 1.1% (20) |
| Arts, entertainment, and recreation | 2.8% (116) | 2.3% (54) | 3.4% (62) |
| Air transportation | 2.1% (87) | 1.5% (34) | 2.9% (53) |
| Personal and laundry services | 1.9% (78) | 1.0% (24) | 3.0% (54) |
| Radio, TV, and computer stores | 1.6% (66) | 2.8% (66) | 0.0% (0) |
| Data processing, libraries, and other information services | 1.5% (64) | 0.3% (8) | 3.1% (56) |
| Chemicals | 1.4% (59) | 2.2% (51) | 0.4% (8) |
| Food and beverage stores | 1.3% (53) | 2.3% (53) | 0.0% (0) |
| Administrative and support and waste management services | 1.2% (49) | 0.6% (15) | 1.9% (34) |
| Computer and electronic products | 1.1% (46) | 2.0% (46) | 0.0% (0) |
| Social assistance | 1.0% (42) | 0.0% (0) | 2.3% (42) |
| Repair and maintenance | 1.0% (41) | 1.8% (41) | 0.0% (0) |
| Jewelry, luggage, and leather goods stores | 0.9% (38) | 1.3% (31) | 0.4% (7) |
| Metal and metal products | 0.9% (37) | 1.6% (37) | 0.0% (0) |
| Miscellaneous manufacturing | 0.9% (36) | 1.3% (31) | 0.3% (5) |
| Utilities | 0.9% (36) | 1.5% (36) | 0.0% (0) |
| Used merchandise, gift, novelty, and souvenir, and other miscellaneous stores | 0.8% (35) | 0.8% (18) | 0.9% (17) |
| Building material and garden equipment and supplies dealers | 0.8% (35) | 1.2% (27) | 0.4% (8) |
| Clothing and accessories, including shoe, stores | 0.8% (34) | 0.0% (0) | 1.9% (34) |
| Religious, grantmaking, civic, professional, and similar organizations | 0.8% (34) | 0.6% (13) | 1.2% (21) |
| Truck transportation | 0.8% (33) | 0.7% (17) | 0.9% (16) |
| Broadcasting and telecommunications | 0.8% (33) | 1.4% (33) | 0.0% (0) |
| Publishing, and motion picture and sound recording industries | 0.8% (33) | 0.9% (22) | 0.6% (11) |
| Miscellaneous nondurable goods merchant wholesalers | 0.8% (32) | 1.0% (23) | 0.5% (9) |
| Health and personal care, except drug, stores | 0.6% (26) | 0.6% (13) | 0.7% (13) |
| Motor vehicle and parts dealers | 0.6% (25) | 0.9% (20) | 0.3% (5) |
| Department and other general merchandise stores | 0.6% (24) | 0.6% (15) | 0.5% (9) |
| Other direct selling establishments | 0.5% (20) | 0.6% (15) | 0.3% (5) |
| Groceries and related products merchant wholesalers | 0.5% (20) | 0.6% (14) | 0.3% (6) |
| Agriculture, forestry, fishing and hunting | 0.5% (19) | 0.8% (19) | 0.0% (0) |
| Rail transportation | 0.5% (19) | 0.6% (13) | 0.3% (6) |
| Private households | 0.5% (19) | 0.2% (5) | 0.8% (14) |
| Professional and commercial equipment and supplies merchant wholesalers | 0.5% (19) | 0.8% (19) | 0.0% (0) |
| Printing and related support activities | 0.4% (18) | 0.0% (0) | 1.0% (18) |
| Electrical and electronic goods merchant wholesalers | 0.4% (17) | 0.7% (17) | 0.0% (0) |
| Sporting goods, camera, and hobby and toy stores | 0.4% (17) | 0.7% (17) | 0.0% (0) |
| Management of companies and enterprises | 0.4% (17) | 0.4% (9) | 0.4% (8) |
| Machinery, equipment, and supplies merchant wholesalers | 0.4% (16) | 0.0% (0) | 0.9% (16) |
| Mining, quarrying, and oil and gas extraction | 0.4% (15) | 0.6% (15) | 0.0% (0) |
| Retail florists | 0.4% (15) | 0.0% (0) | 0.8% (15) |
| Wood products | 0.4% (15) | 0.6% (15) | 0.0% (0) |
| Petroleum and coal products | 0.4% (15) | 0.6% (15) | 0.0% (0) |
| Metals and minerals, except petroleum, merchant wholesalers | 0.3% (14) | 0.6% (14) | 0.0% (0) |
| Furniture and home furnishings, and household appliance stores | 0.3% (12) | 0.5% (12) | 0.0% (0) |
| Transportation equipment | 0.3% (11) | 0.5% (11) | 0.0% (0) |
| Paper and paper products merchant wholesalers | 0.2% (10) | 0.0% (0) | 0.6% (10) |
| Furniture and related product manufacturing | 0.2% (9) | 0.4% (9) | 0.0% (0) |
| Music stores | 0.2% (9) | 0.0% (0) | 0.5% (9) |
| Pharmacies and drug stores | 0.2% (9) | 0.0% (0) | 0.5% (9) |
| U. S. Postal service | 0.2% (8) | 0.3% (8) | 0.0% (0) |
| Other transportation, and support activities, and couriers | 0.2% (7) | 0.0% (0) | 0.4% (7) |
| Food | 0.1% (6) | 0.3% (6) | 0.0% (0) |
| Drugs, sundries, and chemical and allied products merchant wholesalers | 0.1% (6) | 0.0% (0) | 0.3% (6) |
| Apparel, fabrics, and notions merchant wholesalers | 0.1% (5) | 0.0% (0) | 0.3% (5) |
Unemployment in Emigration
- Unemployment by race in 2000
- Unemployment rate for White non-Hispanic residents
- 3.3%Males
- 2.1%Females
- Unemployment rate for Hispanic or Latino residents
- 80.0%Males
Time leaving home to go to work

<5am:
| Emigration: | 0.5% (21) |
| Utah: | 3.4% (34,668) |
5:30am:
| Emigration: | 0.7% (30) |
| Utah: | 2.6% (27,208) |
6am:
| Emigration: | 1.6% (65) |
| Utah: | 4.9% (50,890) |
6:30am:
| Emigration: | 4.5% (183) |
| Utah: | 6.9% (71,407) |
7am:
| Emigration: | 7.7% (316) |
| Utah: | 9.6% (99,512) |
7:30am:
| Emigration: | 13.2% (542) |
| Utah: | 12.2% (126,423) |
8am:
| Emigration: | 15.3% (625) |
| Utah: | 14.5% (149,517) |
8:30am:
| Emigration: | 16.5% (674) |
| Utah: | 10.4% (107,893) |
9am:
| Emigration: | 9.6% (393) |
| Utah: | 5.7% (59,261) |
10am:
| Emigration: | 8.9% (364) |
| Utah: | 5.8% (59,537) |
11am:
| Emigration: | 4.8% (198) |
| Utah: | 2.6% (26,709) |
12pm:
| Emigration: | 2.5% (102) |
| Utah: | 1.4% (14,712) |
4pm:
| Emigration: | 3.4% (140) |
| Utah: | 8.5% (87,296) |
>4pm:
| Emigration: | 3.4% (141) |
| Utah: | 7.2% (74,490) |
Travel time to work


Less than 5 minutes:
| Emigration: | 1.5% (62) |
| Utah: | 4.2% (43,896) |
5 to 9 minutes:
| Emigration: | 5.9% (240) |
| Utah: | 13.9% (143,317) |
10 to 14 minutes:
| Emigration: | 12.1% (495) |
| Utah: | 16.9% (175,060) |
15 to 19 minutes:
| Emigration: | 21.2% (869) |
| Utah: | 16.8% (173,076) |
20 to 24 minutes:
| Emigration: | 26.7% (1,092) |
| Utah: | 14.6% (151,080) |
25 to 29 minutes:
| Emigration: | 8.9% (365) |
| Utah: | 5.3% (54,800) |
30 to 34 minutes:
| Emigration: | 10.7% (439) |
| Utah: | 10.8% (111,752) |
35 to 39 minutes:
| Emigration: | 0.7% (28) |
| Utah: | 1.8% (18,540) |
40 to 44 minutes:
| Emigration: | 1.1% (46) |
| Utah: | 2.3% (23,425) |
45 to 59 minutes:
| Emigration: | 1.9% (77) |
| Utah: | 4.6% (47,093) |
60 to 89 minutes:
| Emigration: | 0.8% (34) |
| Utah: | 3.0% (30,830) |
90 or more minutes:
| Emigration: | 1.1% (47) |
| Utah: | 1.6% (16,654) |
Means of transportation to work

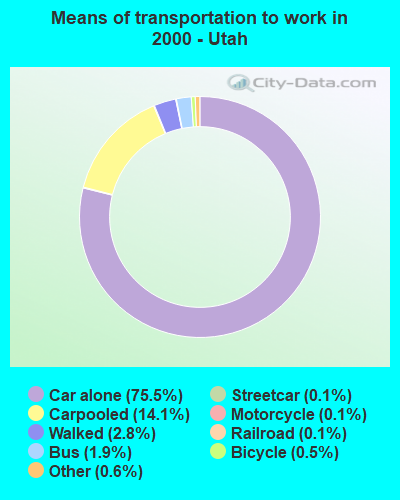
Drove car alone:
| Emigration: | 82.4% (3,372) |
| Utah: | 75.5% (779,438) |
Carpooled:
| Emigration: | 7.8% (318) |
| Utah: | 14.1% (145,950) |
Bus or trolley bus:
| Emigration: | 1.5% (62) |
| Utah: | 1.9% (19,910) |
Motorcycle:
| Emigration: | 0.1% (5) |
| Utah: | 0.1% (1,284) |
Walked:
| Emigration: | 0.4% (15) |
| Utah: | 2.8% (28,523) |
Other means:
| Emigration: | 0.5% (22) |
| Utah: | 0.6% (5,862) |
Private vehicle occupancy

Drove alone:
| Emigration: | 91.4% (3,372) |
| Utah: | 84.2% (779,438) |
In 2 person carpool:
| Emigration: | 7.2% (265) |
| Utah: | 12.2% (112,575) |
In 3 person carpool:
| Emigration: | 0.9% (34) |
| Utah: | 2.2% (19,966) |
In 4 person carpool:
| Emigration: | 0.4% (14) |
| Utah: | 0.8% (7,439) |
In 7+ person carpool:
| Emigration: | 0.1% (5) |
| Utah: | 0.2% (2,288) |
Class of workers
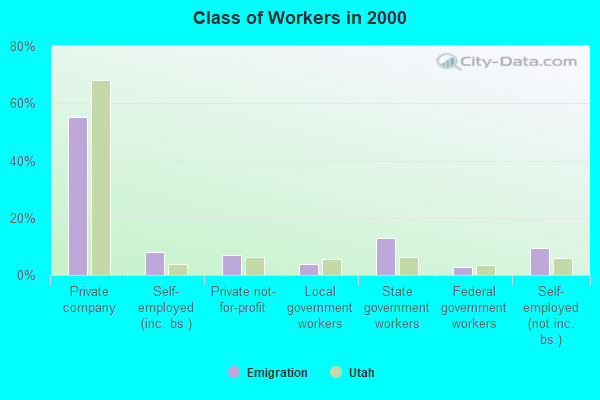
Employee of private company:
| Emigration: | 55.3% (2,295) |
| Utah: | 68.0% (709,966) |
Self-employed in own incorporated business:
| Emigration: | 8.0% (333) |
| Utah: | 3.9% (40,428) |
Private not-for-profit wage and salary workers:
| Emigration: | 7.1% (295) |
| Utah: | 6.3% (66,081) |
Local government workers:
| Emigration: | 3.8% (159) |
| Utah: | 5.7% (59,805) |
State government workers:
| Emigration: | 13.0% (541) |
| Utah: | 6.4% (66,879) |
Federal government workers:
| Emigration: | 2.6% (109) |
| Utah: | 3.6% (37,312) |
Self-employed workers in own not incorporated business:
| Emigration: | 9.6% (397) |
| Utah: | 5.8% (60,621) |
Unpaid family workers:
| Emigration: | 0.5% (20) |
| Utah: | 0.3% (3,270) |

Employee of private company - Males:
| Emigration: | 57.0% (1,335) |
| Utah: | 70.8% (409,495) |
Self-employed in own incorporated business - Males:
| Emigration: | 10.4% (243) |
| Utah: | 5.4% (31,105) |
Private not-for-profit wage and salary workers - Males:
| Emigration: | 3.1% (72) |
| Utah: | 4.7% (26,927) |
Local government workers - Males:
| Emigration: | 2.6% (62) |
| Utah: | 4.6% (26,323) |
State government workers - Males:
| Emigration: | 11.6% (271) |
| Utah: | 5.0% (28,909) |
Federal government workers - Males:
| Emigration: | 3.9% (91) |
| Utah: | 3.6% (20,562) |
Self-employed workers in own not incorporated business - Males:
| Emigration: | 11.3% (265) |
| Utah: | 5.8% (33,789) |
Unpaid family workers - Males:
| Emigration: | 0.1% (3) |
| Utah: | 0.2% (1,359) |

Employee of private company - Females:
| Emigration: | 53.1% (960) |
| Utah: | 64.5% (300,471) |
Self-employed in own incorporated business - Females:
| Emigration: | 5.0% (90) |
| Utah: | 2.0% (9,323) |
Private not-for-profit wage and salary workers - Females:
| Emigration: | 12.3% (223) |
| Utah: | 8.4% (39,154) |
Local government workers - Females:
| Emigration: | 5.4% (97) |
| Utah: | 7.2% (33,482) |
State government workers - Females:
| Emigration: | 14.9% (270) |
| Utah: | 8.1% (37,970) |
Federal government workers - Females:
| Emigration: | 1.0% (18) |
| Utah: | 3.6% (16,750) |
Self-employed workers in own not incorporated business - Females:
| Emigration: | 7.3% (132) |
| Utah: | 5.8% (26,832) |
Unpaid family workers - Females:
| Emigration: | 0.9% (17) |
| Utah: | 0.4% (1,911) |