Work and Jobs in Fort Worth, Texas (TX) Detailed Stats
Occupations, Industries, Unemployment, Workers, Commute
Settings
X


Recent posts about work in Fort Worth, Texas on our local forum with over 2,400,000 registered users:
 | Fort Worth Job Market Descent for entry level office work? (2 replies) |
| (Potential) move for a job in Fort Worth (40 replies) |
| Commute to Richardson TX from the Fort Worth "area" doable? (8 replies) |
| Relocating to Fort Worth Please help! (26 replies) |
| Relocation to Dallas Fort Worth area (0 replies) |
| Differences between Dallas & Fort Worth (34 replies) |
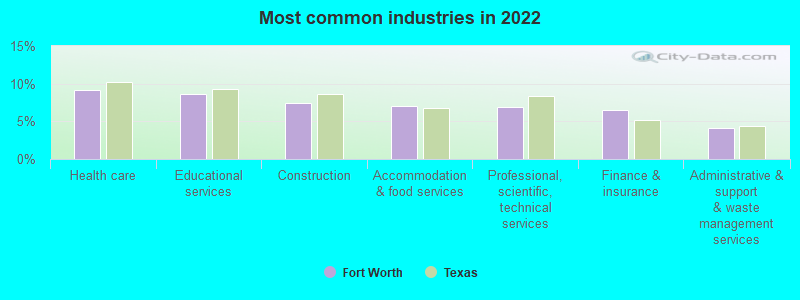
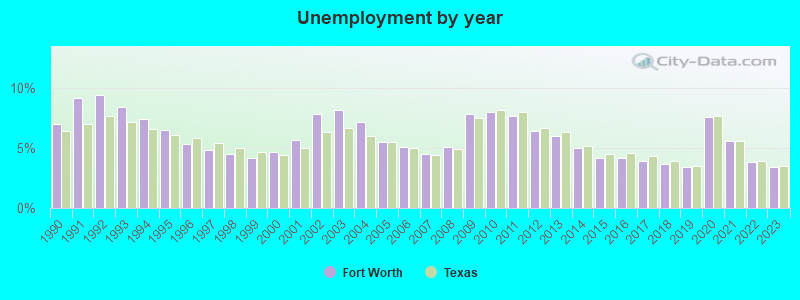
The unemployment rate in 2023 in Fort Worth, TX was 3.4%, which was 2.9% less than the unemployment rate of 3.5% across the entire state of Texas. Compared to the unemployment rate of 6.0% in 2013, this represents a decrease of 76.5%. According to 2022 data, the most common industries in Fort Worth are: Health care (9.1% of civilian employees), Educational services (8.6% of civilian employees), Construction (7.5% of civilian employees). 84.8% of workers work in Tarrant County and 15.3% of all workers work at home. 71.9% of workers are employees of private companies, which is 3.2% greater than the rate of 69.6% across the entire state of Texas.
Whole page based on the data from 2000 / 2022 when the population of Fort Worth, Texas was 534,694 / 961,160
Whole page based on the data from 2000 / 2022 when the population of Fort Worth, Texas was 534,694 / 961,160
Most common industries


Most common industries | Most common industries | |||||
|---|---|---|---|---|---|---|
Industry | All | Males | Females | All | Males | Females |
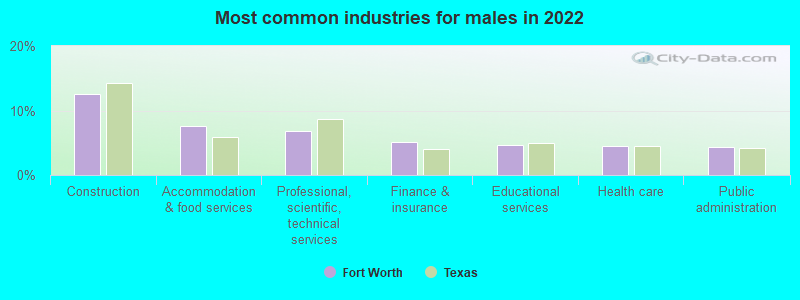
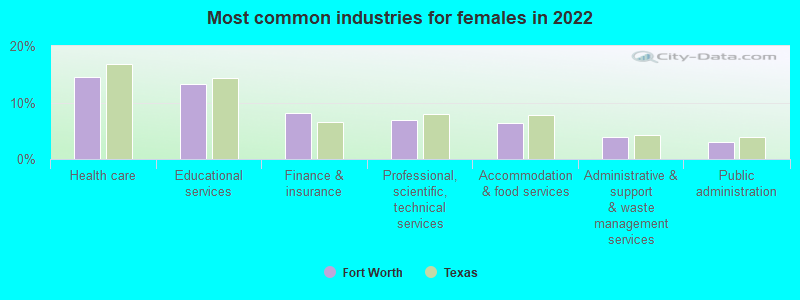
| Health care | 9.1% (43,676) | 4.5% (11,660) | 14.5% (32,016) | 8.1% (19,400) | 3.3% (4,293) | 13.9% (15,107) |
| Educational services | 8.6% (41,100) | 4.6% (11,934) | 13.2% (29,166) | 7.9% (19,082) | 4.4% (5,834) | 12.2% (13,248) |
| Construction | 7.5% (35,841) | 12.5% (32,204) | 1.6% (3,637) | 8.6% (20,728) | 14.7% (19,344) | 1.3% (1,384) |
| Accommodation and food services | 7.0% (33,457) | 7.5% (19,345) | 6.4% (14,112) | 6.2% (14,846) | 5.4% (7,107) | 7.1% (7,739) |
| Professional, scientific, and technical services | 6.9% (32,845) | 6.8% (17,524) | 6.9% (15,321) | 4.8% (11,459) | 5.0% (6,509) | 4.5% (4,950) |
| Finance and insurance | 6.5% (30,849) | 5.0% (12,953) | 8.1% (17,896) | 4.8% (11,424) | 3.3% (4,271) | 6.6% (7,153) |
| Administrative and support and waste management services | 4.1% (19,424) | 4.1% (10,657) | 4.0% (8,767) | 4.5% (10,897) | 4.7% (6,196) | 4.3% (4,701) |
| Public administration | 3.7% (17,721) | 4.3% (11,162) | 3.0% (6,559) | 3.3% (7,808) | 3.0% (3,915) | 3.6% (3,893) |
| Transportation equipment | 2.8% (13,402) | 3.9% (9,944) | 1.6% (3,458) | 3.4% (8,076) | 4.8% (6,347) | 1.6% (1,729) |
| Other transportation, and support activities, and couriers | 2.7% (13,108) | 3.3% (8,479) | 2.1% (4,629) | 1.4% (3,333) | 1.8% (2,407) | 0.9% (926) |
| Truck transportation | 2.2% (10,288) | 3.3% (8,471) | 0.8% (1,817) | 1.3% (3,082) | 2.0% (2,673) | 0.4% (409) |
| Food and beverage stores | 2.0% (9,514) | 2.0% (5,152) | 2.0% (4,362) | 2.3% (5,436) | 2.2% (2,927) | 2.3% (2,509) |
| Department and other general merchandise stores | 1.8% (8,843) | 1.2% (3,103) | 2.6% (5,740) | 1.9% (4,541) | 1.1% (1,435) | 2.9% (3,106) |
| Real estate and rental and leasing | 1.8% (8,729) | 1.5% (3,940) | 2.2% (4,789) | 2.0% (4,820) | 2.0% (2,651) | 2.0% (2,169) |
| Arts, entertainment, and recreation | 1.8% (8,489) | 1.9% (4,857) | 1.6% (3,632) | 1.4% (3,441) | 1.4% (1,811) | 1.5% (1,630) |
| Motor vehicle and parts dealers | 1.6% (7,605) | 2.2% (5,754) | 0.8% (1,851) | 1.5% (3,673) | 2.3% (2,972) | 0.6% (701) |
| Religious, grantmaking, civic, professional, and similar organizations | 1.6% (7,505) | 1.2% (3,168) | 2.0% (4,337) | 1.5% (3,554) | 1.3% (1,692) | 1.7% (1,862) |
| Personal and laundry services | 1.5% (7,350) | 0.7% (1,737) | 2.5% (5,613) | 1.4% (3,330) | 0.7% (912) | 2.2% (2,418) |
| Air transportation | 1.5% (7,341) | 1.8% (4,544) | 1.3% (2,797) | 1.7% (4,162) | 2.0% (2,622) | 1.4% (1,540) |
| Warehousing and storage | 1.4% (6,888) | 1.9% (4,846) | 0.9% (2,042) | 0.4% (991) | 0.4% (586) | 0.4% (405) |
| Repair and maintenance | 1.4% (6,866) | 2.1% (5,446) | 0.6% (1,420) | 1.8% (4,252) | 2.9% (3,812) | 0.4% (440) |
| Social assistance | 1.4% (6,629) | 0.1% (202) | 2.9% (6,427) | 1.8% (4,318) | 0.4% (570) | 3.4% (3,748) |
| Miscellaneous manufacturing | 1.1% (5,329) | 1.7% (4,310) | 0.5% (1,019) | 1.5% (3,669) | 1.7% (2,186) | 1.4% (1,483) |
| Electronic shopping and mail-order houses | 1.1% (5,298) | 1.1% (2,817) | 1.1% (2,481) | 0.2% (395) | 0.1% (164) | 0.2% (231) |
| Food | 1.1% (5,231) | 1.5% (3,840) | 0.6% (1,391) | 1.1% (2,725) | 1.3% (1,700) | 0.9% (1,025) |
| Metal and metal products | 0.9% (4,407) | 1.6% (4,001) | 0.2% (406) | 1.3% (3,043) | 1.9% (2,499) | 0.5% (544) |
| Broadcasting and telecommunications | 0.9% (4,196) | 0.8% (2,094) | 1.0% (2,102) | 1.7% (4,140) | 1.5% (2,015) | 2.0% (2,125) |
| Machinery | 0.9% (4,172) | 1.3% (3,250) | 0.4% (922) | 0.8% (2,036) | 1.2% (1,523) | 0.5% (513) |
| U. S. Postal service | 0.8% (3,654) | 0.9% (2,422) | 0.6% (1,232) | 0.8% (1,914) | 0.9% (1,175) | 0.7% (739) |
| Utilities | 0.8% (3,595) | 1.2% (2,984) | 0.3% (611) | 0.5% (1,212) | 0.7% (982) | 0.2% (230) |
| Building material and garden equipment and supplies dealers | 0.7% (3,491) | 0.6% (1,654) | 0.8% (1,837) | 0.7% (1,721) | 0.9% (1,245) | 0.4% (476) |
| Clothing and accessories, including shoe, stores | 0.7% (3,483) | 0.4% (1,039) | 1.1% (2,444) | 0.7% (1,744) | 0.3% (447) | 1.2% (1,297) |
| Health and personal care, except drug, stores | 0.7% (3,415) | 0.2% (425) | 1.4% (2,990) | 0.2% (560) | 0.1% (139) | 0.4% (421) |
| Pharmacies and drug stores | 0.7% (3,412) | 0.5% (1,311) | 1.0% (2,101) | 0.5% (1,196) | 0.3% (421) | 0.7% (775) |
| Chemicals | 0.6% (2,995) | 0.6% (1,433) | 0.7% (1,562) | 0.5% (1,140) | 0.5% (646) | 0.5% (494) |
| Mining, quarrying, and oil and gas extraction | 0.6% (2,945) | 0.8% (2,013) | 0.4% (932) | 0.4% (877) | 0.4% (579) | 0.3% (298) |
| Used merchandise, gift, novelty, and souvenir, and other miscellaneous stores | 0.6% (2,750) | 0.5% (1,163) | 0.7% (1,587) | 0.7% (1,657) | 0.5% (619) | 1.0% (1,038) |
| Rail transportation | 0.5% (2,427) | 0.8% (1,930) | 0.2% (497) | 0.7% (1,567) | 1.0% (1,267) | 0.3% (300) |
| Radio, TV, and computer stores | 0.5% (2,306) | 0.6% (1,661) | 0.3% (645) | 1.2% (2,933) | 1.3% (1,662) | 1.2% (1,271) |
| Other direct selling establishments | 0.5% (2,272) | 0.2% (479) | 0.8% (1,793) | 0.6% (1,508) | 0.5% (691) | 0.8% (817) |
| Gasoline stations | 0.5% (2,176) | 0.6% (1,545) | 0.3% (631) | 0.2% (505) | 0.2% (250) | 0.2% (255) |
| Private households | 0.4% (2,126) | 0.0% (0) | 1.0% (2,126) | 0.5% (1,110) | 0.1% (169) | 0.9% (941) |
| Furniture and home furnishings, and household appliance stores | 0.4% (2,115) | 0.4% (1,002) | 0.5% (1,113) | 0.6% (1,494) | 0.6% (839) | 0.6% (655) |
| Electrical and electronic goods merchant wholesalers | 0.4% (1,934) | 0.2% (537) | 0.6% (1,397) | 0.4% (939) | 0.5% (691) | 0.2% (248) |
| Groceries and related products merchant wholesalers | 0.4% (1,897) | 0.4% (1,139) | 0.3% (758) | 0.8% (1,849) | 1.1% (1,399) | 0.4% (450) |
| Beverage and tobacco products | 0.4% (1,862) | 0.7% (1,741) | 0.1% (121) | 0.2% (518) | 0.3% (415) | 0.1% (103) |
| Computer and electronic products | 0.4% (1,813) | 0.3% (833) | 0.4% (980) | 1.8% (4,434) | 1.8% (2,417) | 1.9% (2,017) |
| Printing and related support activities | 0.4% (1,795) | 0.5% (1,180) | 0.3% (615) | 0.8% (1,821) | 0.9% (1,188) | 0.6% (633) |
| Sporting goods, camera, and hobby and toy stores | 0.3% (1,444) | 0.4% (1,093) | 0.2% (351) | 0.3% (672) | 0.3% (347) | 0.3% (325) |
| Wood products | 0.3% (1,308) | 0.5% (1,308) | 0.0% (0) | 0.5% (1,104) | 0.7% (937) | 0.2% (167) |
| Drugs, sundries, and chemical and allied products merchant wholesalers | 0.3% (1,244) | 0.4% (940) | 0.1% (304) | 0.2% (437) | 0.1% (193) | 0.2% (244) |
| Publishing, and motion picture and sound recording industries | 0.3% (1,211) | 0.4% (1,059) | 0.1% (152) | 0.9% (2,183) | 1.0% (1,253) | 0.9% (930) |
| Nonmetallic mineral products | 0.2% (1,178) | 0.4% (909) | 0.1% (269) | 0.4% (882) | 0.5% (680) | 0.2% (202) |
| Motor vehicles, parts and supplies merchant wholesalers | 0.2% (1,063) | 0.4% (901) | 0.1% (162) | 0.3% (764) | 0.4% (566) | 0.2% (198) |
| Professional and commercial equipment and supplies merchant wholesalers | 0.2% (923) | 0.2% (610) | 0.1% (313) | 0.3% (822) | 0.4% (481) | 0.3% (341) |
| Machinery, equipment, and supplies merchant wholesalers | 0.2% (876) | 0.3% (798) | 0.0% (78) | 0.4% (866) | 0.5% (712) | 0.1% (154) |
| Lumber and other construction materials merchant wholesalers | 0.2% (831) | 0.3% (754) | 0.0% (77) | 0.2% (534) | 0.3% (451) | 0.1% (83) |
| Hardware, plumbing and heating equipment, and supplies merchant wholesalers | 0.2% (723) | 0.2% (500) | 0.1% (223) | 0.2% (370) | 0.2% (234) | 0.1% (136) |
| Plastics and rubber products | 0.1% (695) | 0.1% (340) | 0.2% (355) | 0.6% (1,375) | 0.7% (856) | 0.5% (519) |
| Agriculture, forestry, fishing and hunting | 0.1% (641) | 0.2% (387) | 0.1% (254) | 0.2% (424) | 0.3% (375) | 0.0% (49) |
| Paper | 0.1% (633) | 0.2% (594) | 0.0% (39) | 0.3% (742) | 0.4% (544) | 0.2% (198) |
| Data processing, libraries, and other information services | 0.1% (596) | 0.1% (258) | 0.2% (338) | 0.4% (883) | 0.3% (437) | 0.4% (446) |
| Textile mills and textile products | 0.1% (595) | 0.2% (417) | 0.1% (178) | 0.2% (380) | 0.1% (168) | 0.2% (212) |
| Book stores and news dealers | 0.1% (572) | 0.1% (239) | 0.2% (333) | 0.1% (343) | 0.1% (138) | 0.2% (205) |
| Petroleum and petroleum products merchant wholesalers | 0.1% (536) | 0.2% (457) | 0.0% (79) | 0.1% (319) | 0.1% (177) | 0.1% (142) |
| Jewelry, luggage, and leather goods stores | 0.1% (483) | 0.0% (0) | 0.2% (483) | 0.1% (268) | 0.1% (92) | 0.2% (176) |
| Apparel, fabrics, and notions merchant wholesalers | 0.1% (394) | 0.1% (136) | 0.1% (258) | 0.1% (251) | 0.1% (68) | 0.2% (183) |
| Miscellaneous durable goods merchant wholesalers | 0.1% (315) | 0.1% (133) | 0.1% (182) | 0.2% (408) | 0.2% (230) | 0.2% (178) |
| Alcoholic beverages merchant wholesalers | 0.1% (286) | 0.1% (286) | 0.0% (0) | 0.1% (353) | 0.2% (279) | 0.1% (74) |
| Furniture and home furnishing merchant wholesalers | 0.1% (285) | 0.0% (0) | 0.1% (285) | 0.1% (259) | 0.2% (215) | 0.0% (44) |
| Miscellaneous nondurable goods merchant wholesalers | 0.1% (282) | 0.0% (55) | 0.1% (227) | 0.3% (773) | 0.4% (589) | 0.2% (184) |
| Recyclable material merchant wholesalers | 0.0% (205) | 0.1% (205) | 0.0% (0) | 0.1% (347) | 0.2% (272) | 0.1% (75) |
| Furniture and related product manufacturing | 0.0% (177) | 0.1% (177) | 0.0% (0) | 0.4% (923) | 0.5% (720) | 0.2% (203) |
| Office supplies and stationery stores | 0.0% (163) | 0.0% (60) | 0.0% (103) | 0.2% (401) | 0.2% (252) | 0.1% (149) |
| Metals and minerals, except petroleum, merchant wholesalers | 0.0% (158) | 0.0% (49) | 0.0% (109) | 0.1% (203) | 0.1% (155) | 0.0% (48) |
| Electrical equipment, appliances, and components | 0.0% (157) | 0.0% (29) | 0.1% (128) | 0.4% (907) | 0.4% (503) | 0.4% (404) |
| Petroleum and coal products | 0.0% (156) | 0.0% (67) | 0.0% (89) | 0.2% (416) | 0.2% (233) | 0.2% (183) |
| Leather and allied products | 0.0% (98) | 0.0% (0) | 0.0% (98) | 0.1% (274) | 0.1% (122) | 0.1% (152) |
| Apparel | 0.0% (95) | 0.0% (0) | 0.0% (95) | 0.3% (667) | 0.2% (224) | 0.4% (443) |
| Music stores | 0.0% (0) | 0.0% (0) | 0.0% (0) | 0.1% (264) | 0.1% (139) | 0.1% (125) |
| Paper and paper products merchant wholesalers | 0.0% (0) | 0.0% (0) | 0.0% (0) | 0.1% (325) | 0.1% (175) | 0.1% (150) |
Unemployment in Fort Worth
- Unemployment by race in 2022
- Unemployment rate for White non-Hispanic residents
- 3.2%Males
- 2.9%Females
- Unemployment rate for Black residents
- 6.8%Males
- 7.9%Females
- Unemployment rate for American Indian and Alaska Native residents
- 2.0%Males
- 0.9%Females
- Unemployment rate for Asian residents
- 1.9%Males
- 5.0%Females
- Unemployment rate for other race residents
- 1.0%Males
- 3.9%Females
- Unemployment rate for two or more race residents
- 4.1%Males
- 2.3%Females
- Unemployment rate for Hispanic or Latino residents
- 3.7%Males
- 3.5%Females
- Unemployment by race in 2000
- Unemployment rate for White non-Hispanic residents
- 3.3%Males
- 4.0%Females
- Unemployment rate for Black residents
- 12.0%Males
- 9.9%Females
- Unemployment rate for American Indian and Alaska Native residents
- 4.6%Males
- 11.3%Females
- Unemployment rate for Asian residents
- 3.7%Males
- 4.8%Females
- Unemployment rate for other race residents
- 6.1%Males
- 9.2%Females
- Unemployment rate for two or more race residents
- 6.9%Males
- 8.2%Females
- Unemployment rate for Hispanic or Latino residents
- 6.1%Males
- 9.8%Females
Unemployment in 2023:
| Fort Worth: | 3.4% |
| Texas: | 3.5% |
Unemployment in 2022:
| Fort Worth: | 3.8% |
| Texas: | 3.9% |
Unemployment in 2021:
| Fort Worth: | 5.6% |
| Texas: | 5.6% |
Unemployment in 2020:
| Fort Worth: | 7.6% |
| Texas: | 7.7% |
Unemployment in 2019:
| Fort Worth: | 3.4% |
| Texas: | 3.5% |
Unemployment in 2018:
| Fort Worth: | 3.7% |
| Texas: | 3.9% |
Unemployment in 2017:
| Fort Worth: | 3.9% |
| Texas: | 4.3% |
Unemployment in 2016:
| Fort Worth: | 4.2% |
| Texas: | 4.6% |
Unemployment in 2015:
| Fort Worth: | 4.2% |
| Texas: | 4.5% |
Unemployment in 2014:
| Fort Worth: | 5.0% |
| Texas: | 5.2% |
Unemployment in 2013:
| Fort Worth: | 6.0% |
| Texas: | 6.3% |
Unemployment in 2012:
| Fort Worth: | 6.4% |
| Texas: | 6.7% |
Unemployment in 2011:
| Fort Worth: | 7.7% |
| Texas: | 8.0% |
Unemployment in 2010:
| Fort Worth: | 8.0% |
| Texas: | 8.2% |
Unemployment in 2009:
| Fort Worth: | 7.8% |
| Texas: | 7.5% |
Unemployment in 2008:
| Fort Worth: | 5.1% |
| Texas: | 4.9% |
Unemployment in 2007:
| Fort Worth: | 4.5% |
| Texas: | 4.4% |
Unemployment in 2006:
| Fort Worth: | 5.1% |
| Texas: | 5.0% |
Unemployment in 2005:
| Fort Worth: | 5.5% |
| Texas: | 5.5% |
Unemployment in 2004:
| Fort Worth: | 7.2% |
| Texas: | 6.0% |
Unemployment in 2003:
| Fort Worth: | 8.2% |
| Texas: | 6.7% |
Unemployment in 2002:
| Fort Worth: | 7.8% |
| Texas: | 6.3% |
Unemployment in 2001:
| Fort Worth: | 5.7% |
| Texas: | 5.0% |
Unemployment in 2000:
| Fort Worth: | 4.7% |
| Texas: | 4.4% |
Unemployment in 1999:
| Fort Worth: | 4.2% |
| Texas: | 4.7% |
Unemployment in 1998:
| Fort Worth: | 4.5% |
| Texas: | 5.0% |
Unemployment in 1997:
| Fort Worth: | 4.8% |
| Texas: | 5.4% |
Unemployment in 1996:
| Fort Worth: | 5.3% |
| Texas: | 5.8% |
Unemployment in 1995:
| Fort Worth: | 6.5% |
| Texas: | 6.1% |
Unemployment in 1994:
| Fort Worth: | 7.4% |
| Texas: | 6.6% |
Unemployment in 1993:
| Fort Worth: | 8.4% |
| Texas: | 7.2% |
Unemployment in 1992:
| Fort Worth: | 9.4% |
| Texas: | 7.7% |
Unemployment in 1991:
| Fort Worth: | 9.2% |
| Texas: | 7.0% |
Unemployment in 1990:
| Fort Worth: | 7.0% |
| Texas: | 6.4% |
Time leaving home to go to work

12:00 a.m. to 4:59 a.m.:
| Fort Worth: | 5.3% (21,250) |
| Texas: | 5.5% (678,264) |
5:00 a.m. to 5:29 a.m.:
| Fort Worth: | 5.9% (23,663) |
| Texas: | 4.3% (525,841) |
5:30 a.m. to 5:59 a.m.:
| Fort Worth: | 5.2% (21,043) |
| Texas: | 4.9% (603,953) |
6:00 a.m. to 6:29 a.m.:
| Fort Worth: | 9.5% (38,295) |
| Texas: | 9.4% (1,155,020) |
6:30 a.m. to 6:59 a.m.:
| Fort Worth: | 9.1% (36,578) |
| Texas: | 9.3% (1,152,822) |
7:00 a.m. to 7:29 a.m.:
| Fort Worth: | 15.0% (60,006) |
| Texas: | 15.3% (1,885,477) |
7:30 a.m. to 7:59 a.m.:
| Fort Worth: | 10.2% (40,732) |
| Texas: | 11.9% (1,469,628) |
8:00 a.m. to 8:29 a.m.:
| Fort Worth: | 11.1% (44,530) |
| Texas: | 11.3% (1,400,175) |
8:30 a.m. to 8:59 a.m.:
| Fort Worth: | 4.2% (16,898) |
| Texas: | 4.9% (599,574) |
9:00 a.m. to 9:59 a.m.:
| Fort Worth: | 5.5% (22,030) |
| Texas: | 6.7% (829,367) |
10:00 a.m. to 10:59 a.m.:
| Fort Worth: | 3.0% (11,997) |
| Texas: | 3.2% (390,354) |
11:00 a.m. to 11:59 a.m.:
| Fort Worth: | 1.1% (4,379) |
| Texas: | 1.3% (162,330) |
12:00 p.m. to 3:59 p.m.:
| Fort Worth: | 7.7% (31,019) |
| Texas: | 5.8% (720,594) |
4:00 p.m. to 11:59 p.m.:
| Fort Worth: | 7.2% (28,763) |
| Texas: | 6.3% (777,072) |

<5am:
| Fort Worth: | 3.3% (7,701) |
| Texas: | 3.1% (281,361) |
5:30am:
| Fort Worth: | 3.0% (7,130) |
| Texas: | 2.9% (262,060) |
6am:
| Fort Worth: | 4.7% (11,042) |
| Texas: | 4.4% (403,423) |
6:30am:
| Fort Worth: | 9.4% (22,174) |
| Texas: | 8.8% (808,876) |
7am:
| Fort Worth: | 10.3% (24,338) |
| Texas: | 10.7% (976,557) |
7:30am:
| Fort Worth: | 14.9% (35,027) |
| Texas: | 16.4% (1,500,904) |
8am:
| Fort Worth: | 15.3% (36,064) |
| Texas: | 16.8% (1,536,308) |
8:30am:
| Fort Worth: | 10.1% (23,932) |
| Texas: | 10.0% (913,601) |
9am:
| Fort Worth: | 4.8% (11,243) |
| Texas: | 4.4% (398,656) |
10am:
| Fort Worth: | 5.3% (12,589) |
| Texas: | 5.2% (472,592) |
11am:
| Fort Worth: | 2.1% (4,910) |
| Texas: | 2.2% (197,844) |
12pm:
| Fort Worth: | 1.0% (2,282) |
| Texas: | 0.9% (86,997) |
4pm:
| Fort Worth: | 6.6% (15,625) |
| Texas: | 5.5% (503,565) |
>4pm:
| Fort Worth: | 7.1% (16,843) |
| Texas: | 6.1% (563,107) |

12:00 a.m. to 4:59 a.m. - Males:
| Fort Worth: | 7.2% (15,905) |
| Texas: | 7.0% (477,284) |
5:00 a.m. to 5:29 a.m. - Males:
| Fort Worth: | 7.8% (17,176) |
| Texas: | 5.8% (394,876) |
5:30 a.m. to 5:59 a.m. - Males:
| Fort Worth: | 6.2% (13,704) |
| Texas: | 5.9% (402,788) |
6:00 a.m. to 6:29 a.m. - Males:
| Fort Worth: | 10.9% (24,079) |
| Texas: | 10.9% (751,118) |
6:30 a.m. to 6:59 a.m. - Males:
| Fort Worth: | 10.5% (23,245) |
| Texas: | 9.5% (652,306) |
7:00 a.m. to 7:29 a.m. - Males:
| Fort Worth: | 13.8% (30,453) |
| Texas: | 14.1% (970,598) |
7:30 a.m. to 7:59 a.m. - Males:
| Fort Worth: | 8.9% (19,666) |
| Texas: | 10.2% (696,429) |
8:00 a.m. to 8:29 a.m. - Males:
| Fort Worth: | 8.6% (19,091) |
| Texas: | 10.6% (729,041) |
8:30 a.m. to 8:59 a.m. - Males:
| Fort Worth: | 2.8% (6,116) |
| Texas: | 4.1% (281,762) |
9:00 a.m. to 9:59 a.m. - Males:
| Fort Worth: | 4.3% (9,460) |
| Texas: | 5.8% (401,071) |
10:00 a.m. to 10:59 a.m. - Males:
| Fort Worth: | 2.6% (5,715) |
| Texas: | 2.7% (186,469) |
11:00 a.m. to 11:59 a.m. - Males:
| Fort Worth: | 1.0% (2,195) |
| Texas: | 1.2% (82,242) |
12:00 p.m. to 3:59 p.m. - Males:
| Fort Worth: | 8.7% (19,174) |
| Texas: | 5.8% (397,795) |
4:00 p.m. to 11:59 p.m. - Males:
| Fort Worth: | 6.8% (15,057) |
| Texas: | 6.4% (435,950) |

12:00 a.m. to 4:59 a.m. - Females:
| Fort Worth: | 3.0% (5,345) |
| Texas: | 3.7% (200,980) |
5:00 a.m. to 5:29 a.m. - Females:
| Fort Worth: | 3.6% (6,487) |
| Texas: | 2.4% (130,965) |
5:30 a.m. to 5:59 a.m. - Females:
| Fort Worth: | 4.1% (7,339) |
| Texas: | 3.7% (201,165) |
6:00 a.m. to 6:29 a.m. - Females:
| Fort Worth: | 7.9% (14,216) |
| Texas: | 7.4% (403,902) |
6:30 a.m. to 6:59 a.m. - Females:
| Fort Worth: | 7.4% (13,333) |
| Texas: | 9.1% (500,516) |
7:00 a.m. to 7:29 a.m. - Females:
| Fort Worth: | 16.4% (29,553) |
| Texas: | 16.7% (914,879) |
7:30 a.m. to 7:59 a.m. - Females:
| Fort Worth: | 11.7% (21,066) |
| Texas: | 14.1% (773,199) |
8:00 a.m. to 8:29 a.m. - Females:
| Fort Worth: | 14.1% (25,439) |
| Texas: | 12.2% (671,134) |
8:30 a.m. to 8:59 a.m. - Females:
| Fort Worth: | 6.0% (10,782) |
| Texas: | 5.8% (317,812) |
9:00 a.m. to 9:59 a.m. - Females:
| Fort Worth: | 7.0% (12,570) |
| Texas: | 7.8% (428,296) |
10:00 a.m. to 10:59 a.m. - Females:
| Fort Worth: | 3.5% (6,282) |
| Texas: | 3.7% (203,885) |
11:00 a.m. to 11:59 a.m. - Females:
| Fort Worth: | 1.2% (2,184) |
| Texas: | 1.5% (80,088) |
12:00 p.m. to 3:59 p.m. - Females:
| Fort Worth: | 6.6% (11,845) |
| Texas: | 5.9% (322,799) |
4:00 p.m. to 11:59 p.m. - Females:
| Fort Worth: | 7.6% (13,706) |
| Texas: | 6.2% (341,122) |
Travel time to work
Percentage of workers working in this county: 84.8%
Number of people working at home: 72,190 (15.3% of all workers)
Daytime population change due to commuting: +74,826 (+14.0%)
Workers who live and work in this city: 144,032 (61.1%)
Number of people working at home: 72,190 (15.3% of all workers)
Daytime population change due to commuting: +74,826 (+14.0%)
Workers who live and work in this city: 144,032 (61.1%)


Less than 5 minutes:
| Fort Worth: | 1.3% (6,166) |
| Texas: | 2.8% (350,462) |
5 to 9 minutes:
| Fort Worth: | 5.3% (24,824) |
| Texas: | 8.8% (1,087,762) |
10 to 14 minutes:
| Fort Worth: | 11.1% (51,934) |
| Texas: | 12.6% (1,550,271) |
15 to 19 minutes:
| Fort Worth: | 13.4% (62,561) |
| Texas: | 15.6% (1,918,353) |
20 to 24 minutes:
| Fort Worth: | 16.6% (77,231) |
| Texas: | 14.4% (1,772,079) |
25 to 29 minutes:
| Fort Worth: | 8.6% (40,339) |
| Texas: | 6.7% (827,833) |
30 to 34 minutes:
| Fort Worth: | 17.9% (83,371) |
| Texas: | 15.3% (1,887,878) |
35 to 39 minutes:
| Fort Worth: | 4.1% (19,287) |
| Texas: | 3.2% (394,170) |
40 to 44 minutes:
| Fort Worth: | 4.3% (19,978) |
| Texas: | 3.9% (476,118) |
45 to 59 minutes:
| Fort Worth: | 9.6% (44,723) |
| Texas: | 8.6% (1,058,376) |
60 to 89 minutes:
| Fort Worth: | 5.7% (26,559) |
| Texas: | 5.7% (706,002) |
90 or more minutes:
| Fort Worth: | 2.0% (9,468) |
| Texas: | 2.4% (299,884) |


Less than 5 minutes:
| Fort Worth: | 1.8% (4,351) |
| Texas: | 3.0% (277,642) |
5 to 9 minutes:
| Fort Worth: | 8.0% (18,860) |
| Texas: | 10.3% (942,891) |
10 to 14 minutes:
| Fort Worth: | 14.3% (33,683) |
| Texas: | 14.4% (1,317,555) |
15 to 19 minutes:
| Fort Worth: | 18.5% (43,703) |
| Texas: | 16.0% (1,467,945) |
20 to 24 minutes:
| Fort Worth: | 17.1% (40,312) |
| Texas: | 13.9% (1,276,781) |
25 to 29 minutes:
| Fort Worth: | 6.2% (14,569) |
| Texas: | 5.3% (482,838) |
30 to 34 minutes:
| Fort Worth: | 14.9% (35,186) |
| Texas: | 14.3% (1,309,699) |
35 to 39 minutes:
| Fort Worth: | 2.1% (5,000) |
| Texas: | 2.4% (219,873) |
40 to 44 minutes:
| Fort Worth: | 2.5% (5,860) |
| Texas: | 3.1% (280,916) |
45 to 59 minutes:
| Fort Worth: | 6.4% (15,002) |
| Texas: | 7.6% (692,006) |
60 to 89 minutes:
| Fort Worth: | 4.3% (10,072) |
| Texas: | 4.6% (418,905) |
90 or more minutes:
| Fort Worth: | 1.8% (4,302) |
| Texas: | 2.4% (218,800) |

Less than 5 minutes - Males:
| Fort Worth: | 1.1% (2,901) |
| Texas: | 2.7% (181,937) |
5 to 9 minutes - Males:
| Fort Worth: | 4.3% (11,093) |
| Texas: | 7.6% (522,166) |
10 to 14 minutes - Males:
| Fort Worth: | 10.1% (25,784) |
| Texas: | 11.5% (785,572) |
15 to 19 minutes - Males:
| Fort Worth: | 12.0% (30,659) |
| Texas: | 14.6% (1,001,179) |
20 to 24 minutes - Males:
| Fort Worth: | 16.8% (42,856) |
| Texas: | 13.9% (950,043) |
25 to 29 minutes - Males:
| Fort Worth: | 8.6% (21,922) |
| Texas: | 6.7% (457,259) |
30 to 34 minutes - Males:
| Fort Worth: | 17.7% (45,180) |
| Texas: | 16.2% (1,110,357) |
35 to 39 minutes - Males:
| Fort Worth: | 4.0% (10,268) |
| Texas: | 3.3% (223,512) |
40 to 44 minutes - Males:
| Fort Worth: | 4.6% (11,815) |
| Texas: | 4.2% (289,434) |
45 to 59 minutes - Males:
| Fort Worth: | 10.6% (26,950) |
| Texas: | 9.3% (639,122) |
60 to 89 minutes - Males:
| Fort Worth: | 7.4% (18,761) |
| Texas: | 6.8% (467,154) |
90 or more minutes - Males:
| Fort Worth: | 2.7% (6,886) |
| Texas: | 3.1% (211,313) |

Less than 5 minutes - Females:
| Fort Worth: | 1.5% (3,265) |
| Texas: | 3.1% (168,525) |
5 to 9 minutes - Females:
| Fort Worth: | 6.5% (13,731) |
| Texas: | 10.3% (565,596) |
10 to 14 minutes - Females:
| Fort Worth: | 12.4% (26,150) |
| Texas: | 13.9% (764,699) |
15 to 19 minutes - Females:
| Fort Worth: | 15.1% (31,902) |
| Texas: | 16.7% (917,174) |
20 to 24 minutes - Females:
| Fort Worth: | 16.3% (34,375) |
| Texas: | 15.0% (822,036) |
25 to 29 minutes - Females:
| Fort Worth: | 8.7% (18,417) |
| Texas: | 6.7% (370,574) |
30 to 34 minutes - Females:
| Fort Worth: | 18.1% (38,191) |
| Texas: | 14.2% (777,521) |
35 to 39 minutes - Females:
| Fort Worth: | 4.3% (9,019) |
| Texas: | 3.1% (170,658) |
40 to 44 minutes - Females:
| Fort Worth: | 3.9% (8,163) |
| Texas: | 3.4% (186,684) |
45 to 59 minutes - Females:
| Fort Worth: | 8.4% (17,773) |
| Texas: | 7.6% (419,254) |
60 to 89 minutes - Females:
| Fort Worth: | 3.7% (7,798) |
| Texas: | 4.4% (238,848) |
90 or more minutes - Females:
| Fort Worth: | 1.2% (2,582) |
| Texas: | 1.6% (88,571) |
Means of transportation to work


Drove car alone:
| Fort Worth: | 85.8% (400,103) |
| Texas: | 83.3% (4,557,023) |
Carpooled:
| Fort Worth: | 11.1% (51,968) |
| Texas: | 11.7% (674,818) |
Bus:
| Fort Worth: | 0.3% (1,544) |
| Texas: | 0.9% (50,435) |
Long-distance train or commuter rail:
| Fort Worth: | 0.1% (440) |
| Texas: | 0.0% (551) |
Light rail, streetcar or trolley:
| Fort Worth: | 0.0% (62) |
| Texas: | 0.1% (2,519) |
Ferryboat:
| Fort Worth: | 0.0% (48) |
| Texas: | 0.0% (456) |
Bicycle:
| Fort Worth: | 0.1% (522) |
| Texas: | 0.2% (7,954) |
Walked:
| Fort Worth: | 1.2% (5,413) |
| Texas: | 1.7% (99,911) |
Other means:
| Fort Worth: | 1.4% (6,341) |
| Texas: | 2.0% (95,481) |


Drove car alone:
| Fort Worth: | 77.0% (181,653) |
| Texas: | 77.7% (7,115,590) |
Carpooled:
| Fort Worth: | 16.7% (39,269) |
| Texas: | 14.5% (1,326,012) |
Bus or trolley bus:
| Fort Worth: | 1.3% (3,158) |
| Texas: | 1.7% (157,014) |
Streetcar or trolley car:
| Fort Worth: | 0.0% (26) |
| Texas: | 0.0% (1,669) |
Subway or elevated:
| Fort Worth: | 0.0% (22) |
| Texas: | 0.0% (2,371) |
Railroad:
| Fort Worth: | 0.0% (29) |
| Texas: | 0.0% (2,374) |
Ferryboat:
| Fort Worth: | 0.0% (4) |
| Texas: | 0.0% (738) |
Taxicab:
| Fort Worth: | 0.1% (200) |
| Texas: | 0.1% (6,102) |
Motorcycle:
| Fort Worth: | 0.1% (249) |
| Texas: | 0.1% (12,068) |
Bicycle:
| Fort Worth: | 0.1% (303) |
| Texas: | 0.2% (21,551) |
Walked:
| Fort Worth: | 1.7% (4,036) |
| Texas: | 1.9% (173,670) |
Other means:
| Fort Worth: | 0.8% (1,951) |
| Texas: | 0.9% (86,692) |


Drove car alone - Males:
| Fort Worth: | 85.8% (218,777) |
| Texas: | 83.6% (4,557,023) |
Carpooled - Males:
| Fort Worth: | 11.0% (28,147) |
| Texas: | 11.2% (674,818) |
Bus - Males:
| Fort Worth: | 0.3% (878) |
| Texas: | 0.8% (50,435) |
Long-distance train or commuter rail - Males:
| Fort Worth: | 0.2% (440) |
| Texas: | 0.0% (551) |
Light rail, streetcar or trolley - Males:
| Fort Worth: | 0.0% (62) |
| Texas: | 0.1% (2,519) |
Bicycle - Males:
| Fort Worth: | 0.1% (348) |
| Texas: | 0.3% (7,954) |
Walked - Males:
| Fort Worth: | 1.0% (2,595) |
| Texas: | 1.7% (99,911) |
Other means - Males:
| Fort Worth: | 1.5% (3,828) |
| Texas: | 2.2% (95,481) |


Drove car alone - Females:
| Fort Worth: | 85.8% (181,326) |
| Texas: | 83.0% (4,557,023) |
Carpooled - Females:
| Fort Worth: | 11.3% (23,821) |
| Texas: | 12.3% (674,818) |
Bus - Females:
| Fort Worth: | 0.3% (666) |
| Texas: | 0.9% (50,435) |
Ferryboat - Females:
| Fort Worth: | 0.0% (48) |
| Texas: | 0.0% (456) |
Bicycle - Females:
| Fort Worth: | 0.1% (174) |
| Texas: | 0.1% (7,954) |
Walked - Females:
| Fort Worth: | 1.3% (2,818) |
| Texas: | 1.8% (99,911) |
Other means - Females:
| Fort Worth: | 1.2% (2,513) |
| Texas: | 1.7% (95,481) |
Private vehicle occupancy

Drove alone:
| Fort Worth: | 87.8% (339,792) |
| Texas: | 87.6% (10,283,021) |
In 2 person carpool:
| Fort Worth: | 9.2% (35,504) |
| Texas: | 9.0% (1,052,595) |
In 3 person carpool:
| Fort Worth: | 2.3% (8,847) |
| Texas: | 2.1% (244,139) |
In 4 person carpool:
| Fort Worth: | 0.4% (1,625) |
| Texas: | 0.8% (92,732) |
In 5-6 person carpool:
| Fort Worth: | 0.3% (1,111) |
| Texas: | 0.4% (44,947) |
In 7+ person carpool:
| Fort Worth: | 0.1% (340) |
| Texas: | 0.1% (16,725) |

Drove alone:
| Fort Worth: | 82.2% (181,653) |
| Texas: | 84.3% (7,115,590) |
In 2 person carpool:
| Fort Worth: | 12.2% (27,037) |
| Texas: | 11.6% (982,994) |
In 3 person carpool:
| Fort Worth: | 3.0% (6,521) |
| Texas: | 2.4% (201,602) |
In 4 person carpool:
| Fort Worth: | 1.5% (3,303) |
| Texas: | 1.0% (83,518) |
In 5-6 person carpool:
| Fort Worth: | 0.8% (1,847) |
| Texas: | 0.5% (40,662) |
In 7+ person carpool:
| Fort Worth: | 0.3% (561) |
| Texas: | 0.2% (17,236) |
Class of workers
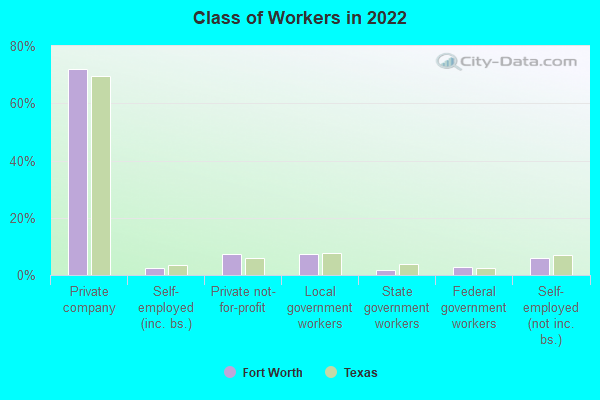
Employee of private company:
| Fort Worth: | 71.9% (343,476) |
| Texas: | 69.6% (10,139,666) |
Self-employed in own incorporated business:
| Fort Worth: | 2.6% (12,461) |
| Texas: | 3.5% (516,446) |
Private not-for-profit wage and salary workers:
| Fort Worth: | 7.3% (34,749) |
| Texas: | 6.0% (870,454) |
Local government workers:
| Fort Worth: | 7.4% (35,192) |
| Texas: | 7.6% (1,109,799) |
State government workers:
| Fort Worth: | 1.9% (8,974) |
| Texas: | 3.8% (558,618) |
Federal government workers:
| Fort Worth: | 2.9% (13,649) |
| Texas: | 2.5% (357,298) |
Self-employed workers in own not incorporated business:
| Fort Worth: | 6.0% (28,446) |
| Texas: | 6.8% (998,270) |
Unpaid family workers:
| Fort Worth: | 0.2% (1,066) |
| Texas: | 0.2% (27,882) |

Employee of private company:
| Fort Worth: | 74.6% (179,140) |
| Texas: | 69.6% (6,425,274) |
Self-employed in own incorporated business:
| Fort Worth: | 2.0% (4,898) |
| Texas: | 2.7% (250,864) |
Private not-for-profit wage and salary workers:
| Fort Worth: | 6.6% (15,950) |
| Texas: | 5.7% (526,631) |
Local government workers:
| Fort Worth: | 6.0% (14,526) |
| Texas: | 6.6% (608,479) |
State government workers:
| Fort Worth: | 2.6% (6,180) |
| Texas: | 5.4% (501,082) |
Federal government workers:
| Fort Worth: | 2.5% (6,084) |
| Texas: | 2.6% (237,177) |
Self-employed workers in own not incorporated business:
| Fort Worth: | 5.4% (12,920) |
| Texas: | 7.1% (653,527) |
Unpaid family workers:
| Fort Worth: | 0.2% (421) |
| Texas: | 0.3% (31,338) |

Employee of private company - Males:
| Fort Worth: | 74.7% (191,903) |
| Texas: | 73.1% (5,788,450) |
Self-employed in own incorporated business - Males:
| Fort Worth: | 3.0% (7,743) |
| Texas: | 4.2% (332,655) |
Private not-for-profit wage and salary workers - Males:
| Fort Worth: | 5.1% (13,189) |
| Texas: | 4.1% (323,476) |
Local government workers - Males:
| Fort Worth: | 5.2% (13,486) |
| Texas: | 5.1% (405,467) |
State government workers - Males:
| Fort Worth: | 1.3% (3,386) |
| Texas: | 3.0% (236,706) |
Federal government workers - Males:
| Fort Worth: | 3.5% (8,897) |
| Texas: | 2.7% (211,629) |
Self-employed workers in own not incorporated business - Males:
| Fort Worth: | 7.0% (17,876) |
| Texas: | 7.7% (609,246) |
Unpaid family workers - Males:
| Fort Worth: | 0.2% (513) |
| Texas: | 0.2% (12,606) |

Employee of private company - Females:
| Fort Worth: | 68.6% (151,573) |
| Texas: | 65.4% (4,351,216) |
Self-employed in own incorporated business - Females:
| Fort Worth: | 2.1% (4,718) |
| Texas: | 2.8% (183,791) |
Private not-for-profit wage and salary workers - Females:
| Fort Worth: | 9.8% (21,560) |
| Texas: | 8.2% (546,978) |
Local government workers - Females:
| Fort Worth: | 9.8% (21,706) |
| Texas: | 10.6% (704,332) |
State government workers - Females:
| Fort Worth: | 2.5% (5,588) |
| Texas: | 4.8% (321,912) |
Federal government workers - Females:
| Fort Worth: | 2.2% (4,752) |
| Texas: | 2.2% (145,669) |
Self-employed workers in own not incorporated business - Females:
| Fort Worth: | 4.8% (10,570) |
| Texas: | 5.8% (389,024) |
Unpaid family workers - Females:
| Fort Worth: | 0.3% (553) |
| Texas: | 0.2% (15,276) |