Work and Jobs in Gates, New York (NY) Detailed Stats
Occupations, Industries, Unemployment, Workers, Commute
Settings
X


Recent posts about work in Gates, New York on our local forum with over 2,400,000 registered users:
 | Segregation, and Racism in Albany? (11 replies) |
| Living in Troy (48 replies) |
Latest news about work in Gates, NY collected exclusively by city-data.com from local newspapers, TV, and radio stations
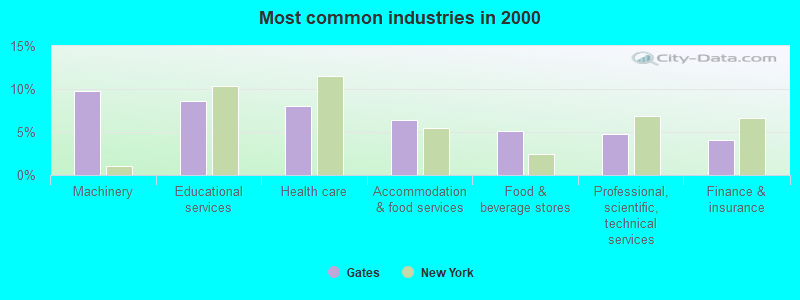
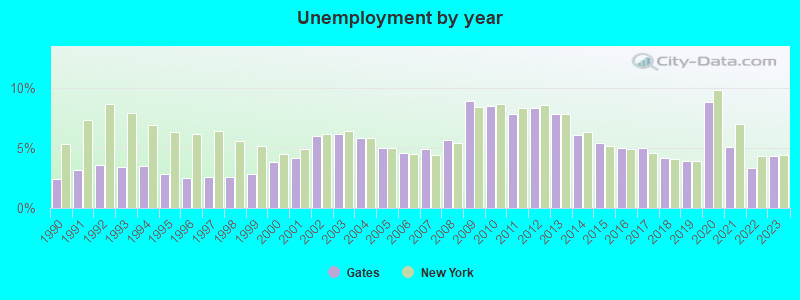
The unemployment rate in 2023 in Gates, NY was 4.3%, which was 2.3% less than the unemployment rate of 4.4% across the entire state of New York. Compared to the unemployment rate of 7.8% in 2013, this represents a decrease of 81.4%. The most common industries in Gates are: Machinery (9.8% of civilian employees), Educational services (8.6% of civilian employees), Health care (8.0% of civilian employees). 76.3% of workers are employees of private companies, which is 16.5% greater than the rate of 63.7% across the entire state of New York.
Most common industries
Most common industries | |||
|---|---|---|---|
Industry | All | Males | Females |
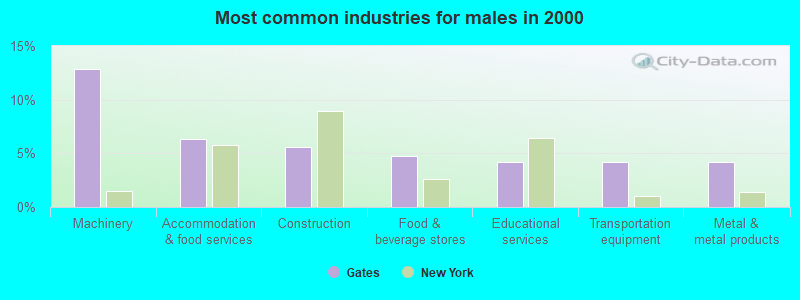
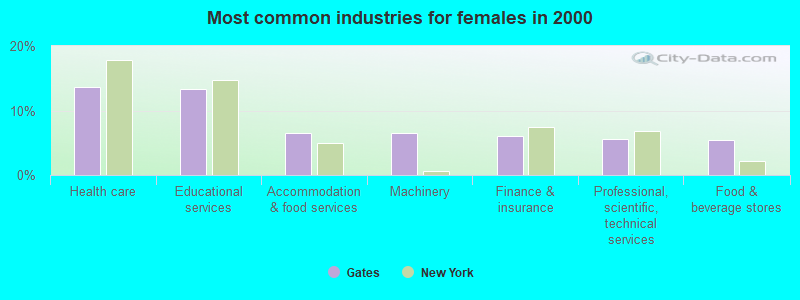
| Machinery | 9.8% (1,374) | 12.8% (926) | 6.5% (448) |
| Educational services | 8.6% (1,218) | 4.2% (304) | 13.3% (914) |
| Health care | 8.0% (1,132) | 2.7% (197) | 13.6% (935) |
| Accommodation and food services | 6.4% (907) | 6.3% (456) | 6.6% (451) |
| Food and beverage stores | 5.1% (720) | 4.8% (344) | 5.5% (376) |
| Professional, scientific, and technical services | 4.7% (664) | 3.9% (283) | 5.5% (381) |
| Finance and insurance | 4.0% (565) | 2.1% (149) | 6.1% (416) |
| Construction | 3.5% (492) | 5.6% (406) | 1.3% (86) |
| Administrative and support and waste management services | 3.3% (459) | 3.7% (270) | 2.8% (189) |
| Transportation equipment | 3.2% (447) | 4.2% (304) | 2.1% (143) |
| Metal and metal products | 2.7% (384) | 4.2% (300) | 1.2% (84) |
| Public administration | 2.7% (381) | 3.0% (219) | 2.4% (162) |
| Miscellaneous manufacturing | 2.6% (368) | 2.2% (156) | 3.1% (212) |
| Chemicals | 2.2% (303) | 2.4% (173) | 1.9% (130) |
| Broadcasting and telecommunications | 2.1% (299) | 2.5% (184) | 1.7% (115) |
| Personal and laundry services | 1.7% (246) | 1.2% (88) | 2.3% (158) |
| Social assistance | 1.7% (235) | 0.7% (49) | 2.7% (186) |
| Real estate and rental and leasing | 1.6% (228) | 1.9% (136) | 1.3% (92) |
| Printing and related support activities | 1.6% (224) | 2.4% (174) | 0.7% (50) |
| Department and other general merchandise stores | 1.5% (210) | 0.7% (50) | 2.3% (160) |
| Computer and electronic products | 1.4% (193) | 1.4% (103) | 1.3% (90) |
| Other transportation, and support activities, and couriers | 1.3% (186) | 1.6% (112) | 1.1% (74) |
| Religious, grantmaking, civic, professional, and similar organizations | 1.3% (184) | 1.0% (72) | 1.6% (112) |
| Repair and maintenance | 1.2% (167) | 1.9% (139) | 0.4% (28) |
| Building material and garden equipment and supplies dealers | 1.2% (163) | 1.2% (85) | 1.1% (78) |
| Arts, entertainment, and recreation | 1.1% (148) | 1.4% (101) | 0.7% (47) |
| Motor vehicle and parts dealers | 1.0% (138) | 1.6% (117) | 0.3% (21) |
| Plastics and rubber products | 0.9% (128) | 1.1% (79) | 0.7% (49) |
| U. S. Postal service | 0.9% (124) | 1.1% (78) | 0.7% (46) |
| Utilities | 0.9% (123) | 1.1% (77) | 0.7% (46) |
| Publishing, and motion picture and sound recording industries | 0.8% (115) | 1.0% (70) | 0.7% (45) |
| Paper | 0.8% (106) | 0.9% (68) | 0.6% (38) |
| Truck transportation | 0.6% (86) | 1.1% (82) | 0.1% (4) |
| Radio, TV, and computer stores | 0.5% (73) | 1.0% (73) | 0.0% (0) |
| Used merchandise, gift, novelty, and souvenir, and other miscellaneous stores | 0.5% (73) | 0.6% (46) | 0.4% (27) |
| Beverage and tobacco products | 0.5% (72) | 0.8% (59) | 0.2% (13) |
| Food | 0.5% (71) | 1.0% (71) | 0.0% (0) |
| Professional and commercial equipment and supplies merchant wholesalers | 0.5% (64) | 0.4% (31) | 0.5% (33) |
| Other direct selling establishments | 0.4% (55) | 0.1% (7) | 0.7% (48) |
| Groceries and related products merchant wholesalers | 0.4% (53) | 0.7% (53) | 0.0% (0) |
| Electrical and electronic goods merchant wholesalers | 0.4% (53) | 0.5% (33) | 0.3% (20) |
| Pharmacies and drug stores | 0.4% (52) | 0.6% (46) | 0.1% (6) |
| Gasoline stations | 0.4% (51) | 0.5% (34) | 0.2% (17) |
| Apparel | 0.3% (49) | 0.2% (16) | 0.5% (33) |
| Data processing, libraries, and other information services | 0.3% (46) | 0.4% (29) | 0.2% (17) |
| Warehousing and storage | 0.3% (45) | 0.3% (23) | 0.3% (22) |
| Metals and minerals, except petroleum, merchant wholesalers | 0.3% (45) | 0.3% (22) | 0.3% (23) |
| Furniture and home furnishings, and household appliance stores | 0.3% (44) | 0.4% (32) | 0.2% (12) |
| Rail transportation | 0.3% (40) | 0.6% (40) | 0.0% (0) |
| Sporting goods, camera, and hobby and toy stores | 0.3% (37) | 0.4% (29) | 0.1% (8) |
| Air transportation | 0.3% (37) | 0.3% (20) | 0.2% (17) |
| Office supplies and stationery stores | 0.2% (33) | 0.2% (16) | 0.2% (17) |
| Paper and paper products merchant wholesalers | 0.2% (31) | 0.3% (25) | 0.1% (6) |
| Retail florists | 0.2% (30) | 0.0% (0) | 0.4% (30) |
| Clothing and accessories, including shoe, stores | 0.2% (29) | 0.1% (7) | 0.3% (22) |
| Vending machine operators | 0.2% (29) | 0.1% (10) | 0.3% (19) |
| Health and personal care, except drug, stores | 0.2% (25) | 0.0% (0) | 0.4% (25) |
| Alcoholic beverages merchant wholesalers | 0.1% (21) | 0.1% (8) | 0.2% (13) |
| Miscellaneous nondurable goods merchant wholesalers | 0.1% (21) | 0.3% (21) | 0.0% (0) |
| Machinery, equipment, and supplies merchant wholesalers | 0.1% (20) | 0.2% (13) | 0.1% (7) |
| Miscellaneous durable goods merchant wholesalers | 0.1% (20) | 0.1% (7) | 0.2% (13) |
| Nonmetallic mineral products | 0.1% (19) | 0.0% (0) | 0.3% (19) |
| Lumber and other construction materials merchant wholesalers | 0.1% (17) | 0.1% (8) | 0.1% (9) |
| Hardware, plumbing and heating equipment, and supplies merchant wholesalers | 0.1% (14) | 0.2% (14) | 0.0% (0) |
| Motor vehicles, parts and supplies merchant wholesalers | 0.1% (11) | 0.2% (11) | 0.0% (0) |
| Music stores | 0.1% (10) | 0.1% (10) | 0.0% (0) |
| Textile mills and textile products | 0.1% (10) | 0.1% (10) | 0.0% (0) |
| Wood products | 0.1% (8) | 0.1% (8) | 0.0% (0) |
| Mining, quarrying, and oil and gas extraction | 0.1% (8) | 0.1% (8) | 0.0% (0) |
Unemployment in Gates
- Unemployment by race in 2000
- Unemployment rate for White non-Hispanic residents
- 4.1%Males
- 3.5%Females
- Unemployment rate for Black residents
- 13.5%Males
- 5.5%Females
- Unemployment rate for Asian residents
- 4.2%Females
- Unemployment rate for other race residents
- 21.2%Females
- Unemployment rate for Hispanic or Latino residents
- 3.0%Males
- 3.9%Females
Unemployment in 2023:
| Gates: | 4.3% |
| New York: | 4.4% |
Unemployment in 2022:
| Gates: | 3.3% |
| New York: | 4.3% |
Unemployment in 2021:
| Gates: | 5.1% |
| New York: | 7.0% |
Unemployment in 2020:
| Gates: | 8.8% |
| New York: | 9.8% |
Unemployment in 2019:
| Gates: | 3.9% |
| New York: | 3.9% |
Unemployment in 2018:
| Gates: | 4.2% |
| New York: | 4.1% |
Unemployment in 2017:
| Gates: | 5.0% |
| New York: | 4.6% |
Unemployment in 2016:
| Gates: | 5.0% |
| New York: | 4.9% |
Unemployment in 2015:
| Gates: | 5.4% |
| New York: | 5.2% |
Unemployment in 2014:
| Gates: | 6.1% |
| New York: | 6.3% |
Unemployment in 2013:
| Gates: | 7.8% |
| New York: | 7.8% |
Unemployment in 2012:
| Gates: | 8.3% |
| New York: | 8.6% |
Unemployment in 2011:
| Gates: | 7.8% |
| New York: | 8.3% |
Unemployment in 2010:
| Gates: | 8.5% |
| New York: | 8.7% |
Unemployment in 2009:
| Gates: | 8.9% |
| New York: | 8.4% |
Unemployment in 2008:
| Gates: | 5.7% |
| New York: | 5.4% |
Unemployment in 2007:
| Gates: | 4.9% |
| New York: | 4.4% |
Unemployment in 2006:
| Gates: | 4.6% |
| New York: | 4.5% |
Unemployment in 2005:
| Gates: | 5.0% |
| New York: | 5.0% |
Unemployment in 2004:
| Gates: | 5.8% |
| New York: | 5.8% |
Unemployment in 2003:
| Gates: | 6.2% |
| New York: | 6.4% |
Unemployment in 2002:
| Gates: | 6.0% |
| New York: | 6.2% |
Unemployment in 2001:
| Gates: | 4.2% |
| New York: | 4.9% |
Unemployment in 2000:
| Gates: | 3.8% |
| New York: | 4.5% |
Unemployment in 1999:
| Gates: | 2.8% |
| New York: | 5.2% |
Unemployment in 1998:
| Gates: | 2.6% |
| New York: | 5.6% |
Unemployment in 1997:
| Gates: | 2.6% |
| New York: | 6.4% |
Unemployment in 1996:
| Gates: | 2.5% |
| New York: | 6.2% |
Unemployment in 1995:
| Gates: | 2.8% |
| New York: | 6.3% |
Unemployment in 1994:
| Gates: | 3.5% |
| New York: | 6.9% |
Unemployment in 1993:
| Gates: | 3.4% |
| New York: | 7.9% |
Unemployment in 1992:
| Gates: | 3.6% |
| New York: | 8.7% |
Unemployment in 1991:
| Gates: | 3.2% |
| New York: | 7.3% |
Unemployment in 1990:
| Gates: | 2.4% |
| New York: | 5.3% |
Time leaving home to go to work

<5am:
| Gates: | 3.2% (447) |
| New York: | 2.4% (194,562) |
5:30am:
| Gates: | 2.3% (318) |
| New York: | 2.1% (174,328) |
6am:
| Gates: | 4.6% (646) |
| New York: | 3.1% (253,826) |
6:30am:
| Gates: | 8.5% (1,189) |
| New York: | 7.0% (573,349) |
7am:
| Gates: | 9.9% (1,375) |
| New York: | 8.6% (706,982) |
7:30am:
| Gates: | 14.4% (2,007) |
| New York: | 14.0% (1,147,579) |
8am:
| Gates: | 16.7% (2,328) |
| New York: | 14.8% (1,213,706) |
8:30am:
| Gates: | 10.0% (1,389) |
| New York: | 13.9% (1,144,298) |
9am:
| Gates: | 5.0% (701) |
| New York: | 7.5% (614,475) |
10am:
| Gates: | 4.7% (653) |
| New York: | 7.2% (593,377) |
11am:
| Gates: | 2.6% (356) |
| New York: | 2.7% (224,011) |
12pm:
| Gates: | 0.9% (130) |
| New York: | 1.3% (105,049) |
4pm:
| Gates: | 8.3% (1,153) |
| New York: | 6.3% (517,309) |
>4pm:
| Gates: | 7.1% (993) |
| New York: | 6.1% (501,196) |
Travel time to work


Less than 5 minutes:
| Gates: | 2.8% (389) |
| New York: | 2.7% (219,036) |
5 to 9 minutes:
| Gates: | 12.3% (1,716) |
| New York: | 8.3% (680,270) |
10 to 14 minutes:
| Gates: | 25.5% (3,553) |
| New York: | 11.6% (956,590) |
15 to 19 minutes:
| Gates: | 24.1% (3,352) |
| New York: | 12.4% (1,020,084) |
20 to 24 minutes:
| Gates: | 17.7% (2,457) |
| New York: | 12.3% (1,013,757) |
25 to 29 minutes:
| Gates: | 4.8% (668) |
| New York: | 4.9% (399,384) |
30 to 34 minutes:
| Gates: | 5.5% (764) |
| New York: | 12.9% (1,058,688) |
35 to 39 minutes:
| Gates: | 0.4% (60) |
| New York: | 2.5% (203,722) |
40 to 44 minutes:
| Gates: | 0.6% (89) |
| New York: | 4.1% (340,311) |
45 to 59 minutes:
| Gates: | 1.4% (190) |
| New York: | 9.8% (806,556) |
60 to 89 minutes:
| Gates: | 1.8% (256) |
| New York: | 10.3% (848,185) |
90 or more minutes:
| Gates: | 1.4% (191) |
| New York: | 5.1% (417,464) |
Means of transportation to work


Drove car alone:
| Gates: | 89.0% (12,378) |
| New York: | 56.3% (4,620,178) |
Carpooled:
| Gates: | 7.0% (971) |
| New York: | 9.2% (756,918) |
Bus or trolley bus:
| Gates: | 0.7% (91) |
| New York: | 5.8% (475,389) |
Streetcar or trolley car:
| Gates: | 0.0% (6) |
| New York: | 0.1% (6,058) |
Railroad:
| Gates: | 0.1% (9) |
| New York: | 2.8% (228,215) |
Taxicab:
| Gates: | 0.1% (8) |
| New York: | 0.8% (67,897) |
Walked:
| Gates: | 0.9% (127) |
| New York: | 6.2% (511,721) |
Other means:
| Gates: | 0.7% (95) |
| New York: | 0.5% (40,375) |
Private vehicle occupancy

Drove alone:
| Gates: | 92.7% (12,378) |
| New York: | 85.9% (4,620,178) |
In 2 person carpool:
| Gates: | 6.7% (891) |
| New York: | 11.0% (590,255) |
In 3 person carpool:
| Gates: | 0.4% (52) |
| New York: | 1.8% (96,470) |
In 5-6 person carpool:
| Gates: | 0.1% (15) |
| New York: | 0.3% (16,644) |
In 7+ person carpool:
| Gates: | 0.1% (13) |
| New York: | 0.3% (17,437) |
Class of workers
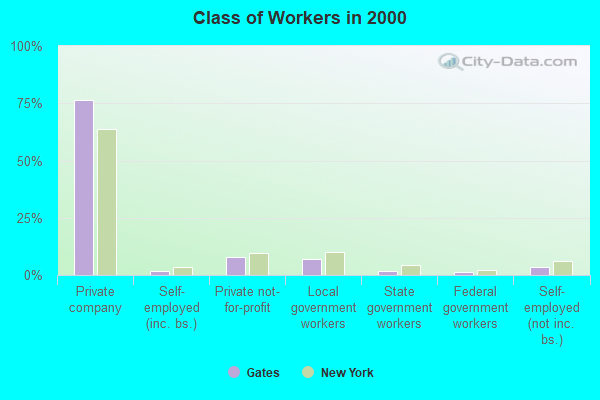
Employee of private company:
| Gates: | 76.3% (10,743) |
| New York: | 63.7% (5,340,134) |
Self-employed in own incorporated business:
| Gates: | 1.8% (252) |
| New York: | 3.4% (283,619) |
Private not-for-profit wage and salary workers:
| Gates: | 8.0% (1,129) |
| New York: | 9.7% (810,356) |
Local government workers:
| Gates: | 7.0% (983) |
| New York: | 10.2% (858,120) |
State government workers:
| Gates: | 1.9% (265) |
| New York: | 4.6% (383,673) |
Federal government workers:
| Gates: | 1.3% (178) |
| New York: | 2.2% (185,100) |
Self-employed workers in own not incorporated business:
| Gates: | 3.7% (519) |
| New York: | 6.0% (501,068) |
Unpaid family workers:
| Gates: | 0.1% (15) |
| New York: | 0.2% (20,918) |

Employee of private company - Males:
| Gates: | 80.3% (5,793) |
| New York: | 66.2% (2,902,064) |
Self-employed in own incorporated business - Males:
| Gates: | 2.8% (202) |
| New York: | 4.9% (215,651) |
Private not-for-profit wage and salary workers - Males:
| Gates: | 3.9% (285) |
| New York: | 6.3% (277,787) |
Local government workers - Males:
| Gates: | 6.2% (447) |
| New York: | 8.7% (380,426) |
State government workers - Males:
| Gates: | 1.0% (69) |
| New York: | 4.1% (181,784) |
Federal government workers - Males:
| Gates: | 1.5% (108) |
| New York: | 2.3% (102,647) |
Self-employed workers in own not incorporated business - Males:
| Gates: | 4.3% (313) |
| New York: | 7.1% (312,497) |

Employee of private company - Females:
| Gates: | 72.1% (4,950) |
| New York: | 60.9% (2,438,070) |
Self-employed in own incorporated business - Females:
| Gates: | 0.7% (50) |
| New York: | 1.7% (67,968) |
Private not-for-profit wage and salary workers - Females:
| Gates: | 12.3% (844) |
| New York: | 13.3% (532,569) |
Local government workers - Females:
| Gates: | 7.8% (536) |
| New York: | 11.9% (477,694) |
State government workers - Females:
| Gates: | 2.9% (196) |
| New York: | 5.0% (201,889) |
Federal government workers - Females:
| Gates: | 1.0% (70) |
| New York: | 2.1% (82,453) |
Self-employed workers in own not incorporated business - Females:
| Gates: | 3.0% (206) |
| New York: | 4.7% (188,571) |
Unpaid family workers - Females:
| Gates: | 0.2% (15) |
| New York: | 0.3% (11,448) |