Work and Jobs in Gates-North Gates, New York (NY) Detailed Stats
Occupations, Industries, Unemployment, Workers, Commute

Discuss Gates-North Gates, New York work on our local forum with over 2,400,000 registered users
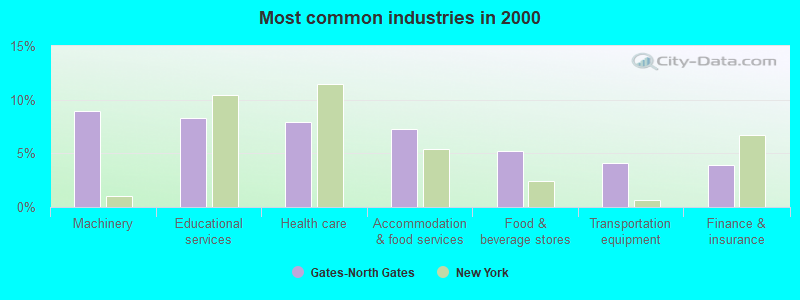
The most common industries in Gates-North Gates are: Machinery (8.9% of civilian employees), Educational services (8.3% of civilian employees), Health care (7.9% of civilian employees). 77.3% of workers are employees of private companies, which is 17.6% greater than the rate of 63.7% across the entire state of New York.
Most common industries
Most common industries | |||
|---|---|---|---|
Industry | All | Males | Females |
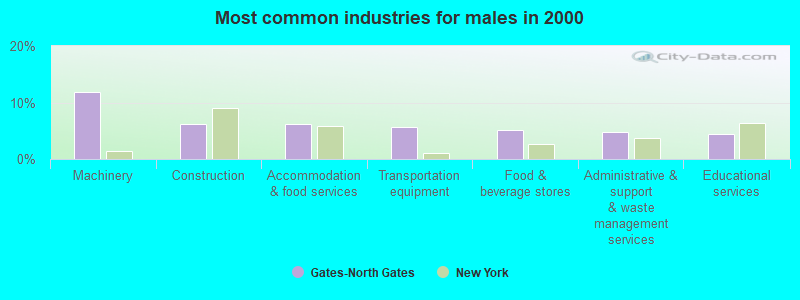
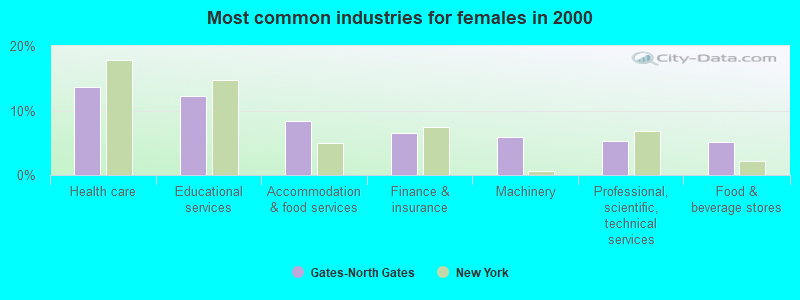
| Machinery | 8.9% (650) | 11.9% (439) | 5.9% (211) |
| Educational services | 8.3% (603) | 4.4% (163) | 12.3% (440) |
| Health care | 7.9% (577) | 2.4% (88) | 13.6% (489) |
| Accommodation and food services | 7.3% (528) | 6.1% (226) | 8.4% (302) |
| Food and beverage stores | 5.2% (377) | 5.2% (191) | 5.2% (186) |
| Transportation equipment | 4.1% (296) | 5.6% (207) | 2.5% (89) |
| Finance and insurance | 3.9% (286) | 1.4% (51) | 6.6% (235) |
| Professional, scientific, and technical services | 3.9% (281) | 2.4% (90) | 5.3% (191) |
| Administrative and support and waste management services | 3.8% (276) | 4.8% (176) | 2.8% (100) |
| Construction | 3.5% (256) | 6.2% (229) | 0.8% (27) |
| Miscellaneous manufacturing | 2.8% (203) | 1.7% (62) | 3.9% (141) |
| Metal and metal products | 2.5% (181) | 3.9% (143) | 1.1% (38) |
| Broadcasting and telecommunications | 2.5% (181) | 3.2% (117) | 1.8% (64) |
| Public administration | 2.3% (164) | 2.4% (90) | 2.1% (74) |
| Chemicals | 2.2% (159) | 2.7% (98) | 1.7% (61) |
| Personal and laundry services | 1.9% (135) | 1.0% (37) | 2.7% (98) |
| Printing and related support activities | 1.7% (121) | 2.5% (91) | 0.8% (30) |
| Computer and electronic products | 1.6% (116) | 1.6% (59) | 1.6% (57) |
| Department and other general merchandise stores | 1.5% (112) | 0.7% (27) | 2.4% (85) |
| Real estate and rental and leasing | 1.5% (107) | 2.0% (74) | 0.9% (33) |
| Other transportation, and support activities, and couriers | 1.5% (106) | 2.2% (83) | 0.6% (23) |
| Religious, grantmaking, civic, professional, and similar organizations | 1.4% (100) | 1.3% (48) | 1.5% (52) |
| Social assistance | 1.4% (99) | 0.9% (33) | 1.8% (66) |
| Plastics and rubber products | 1.3% (94) | 1.6% (59) | 1.0% (35) |
| Building material and garden equipment and supplies dealers | 1.2% (90) | 1.2% (44) | 1.3% (46) |
| Motor vehicle and parts dealers | 1.2% (86) | 2.2% (80) | 0.2% (6) |
| Arts, entertainment, and recreation | 1.1% (82) | 1.7% (63) | 0.5% (19) |
| Publishing, and motion picture and sound recording industries | 1.0% (76) | 1.2% (43) | 0.9% (33) |
| Truck transportation | 0.9% (63) | 1.6% (59) | 0.1% (4) |
| U. S. Postal service | 0.8% (55) | 0.7% (26) | 0.8% (29) |
| Utilities | 0.8% (55) | 1.1% (42) | 0.4% (13) |
| Gasoline stations | 0.6% (41) | 0.9% (34) | 0.2% (7) |
| Beverage and tobacco products | 0.6% (41) | 0.8% (28) | 0.4% (13) |
| Pharmacies and drug stores | 0.6% (41) | 0.9% (35) | 0.2% (6) |
| Paper | 0.5% (37) | 0.4% (16) | 0.6% (21) |
| Used merchandise, gift, novelty, and souvenir, and other miscellaneous stores | 0.5% (36) | 0.8% (28) | 0.2% (8) |
| Apparel | 0.5% (35) | 0.4% (16) | 0.5% (19) |
| Paper and paper products merchant wholesalers | 0.4% (31) | 0.7% (25) | 0.2% (6) |
| Furniture and home furnishings, and household appliance stores | 0.4% (31) | 0.7% (26) | 0.1% (5) |
| Professional and commercial equipment and supplies merchant wholesalers | 0.4% (30) | 0.3% (10) | 0.6% (20) |
| Repair and maintenance | 0.4% (29) | 0.5% (20) | 0.3% (9) |
| Other direct selling establishments | 0.4% (26) | 0.0% (0) | 0.7% (26) |
| Office supplies and stationery stores | 0.3% (25) | 0.2% (8) | 0.5% (17) |
| Metals and minerals, except petroleum, merchant wholesalers | 0.3% (23) | 0.0% (0) | 0.6% (23) |
| Food | 0.3% (23) | 0.6% (23) | 0.0% (0) |
| Retail florists | 0.3% (23) | 0.0% (0) | 0.6% (23) |
| Clothing and accessories, including shoe, stores | 0.3% (22) | 0.2% (7) | 0.4% (15) |
| Sporting goods, camera, and hobby and toy stores | 0.3% (21) | 0.4% (13) | 0.2% (8) |
| Electrical and electronic goods merchant wholesalers | 0.3% (21) | 0.2% (9) | 0.3% (12) |
| Air transportation | 0.3% (20) | 0.4% (13) | 0.2% (7) |
| Warehousing and storage | 0.3% (20) | 0.2% (6) | 0.4% (14) |
| Radio, TV, and computer stores | 0.3% (19) | 0.5% (19) | 0.0% (0) |
| Groceries and related products merchant wholesalers | 0.3% (19) | 0.5% (19) | 0.0% (0) |
| Nonmetallic mineral products | 0.3% (19) | 0.0% (0) | 0.5% (19) |
| Health and personal care, except drug, stores | 0.2% (17) | 0.0% (0) | 0.5% (17) |
| Data processing, libraries, and other information services | 0.2% (15) | 0.2% (6) | 0.3% (9) |
| Hardware, plumbing and heating equipment, and supplies merchant wholesalers | 0.2% (14) | 0.4% (14) | 0.0% (0) |
| Machinery, equipment, and supplies merchant wholesalers | 0.2% (13) | 0.4% (13) | 0.0% (0) |
| Miscellaneous nondurable goods merchant wholesalers | 0.2% (11) | 0.3% (11) | 0.0% (0) |
| Textile mills and textile products | 0.1% (10) | 0.3% (10) | 0.0% (0) |
| Vending machine operators | 0.1% (10) | 0.3% (10) | 0.0% (0) |
| Mining, quarrying, and oil and gas extraction | 0.1% (8) | 0.2% (8) | 0.0% (0) |
| Wood products | 0.1% (8) | 0.2% (8) | 0.0% (0) |
| Electronic shopping and mail-order houses | 0.1% (7) | 0.2% (7) | 0.0% (0) |
| Recyclable material merchant wholesalers | 0.1% (7) | 0.2% (7) | 0.0% (0) |
| Furniture and related product manufacturing | 0.1% (6) | 0.2% (6) | 0.0% (0) |
Unemployment in Gates-North Gates
- Unemployment by race in 2000
- Unemployment rate for White non-Hispanic residents
- 3.1%Males
- 3.0%Females
- Unemployment rate for Black residents
- 11.1%Males
- 6.5%Females
- Unemployment rate for Asian residents
- 6.4%Females
- Unemployment rate for Hispanic or Latino residents
- 4.8%Males
Time leaving home to go to work

<5am:
| Gates-North Gates: | 3.1% (224) |
| New York: | 2.4% (194,562) |
5:30am:
| Gates-North Gates: | 3.3% (234) |
| New York: | 2.1% (174,328) |
6am:
| Gates-North Gates: | 4.7% (339) |
| New York: | 3.1% (253,826) |
6:30am:
| Gates-North Gates: | 8.0% (575) |
| New York: | 7.0% (573,349) |
7am:
| Gates-North Gates: | 10.4% (750) |
| New York: | 8.6% (706,982) |
7:30am:
| Gates-North Gates: | 13.6% (980) |
| New York: | 14.0% (1,147,579) |
8am:
| Gates-North Gates: | 15.7% (1,130) |
| New York: | 14.8% (1,213,706) |
8:30am:
| Gates-North Gates: | 9.7% (696) |
| New York: | 13.9% (1,144,298) |
9am:
| Gates-North Gates: | 4.6% (329) |
| New York: | 7.5% (614,475) |
10am:
| Gates-North Gates: | 4.7% (337) |
| New York: | 7.2% (593,377) |
11am:
| Gates-North Gates: | 2.6% (188) |
| New York: | 2.7% (224,011) |
12pm:
| Gates-North Gates: | 1.2% (83) |
| New York: | 1.3% (105,049) |
4pm:
| Gates-North Gates: | 8.7% (625) |
| New York: | 6.3% (517,309) |
>4pm:
| Gates-North Gates: | 8.1% (584) |
| New York: | 6.1% (501,196) |
Travel time to work
Daytime population change due to commuting: -3,359 (-22.2%)
Workers who live and work in this place: 609 (8.5%)
Workers who live and work in this place: 609 (8.5%)


Less than 5 minutes:
| Gates-North Gates: | 2.8% (201) |
| New York: | 2.7% (219,036) |
5 to 9 minutes:
| Gates-North Gates: | 13.0% (931) |
| New York: | 8.3% (680,270) |
10 to 14 minutes:
| Gates-North Gates: | 26.6% (1,912) |
| New York: | 11.6% (956,590) |
15 to 19 minutes:
| Gates-North Gates: | 23.9% (1,720) |
| New York: | 12.4% (1,020,084) |
20 to 24 minutes:
| Gates-North Gates: | 17.3% (1,244) |
| New York: | 12.3% (1,013,757) |
25 to 29 minutes:
| Gates-North Gates: | 5.0% (360) |
| New York: | 4.9% (399,384) |
30 to 34 minutes:
| Gates-North Gates: | 5.5% (392) |
| New York: | 12.9% (1,058,688) |
35 to 39 minutes:
| Gates-North Gates: | 0.2% (15) |
| New York: | 2.5% (203,722) |
40 to 44 minutes:
| Gates-North Gates: | 0.8% (61) |
| New York: | 4.1% (340,311) |
45 to 59 minutes:
| Gates-North Gates: | 1.0% (70) |
| New York: | 9.8% (806,556) |
60 to 89 minutes:
| Gates-North Gates: | 1.3% (91) |
| New York: | 10.3% (848,185) |
90 or more minutes:
| Gates-North Gates: | 1.1% (77) |
| New York: | 5.1% (417,464) |
Means of transportation to work


Drove car alone:
| Gates-North Gates: | 89.3% (6,416) |
| New York: | 56.3% (4,620,178) |
Carpooled:
| Gates-North Gates: | 6.8% (486) |
| New York: | 9.2% (756,918) |
Bus or trolley bus:
| Gates-North Gates: | 0.9% (67) |
| New York: | 5.8% (475,389) |
Streetcar or trolley car:
| Gates-North Gates: | 0.1% (6) |
| New York: | 0.1% (6,058) |
Walked:
| Gates-North Gates: | 0.9% (65) |
| New York: | 6.2% (511,721) |
Other means:
| Gates-North Gates: | 0.5% (34) |
| New York: | 0.5% (40,375) |
Private vehicle occupancy

Drove alone:
| Gates-North Gates: | 93.0% (6,416) |
| New York: | 85.9% (4,620,178) |
In 2 person carpool:
| Gates-North Gates: | 6.3% (435) |
| New York: | 11.0% (590,255) |
In 3 person carpool:
| Gates-North Gates: | 0.5% (34) |
| New York: | 1.8% (96,470) |
In 5-6 person carpool:
| Gates-North Gates: | 0.1% (9) |
| New York: | 0.3% (16,644) |
In 7+ person carpool:
| Gates-North Gates: | 0.1% (8) |
| New York: | 0.3% (17,437) |
Class of workers
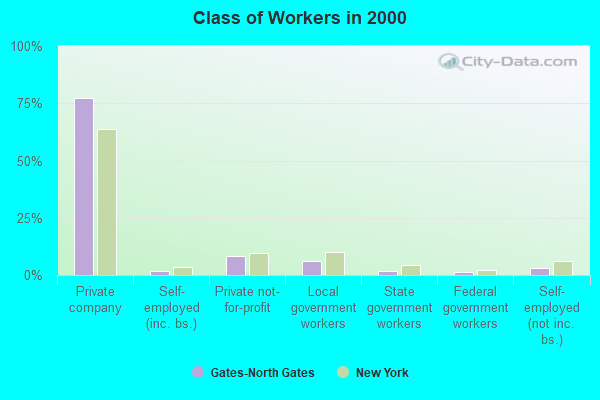
Employee of private company:
| Gates-North Gates: | 77.3% (5,625) |
| New York: | 63.7% (5,340,134) |
Self-employed in own incorporated business:
| Gates-North Gates: | 1.8% (130) |
| New York: | 3.4% (283,619) |
Private not-for-profit wage and salary workers:
| Gates-North Gates: | 8.4% (615) |
| New York: | 9.7% (810,356) |
Local government workers:
| Gates-North Gates: | 6.2% (453) |
| New York: | 10.2% (858,120) |
State government workers:
| Gates-North Gates: | 1.8% (134) |
| New York: | 4.6% (383,673) |
Federal government workers:
| Gates-North Gates: | 1.4% (99) |
| New York: | 2.2% (185,100) |
Self-employed workers in own not incorporated business:
| Gates-North Gates: | 3.1% (223) |
| New York: | 6.0% (501,068) |

Employee of private company - Males:
| Gates-North Gates: | 80.6% (2,977) |
| New York: | 66.2% (2,902,064) |
Self-employed in own incorporated business - Males:
| Gates-North Gates: | 2.7% (100) |
| New York: | 4.9% (215,651) |
Private not-for-profit wage and salary workers - Males:
| Gates-North Gates: | 4.4% (164) |
| New York: | 6.3% (277,787) |
Local government workers - Males:
| Gates-North Gates: | 5.8% (213) |
| New York: | 8.7% (380,426) |
State government workers - Males:
| Gates-North Gates: | 1.2% (44) |
| New York: | 4.1% (181,784) |
Federal government workers - Males:
| Gates-North Gates: | 1.2% (46) |
| New York: | 2.3% (102,647) |
Self-employed workers in own not incorporated business - Males:
| Gates-North Gates: | 4.0% (149) |
| New York: | 7.1% (312,497) |

Employee of private company - Females:
| Gates-North Gates: | 73.8% (2,648) |
| New York: | 60.9% (2,438,070) |
Self-employed in own incorporated business - Females:
| Gates-North Gates: | 0.8% (30) |
| New York: | 1.7% (67,968) |
Private not-for-profit wage and salary workers - Females:
| Gates-North Gates: | 12.6% (451) |
| New York: | 13.3% (532,569) |
Local government workers - Females:
| Gates-North Gates: | 6.7% (240) |
| New York: | 11.9% (477,694) |
State government workers - Females:
| Gates-North Gates: | 2.5% (90) |
| New York: | 5.0% (201,889) |
Federal government workers - Females:
| Gates-North Gates: | 1.5% (53) |
| New York: | 2.1% (82,453) |
Self-employed workers in own not incorporated business - Females:
| Gates-North Gates: | 2.1% (74) |
| New York: | 4.7% (188,571) |