Work and Jobs in Gig Harbor Peninsula, Washington (WA) Detailed Stats
Occupations, Industries, Unemployment, Workers, Commute
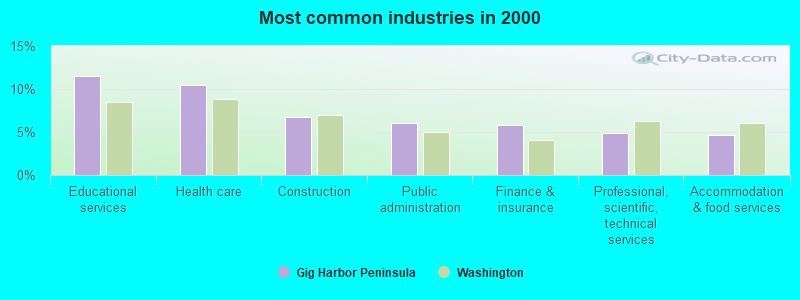
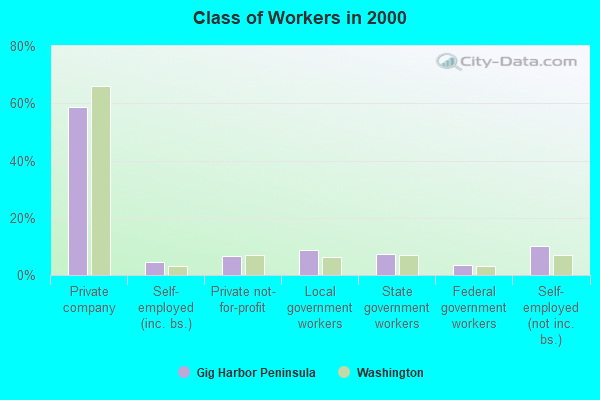
The most common industries in Gig Harbor Peninsula are: Educational services (11.5% of civilian employees), Health care (10.5% of civilian employees), Construction (6.7% of civilian employees). 58.9% of workers are employees of private companies, which is 12.1% less than the rate of 66.0% across the entire state of Washington.
Most common industries
Most common industries | |||
|---|---|---|---|
Industry | All | Males | Females |
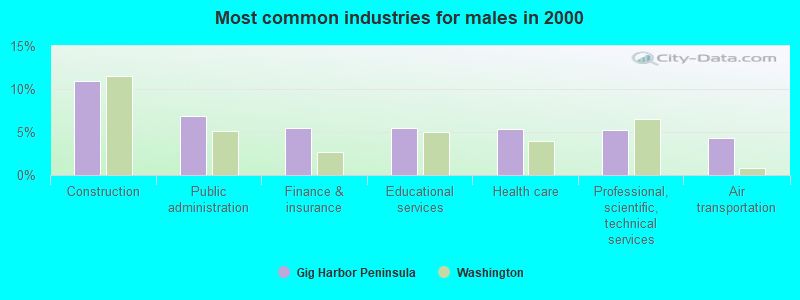
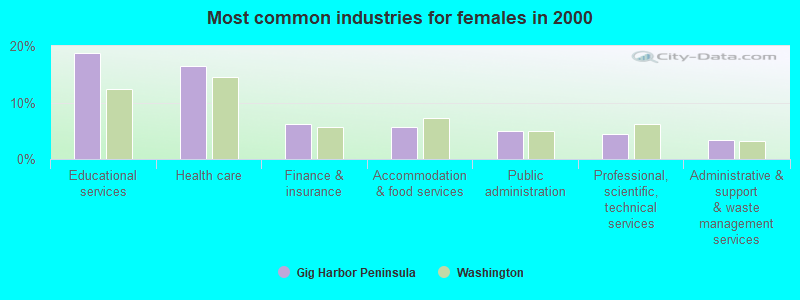
| Educational services | 11.5% (2,297) | 5.4% (583) | 18.7% (1,714) |
| Health care | 10.5% (2,086) | 5.4% (578) | 16.5% (1,508) |
| Construction | 6.7% (1,342) | 11.0% (1,178) | 1.8% (164) |
| Public administration | 6.0% (1,195) | 6.9% (742) | 5.0% (453) |
| Finance and insurance | 5.8% (1,157) | 5.5% (592) | 6.2% (565) |
| Professional, scientific, and technical services | 4.9% (973) | 5.2% (561) | 4.5% (412) |
| Accommodation and food services | 4.6% (918) | 3.7% (393) | 5.7% (525) |
| Administrative and support and waste management services | 3.6% (723) | 3.8% (410) | 3.4% (313) |
| Air transportation | 3.0% (604) | 4.4% (468) | 1.5% (136) |
| Real estate and rental and leasing | 2.8% (561) | 2.4% (254) | 3.4% (307) |
| Transportation equipment | 2.6% (524) | 3.6% (390) | 1.5% (134) |
| Motor vehicle and parts dealers | 2.0% (391) | 3.3% (357) | 0.4% (34) |
| Food and beverage stores | 1.9% (375) | 1.5% (165) | 2.3% (210) |
| Religious, grantmaking, civic, professional, and similar organizations | 1.8% (357) | 1.9% (200) | 1.7% (157) |
| Repair and maintenance | 1.6% (324) | 2.2% (241) | 0.9% (83) |
| Broadcasting and telecommunications | 1.6% (315) | 2.1% (227) | 1.0% (88) |
| Arts, entertainment, and recreation | 1.5% (301) | 1.6% (169) | 1.4% (132) |
| Publishing, and motion picture and sound recording industries | 1.3% (266) | 1.4% (148) | 1.3% (118) |
| Other transportation, and support activities, and couriers | 1.3% (261) | 1.6% (175) | 0.9% (86) |
| Agriculture, forestry, fishing and hunting | 1.3% (252) | 2.0% (211) | 0.4% (41) |
| Social assistance | 1.2% (236) | 0.1% (13) | 2.4% (223) |
| Computer and electronic products | 1.0% (206) | 1.6% (170) | 0.4% (36) |
| Truck transportation | 1.0% (203) | 1.4% (152) | 0.6% (51) |
| Groceries and related products merchant wholesalers | 1.0% (197) | 1.4% (155) | 0.5% (42) |
| Utilities | 1.0% (194) | 1.6% (169) | 0.3% (25) |
| Private households | 0.9% (172) | 0.3% (31) | 1.5% (141) |
| Metal and metal products | 0.8% (168) | 1.4% (155) | 0.1% (13) |
| Building material and garden equipment and supplies dealers | 0.8% (168) | 1.1% (115) | 0.6% (53) |
| Department and other general merchandise stores | 0.8% (168) | 0.1% (13) | 1.7% (155) |
| Used merchandise, gift, novelty, and souvenir, and other miscellaneous stores | 0.8% (164) | 0.6% (63) | 1.1% (101) |
| Personal and laundry services | 0.8% (157) | 0.5% (56) | 1.1% (101) |
| Miscellaneous manufacturing | 0.8% (157) | 0.9% (101) | 0.6% (56) |
| Data processing, libraries, and other information services | 0.8% (153) | 0.4% (38) | 1.3% (115) |
| Other direct selling establishments | 0.7% (145) | 0.5% (54) | 1.0% (91) |
| Wood products | 0.7% (139) | 0.9% (101) | 0.4% (38) |
| Miscellaneous nondurable goods merchant wholesalers | 0.7% (137) | 0.9% (98) | 0.4% (39) |
| Printing and related support activities | 0.7% (130) | 0.7% (74) | 0.6% (56) |
| Food | 0.6% (121) | 0.8% (87) | 0.4% (34) |
| Furniture and home furnishings, and household appliance stores | 0.5% (107) | 0.5% (54) | 0.6% (53) |
| Pharmacies and drug stores | 0.5% (97) | 0.1% (13) | 0.9% (84) |
| Paper | 0.5% (93) | 0.7% (75) | 0.2% (18) |
| Plastics and rubber products | 0.4% (89) | 0.7% (71) | 0.2% (18) |
| Professional and commercial equipment and supplies merchant wholesalers | 0.4% (89) | 0.5% (56) | 0.4% (33) |
| Radio, TV, and computer stores | 0.4% (80) | 0.6% (65) | 0.2% (15) |
| U. S. Postal service | 0.4% (76) | 0.5% (49) | 0.3% (27) |
| Clothing and accessories, including shoe, stores | 0.3% (66) | 0.3% (37) | 0.3% (29) |
| Lumber and other construction materials merchant wholesalers | 0.3% (64) | 0.3% (37) | 0.3% (27) |
| Drugs, sundries, and chemical and allied products merchant wholesalers | 0.3% (61) | 0.4% (39) | 0.2% (22) |
| Chemicals | 0.3% (59) | 0.5% (52) | 0.1% (7) |
| Machinery, equipment, and supplies merchant wholesalers | 0.3% (58) | 0.4% (44) | 0.2% (14) |
| Nonmetallic mineral products | 0.3% (55) | 0.2% (21) | 0.4% (34) |
| Sporting goods, camera, and hobby and toy stores | 0.3% (54) | 0.3% (28) | 0.3% (26) |
| Electrical and electronic goods merchant wholesalers | 0.3% (51) | 0.5% (51) | 0.0% (0) |
| Electronic shopping and mail-order houses | 0.2% (41) | 0.1% (12) | 0.3% (29) |
| Furniture and related product manufacturing | 0.2% (38) | 0.2% (21) | 0.2% (17) |
| Machinery | 0.2% (37) | 0.3% (37) | 0.0% (0) |
| Apparel, fabrics, and notions merchant wholesalers | 0.2% (34) | 0.3% (28) | 0.1% (6) |
| Hardware, plumbing and heating equipment, and supplies merchant wholesalers | 0.2% (33) | 0.2% (25) | 0.1% (8) |
| Rail transportation | 0.2% (31) | 0.3% (31) | 0.0% (0) |
| Metals and minerals, except petroleum, merchant wholesalers | 0.1% (29) | 0.3% (29) | 0.0% (0) |
| Mining, quarrying, and oil and gas extraction | 0.1% (29) | 0.3% (29) | 0.0% (0) |
| Motor vehicles, parts and supplies merchant wholesalers | 0.1% (25) | 0.2% (19) | 0.1% (6) |
| Apparel | 0.1% (24) | 0.0% (0) | 0.3% (24) |
| Gasoline stations | 0.1% (24) | 0.1% (12) | 0.1% (12) |
| Health and personal care, except drug, stores | 0.1% (20) | 0.0% (0) | 0.2% (20) |
| Office supplies and stationery stores | 0.1% (19) | 0.2% (19) | 0.0% (0) |
| Miscellaneous durable goods merchant wholesalers | 0.1% (17) | 0.2% (17) | 0.0% (0) |
| Paper and paper products merchant wholesalers | 0.1% (15) | 0.1% (15) | 0.0% (0) |
Unemployment in Gig Harbor Peninsula
- Unemployment by race in 2000
- Unemployment rate for White non-Hispanic residents
- 4.1%Males
- 4.4%Females
- Unemployment rate for Black residents
- 9.6%Females
- Unemployment rate for American Indian and Alaska Native residents
- 7.5%Males
- 10.5%Females
- Unemployment rate for Asian residents
- 6.3%Females
- Unemployment rate for other race residents
- 3.8%Males
- Unemployment rate for two or more race residents
- 5.8%Males
- 5.2%Females
- Unemployment rate for Hispanic or Latino residents
- 4.9%Males
- 4.0%Females
Time leaving home to go to work

<5am:
| Gig Harbor Peninsula: | 3.8% (757) |
| Washington: | 4.2% (115,997) |
5:30am:
| Gig Harbor Peninsula: | 4.6% (903) |
| Washington: | 3.7% (102,868) |
6am:
| Gig Harbor Peninsula: | 5.9% (1,153) |
| Washington: | 5.3% (147,812) |
6:30am:
| Gig Harbor Peninsula: | 10.6% (2,094) |
| Washington: | 8.9% (248,462) |
7am:
| Gig Harbor Peninsula: | 9.8% (1,931) |
| Washington: | 10.3% (288,005) |
7:30am:
| Gig Harbor Peninsula: | 13.9% (2,734) |
| Washington: | 13.5% (375,030) |
8am:
| Gig Harbor Peninsula: | 11.3% (2,225) |
| Washington: | 13.4% (372,576) |
8:30am:
| Gig Harbor Peninsula: | 9.4% (1,853) |
| Washington: | 9.0% (252,058) |
9am:
| Gig Harbor Peninsula: | 5.1% (1,002) |
| Washington: | 5.1% (141,936) |
10am:
| Gig Harbor Peninsula: | 7.4% (1,452) |
| Washington: | 5.8% (161,204) |
11am:
| Gig Harbor Peninsula: | 2.4% (474) |
| Washington: | 2.5% (70,123) |
12pm:
| Gig Harbor Peninsula: | 1.0% (195) |
| Washington: | 1.3% (35,612) |
4pm:
| Gig Harbor Peninsula: | 5.5% (1,089) |
| Washington: | 6.8% (190,565) |
>4pm:
| Gig Harbor Peninsula: | 3.6% (716) |
| Washington: | 5.8% (162,401) |
Travel time to work


Less than 5 minutes:
| Gig Harbor Peninsula: | 2.7% (534) |
| Washington: | 3.3% (91,132) |
5 to 9 minutes:
| Gig Harbor Peninsula: | 6.7% (1,321) |
| Washington: | 10.3% (286,517) |
10 to 14 minutes:
| Gig Harbor Peninsula: | 11.4% (2,238) |
| Washington: | 14.1% (391,606) |
15 to 19 minutes:
| Gig Harbor Peninsula: | 8.5% (1,677) |
| Washington: | 15.0% (418,990) |
20 to 24 minutes:
| Gig Harbor Peninsula: | 9.5% (1,881) |
| Washington: | 14.2% (394,209) |
25 to 29 minutes:
| Gig Harbor Peninsula: | 5.7% (1,128) |
| Washington: | 5.8% (162,590) |
30 to 34 minutes:
| Gig Harbor Peninsula: | 13.1% (2,579) |
| Washington: | 12.5% (348,311) |
35 to 39 minutes:
| Gig Harbor Peninsula: | 4.2% (829) |
| Washington: | 2.6% (73,592) |
40 to 44 minutes:
| Gig Harbor Peninsula: | 6.6% (1,303) |
| Washington: | 3.4% (95,182) |
45 to 59 minutes:
| Gig Harbor Peninsula: | 12.6% (2,478) |
| Washington: | 7.0% (195,343) |
60 to 89 minutes:
| Gig Harbor Peninsula: | 8.4% (1,646) |
| Washington: | 4.7% (131,691) |
90 or more minutes:
| Gig Harbor Peninsula: | 4.9% (964) |
| Washington: | 2.7% (75,486) |
Means of transportation to work


Drove car alone:
| Gig Harbor Peninsula: | 77.7% (15,319) |
| Washington: | 73.3% (2,040,833) |
Carpooled:
| Gig Harbor Peninsula: | 12.3% (2,415) |
| Washington: | 12.8% (357,742) |
Bus or trolley bus:
| Gig Harbor Peninsula: | 1.2% (229) |
| Washington: | 4.5% (124,450) |
Ferryboat:
| Gig Harbor Peninsula: | 0.2% (34) |
| Washington: | 0.3% (8,923) |
Motorcycle:
| Gig Harbor Peninsula: | 0.1% (15) |
| Washington: | 0.2% (4,353) |
Bicycle:
| Gig Harbor Peninsula: | 0.0% (8) |
| Washington: | 0.6% (16,205) |
Walked:
| Gig Harbor Peninsula: | 1.4% (285) |
| Washington: | 3.2% (89,739) |
Other means:
| Gig Harbor Peninsula: | 1.4% (273) |
| Washington: | 0.7% (19,499) |
Private vehicle occupancy

Drove alone:
| Gig Harbor Peninsula: | 86.4% (15,319) |
| Washington: | 85.1% (2,040,833) |
In 2 person carpool:
| Gig Harbor Peninsula: | 11.3% (2,011) |
| Washington: | 11.8% (282,638) |
In 3 person carpool:
| Gig Harbor Peninsula: | 0.9% (167) |
| Washington: | 1.9% (44,791) |
In 4 person carpool:
| Gig Harbor Peninsula: | 0.7% (116) |
| Washington: | 0.6% (14,195) |
In 5-6 person carpool:
| Gig Harbor Peninsula: | 0.2% (40) |
| Washington: | 0.3% (7,914) |
In 7+ person carpool:
| Gig Harbor Peninsula: | 0.5% (81) |
| Washington: | 0.3% (8,204) |
Class of workers
Employee of private company:
| Gig Harbor Peninsula: | 58.9% (11,706) |
| Washington: | 66.0% (1,843,000) |
Self-employed in own incorporated business:
| Gig Harbor Peninsula: | 4.5% (890) |
| Washington: | 3.2% (90,102) |
Private not-for-profit wage and salary workers:
| Gig Harbor Peninsula: | 6.7% (1,335) |
| Washington: | 6.9% (191,927) |
Local government workers:
| Gig Harbor Peninsula: | 8.8% (1,741) |
| Washington: | 6.4% (178,161) |
State government workers:
| Gig Harbor Peninsula: | 7.3% (1,455) |
| Washington: | 6.9% (192,408) |
Federal government workers:
| Gig Harbor Peninsula: | 3.4% (675) |
| Washington: | 3.2% (89,153) |
Self-employed workers in own not incorporated business:
| Gig Harbor Peninsula: | 10.0% (1,994) |
| Washington: | 7.2% (199,827) |
Unpaid family workers:
| Gig Harbor Peninsula: | 0.5% (92) |
| Washington: | 0.3% (9,144) |

Employee of private company - Males:
| Gig Harbor Peninsula: | 62.3% (6,689) |
| Washington: | 69.7% (1,044,674) |
Self-employed in own incorporated business - Males:
| Gig Harbor Peninsula: | 5.7% (615) |
| Washington: | 4.3% (64,169) |
Private not-for-profit wage and salary workers - Males:
| Gig Harbor Peninsula: | 4.1% (439) |
| Washington: | 4.2% (63,257) |
Local government workers - Males:
| Gig Harbor Peninsula: | 8.0% (855) |
| Washington: | 5.3% (79,844) |
State government workers - Males:
| Gig Harbor Peninsula: | 4.0% (428) |
| Washington: | 5.1% (76,834) |
Federal government workers - Males:
| Gig Harbor Peninsula: | 4.6% (497) |
| Washington: | 3.5% (52,763) |
Self-employed workers in own not incorporated business - Males:
| Gig Harbor Peninsula: | 11.0% (1,181) |
| Washington: | 7.6% (114,199) |
Unpaid family workers - Males:
| Gig Harbor Peninsula: | 0.4% (38) |
| Washington: | 0.3% (3,889) |

Employee of private company - Females:
| Gig Harbor Peninsula: | 54.9% (5,017) |
| Washington: | 61.7% (798,326) |
Self-employed in own incorporated business - Females:
| Gig Harbor Peninsula: | 3.0% (275) |
| Washington: | 2.0% (25,933) |
Private not-for-profit wage and salary workers - Females:
| Gig Harbor Peninsula: | 9.8% (896) |
| Washington: | 9.9% (128,670) |
Local government workers - Females:
| Gig Harbor Peninsula: | 9.7% (886) |
| Washington: | 7.6% (98,317) |
State government workers - Females:
| Gig Harbor Peninsula: | 11.2% (1,027) |
| Washington: | 8.9% (115,574) |
Federal government workers - Females:
| Gig Harbor Peninsula: | 1.9% (178) |
| Washington: | 2.8% (36,390) |
Self-employed workers in own not incorporated business - Females:
| Gig Harbor Peninsula: | 8.9% (813) |
| Washington: | 6.6% (85,628) |
Unpaid family workers - Females:
| Gig Harbor Peninsula: | 0.6% (54) |
| Washington: | 0.4% (5,255) |