Work and Jobs in Grand Valley, Colorado (CO) Detailed Stats
Occupations, Industries, Unemployment, Workers, Commute
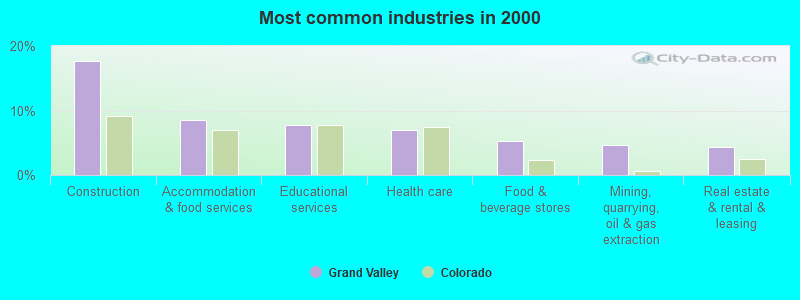
The most common industries in Grand Valley are: Construction (17.7% of civilian employees), Accommodation & food services (8.5% of civilian employees), Educational services (7.7% of civilian employees). 66.6% of workers are employees of private companies, which is about the same as the rate of 67.3% across the entire state of Colorado.
Most common industries
Most common industries | |||
|---|---|---|---|
Industry | All | Males | Females |
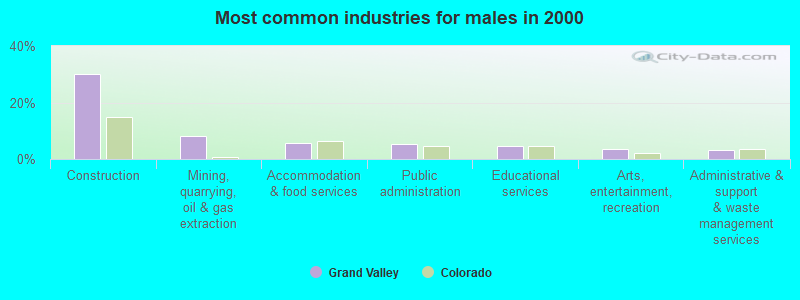
| Construction | 17.7% (367) | 30.0% (344) | 2.5% (23) |
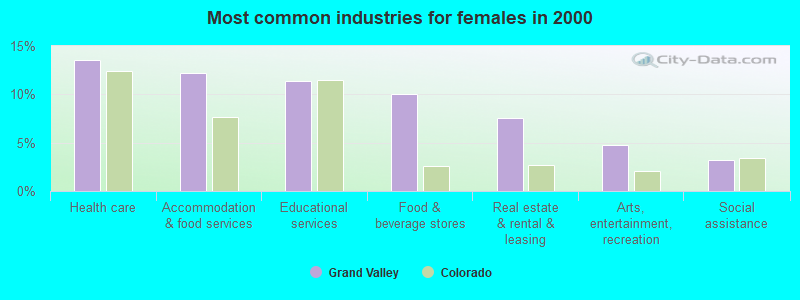
| Accommodation and food services | 8.5% (177) | 5.6% (64) | 12.2% (113) |
| Educational services | 7.7% (160) | 4.7% (54) | 11.4% (106) |
| Health care | 6.9% (144) | 1.6% (18) | 13.6% (126) |
| Food and beverage stores | 5.3% (109) | 1.4% (16) | 10.0% (93) |
| Mining, quarrying, and oil and gas extraction | 4.6% (96) | 8.1% (93) | 0.3% (3) |
| Real estate and rental and leasing | 4.3% (89) | 1.7% (19) | 7.5% (70) |
| Public administration | 4.1% (85) | 5.3% (61) | 2.6% (24) |
| Arts, entertainment, and recreation | 4.1% (84) | 3.5% (40) | 4.7% (44) |
| Administrative and support and waste management services | 3.1% (64) | 3.1% (36) | 3.0% (28) |
| Professional, scientific, and technical services | 2.2% (46) | 2.2% (25) | 2.3% (21) |
| Finance and insurance | 2.1% (43) | 1.2% (14) | 3.1% (29) |
| Other transportation, and support activities, and couriers | 1.9% (39) | 2.0% (23) | 1.7% (16) |
| Department and other general merchandise stores | 1.8% (37) | 1.0% (12) | 2.7% (25) |
| Truck transportation | 1.8% (37) | 2.4% (27) | 1.1% (10) |
| Motor vehicle and parts dealers | 1.7% (35) | 2.3% (26) | 1.0% (9) |
| Building material and garden equipment and supplies dealers | 1.7% (35) | 3.1% (35) | 0.0% (0) |
| Agriculture, forestry, fishing and hunting | 1.5% (31) | 2.0% (23) | 0.9% (8) |
| Social assistance | 1.4% (30) | 0.0% (0) | 3.2% (30) |
| Repair and maintenance | 1.3% (26) | 2.3% (26) | 0.0% (0) |
| Utilities | 1.2% (25) | 1.8% (21) | 0.4% (4) |
| Other direct selling establishments | 1.1% (22) | 0.5% (6) | 1.7% (16) |
| Electrical and electronic goods merchant wholesalers | 1.0% (20) | 1.7% (20) | 0.0% (0) |
| Machinery, equipment, and supplies merchant wholesalers | 0.9% (19) | 1.7% (19) | 0.0% (0) |
| Used merchandise, gift, novelty, and souvenir, and other miscellaneous stores | 0.9% (19) | 0.0% (0) | 2.0% (19) |
| Printing and related support activities | 0.8% (17) | 0.6% (7) | 1.1% (10) |
| Personal and laundry services | 0.8% (17) | 0.2% (2) | 1.6% (15) |
| Petroleum and petroleum products merchant wholesalers | 0.8% (16) | 0.5% (6) | 1.1% (10) |
| Groceries and related products merchant wholesalers | 0.8% (16) | 0.9% (10) | 0.6% (6) |
| Air transportation | 0.7% (15) | 0.7% (8) | 0.8% (7) |
| Religious, grantmaking, civic, professional, and similar organizations | 0.7% (14) | 0.0% (0) | 1.5% (14) |
| Broadcasting and telecommunications | 0.6% (12) | 1.0% (11) | 0.1% (1) |
| U. S. Postal service | 0.5% (11) | 0.5% (6) | 0.5% (5) |
| Gasoline stations | 0.5% (10) | 0.0% (0) | 1.1% (10) |
| Sporting goods, camera, and hobby and toy stores | 0.5% (10) | 0.0% (0) | 1.1% (10) |
| Office supplies and stationery stores | 0.4% (9) | 0.8% (9) | 0.0% (0) |
| Lumber and other construction materials merchant wholesalers | 0.4% (9) | 0.3% (4) | 0.5% (5) |
| Petroleum and coal products | 0.4% (9) | 0.8% (9) | 0.0% (0) |
| Rail transportation | 0.4% (8) | 0.7% (8) | 0.0% (0) |
| Paper and paper products merchant wholesalers | 0.4% (8) | 0.7% (8) | 0.0% (0) |
| Private households | 0.3% (7) | 0.0% (0) | 0.8% (7) |
| Chemicals | 0.3% (7) | 0.6% (7) | 0.0% (0) |
| Furniture and home furnishings, and household appliance stores | 0.3% (7) | 0.6% (7) | 0.0% (0) |
| Miscellaneous nondurable goods merchant wholesalers | 0.3% (7) | 0.0% (0) | 0.8% (7) |
| Food | 0.2% (5) | 0.4% (5) | 0.0% (0) |
| Nonmetallic mineral products | 0.1% (3) | 0.3% (3) | 0.0% (0) |
| Wood products | 0.1% (3) | 0.3% (3) | 0.0% (0) |
| Vending machine operators | 0.1% (3) | 0.3% (3) | 0.0% (0) |
| Warehousing and storage | 0.1% (3) | 0.0% (0) | 0.3% (3) |
| Apparel, fabrics, and notions merchant wholesalers | 0.1% (3) | 0.3% (3) | 0.0% (0) |
| Beverage and tobacco products | 0.1% (2) | 0.2% (2) | 0.0% (0) |
Unemployment in Grand Valley
- Unemployment by race in 2000
- Unemployment rate for White non-Hispanic residents
- 5.7%Males
- 3.0%Females
- Unemployment rate for other race residents
- 12.8%Males
- 15.4%Females
- Unemployment rate for Hispanic or Latino residents
- 5.4%Males
- 10.7%Females
Time leaving home to go to work

<5am:
| Grand Valley: | 7.6% (154) |
| Colorado: | 2.9% (62,865) |
5:30am:
| Grand Valley: | 5.5% (112) |
| Colorado: | 2.6% (57,037) |
6am:
| Grand Valley: | 5.5% (111) |
| Colorado: | 4.6% (100,940) |
6:30am:
| Grand Valley: | 8.9% (180) |
| Colorado: | 9.0% (197,321) |
7am:
| Grand Valley: | 12.5% (252) |
| Colorado: | 11.3% (246,749) |
7:30am:
| Grand Valley: | 17.4% (352) |
| Colorado: | 15.4% (336,717) |
8am:
| Grand Valley: | 11.8% (239) |
| Colorado: | 15.0% (329,151) |
8:30am:
| Grand Valley: | 6.6% (133) |
| Colorado: | 10.0% (219,216) |
9am:
| Grand Valley: | 3.1% (63) |
| Colorado: | 4.8% (105,802) |
10am:
| Grand Valley: | 4.7% (95) |
| Colorado: | 5.2% (114,870) |
11am:
| Grand Valley: | 1.2% (25) |
| Colorado: | 2.2% (48,948) |
12pm:
| Grand Valley: | 0.3% (7) |
| Colorado: | 1.0% (22,224) |
4pm:
| Grand Valley: | 3.9% (78) |
| Colorado: | 5.6% (122,019) |
>4pm:
| Grand Valley: | 6.9% (139) |
| Colorado: | 5.5% (119,635) |
Travel time to work


Less than 5 minutes:
| Grand Valley: | 3.0% (61) |
| Colorado: | 3.3% (72,206) |
5 to 9 minutes:
| Grand Valley: | 13.7% (278) |
| Colorado: | 10.8% (235,913) |
10 to 14 minutes:
| Grand Valley: | 16.0% (323) |
| Colorado: | 14.5% (318,642) |
15 to 19 minutes:
| Grand Valley: | 6.8% (138) |
| Colorado: | 15.2% (333,306) |
20 to 24 minutes:
| Grand Valley: | 11.8% (239) |
| Colorado: | 14.3% (313,409) |
25 to 29 minutes:
| Grand Valley: | 5.8% (117) |
| Colorado: | 5.7% (125,679) |
30 to 34 minutes:
| Grand Valley: | 6.3% (128) |
| Colorado: | 12.8% (281,268) |
35 to 39 minutes:
| Grand Valley: | 0.7% (15) |
| Colorado: | 2.6% (56,816) |
40 to 44 minutes:
| Grand Valley: | 2.2% (45) |
| Colorado: | 3.3% (71,983) |
45 to 59 minutes:
| Grand Valley: | 12.1% (245) |
| Colorado: | 6.6% (145,592) |
60 to 89 minutes:
| Grand Valley: | 8.4% (170) |
| Colorado: | 3.9% (85,337) |
90 or more minutes:
| Grand Valley: | 8.9% (181) |
| Colorado: | 2.0% (43,343) |
Means of transportation to work

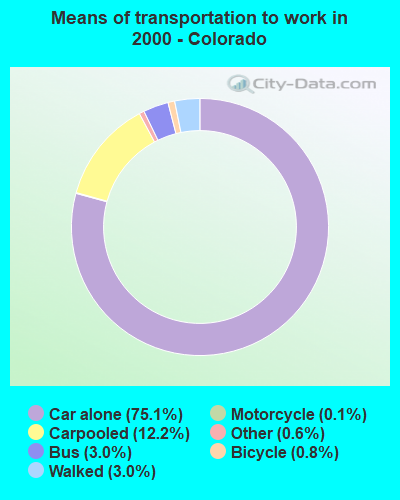
Drove car alone:
| Grand Valley: | 68.2% (1,381) |
| Colorado: | 75.1% (1,646,454) |
Carpooled:
| Grand Valley: | 24.2% (490) |
| Colorado: | 12.2% (268,168) |
Bus or trolley bus:
| Grand Valley: | 0.7% (14) |
| Colorado: | 3.0% (66,179) |
Walked:
| Grand Valley: | 2.0% (41) |
| Colorado: | 3.0% (65,668) |
Other means:
| Grand Valley: | 0.7% (14) |
| Colorado: | 0.6% (14,202) |
Private vehicle occupancy

Drove alone:
| Grand Valley: | 73.8% (1,381) |
| Colorado: | 86.0% (1,646,454) |
In 2 person carpool:
| Grand Valley: | 21.5% (403) |
| Colorado: | 11.0% (210,761) |
In 3 person carpool:
| Grand Valley: | 3.5% (66) |
| Colorado: | 2.0% (37,987) |
In 4 person carpool:
| Grand Valley: | 0.9% (16) |
| Colorado: | 0.6% (12,167) |
In 5-6 person carpool:
| Grand Valley: | 0.3% (5) |
| Colorado: | 0.3% (5,172) |
Class of workers
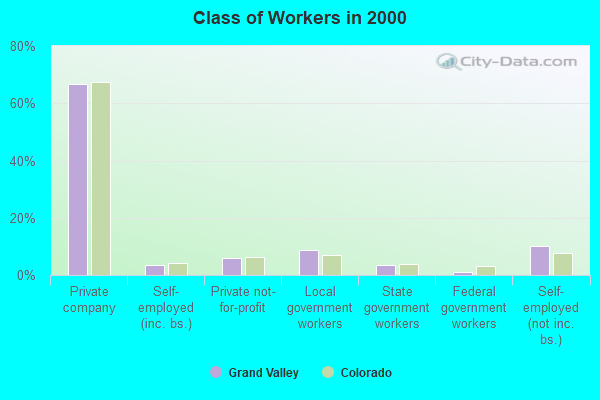
Employee of private company:
| Grand Valley: | 66.6% (1,382) |
| Colorado: | 67.3% (1,485,056) |
Self-employed in own incorporated business:
| Grand Valley: | 3.5% (73) |
| Colorado: | 4.4% (96,165) |
Private not-for-profit wage and salary workers:
| Grand Valley: | 6.0% (125) |
| Colorado: | 6.4% (141,129) |
Local government workers:
| Grand Valley: | 8.7% (181) |
| Colorado: | 6.9% (152,123) |
State government workers:
| Grand Valley: | 3.7% (76) |
| Colorado: | 3.9% (85,273) |
Federal government workers:
| Grand Valley: | 1.2% (25) |
| Colorado: | 3.1% (68,409) |
Self-employed workers in own not incorporated business:
| Grand Valley: | 10.1% (210) |
| Colorado: | 7.7% (169,415) |
Unpaid family workers:
| Grand Valley: | 0.1% (2) |
| Colorado: | 0.3% (7,624) |

Employee of private company - Males:
| Grand Valley: | 70.3% (805) |
| Colorado: | 70.0% (837,579) |
Self-employed in own incorporated business - Males:
| Grand Valley: | 4.5% (52) |
| Colorado: | 5.7% (68,129) |
Private not-for-profit wage and salary workers - Males:
| Grand Valley: | 2.0% (23) |
| Colorado: | 3.8% (45,796) |
Local government workers - Males:
| Grand Valley: | 9.0% (103) |
| Colorado: | 5.4% (64,615) |
State government workers - Males:
| Grand Valley: | 3.1% (36) |
| Colorado: | 3.2% (38,404) |
Federal government workers - Males:
| Grand Valley: | 0.5% (6) |
| Colorado: | 3.3% (39,817) |
Self-employed workers in own not incorporated business - Males:
| Grand Valley: | 10.5% (120) |
| Colorado: | 8.3% (98,982) |

Employee of private company - Females:
| Grand Valley: | 62.1% (577) |
| Colorado: | 64.2% (647,477) |
Self-employed in own incorporated business - Females:
| Grand Valley: | 2.3% (21) |
| Colorado: | 2.8% (28,036) |
Private not-for-profit wage and salary workers - Females:
| Grand Valley: | 11.0% (102) |
| Colorado: | 9.5% (95,333) |
Local government workers - Females:
| Grand Valley: | 8.4% (78) |
| Colorado: | 8.7% (87,508) |
State government workers - Females:
| Grand Valley: | 4.3% (40) |
| Colorado: | 4.6% (46,869) |
Federal government workers - Females:
| Grand Valley: | 2.0% (19) |
| Colorado: | 2.8% (28,592) |
Self-employed workers in own not incorporated business - Females:
| Grand Valley: | 9.7% (90) |
| Colorado: | 7.0% (70,433) |
Unpaid family workers - Females:
| Grand Valley: | 0.2% (2) |
| Colorado: | 0.4% (4,185) |