Work and Jobs in Green Valley, Maryland (MD) Detailed Stats
Occupations, Industries, Unemployment, Workers, Commute

Discuss Green Valley, Maryland work on our local forum with over 2,400,000 registered users
The most common industries in Green Valley are: Professional, scientific, technical services (13.8% of civilian employees), Construction (10.3% of civilian employees), Educational services (8.7% of civilian employees). 50.0% of workers work in Frederick County and 18.0% of all workers work at home. 54.3% of workers are employees of private companies, which is 6.6% less than the rate of 57.9% across the entire state of Maryland.
Whole page based on the data from 2000 / 2022 when the population of Green Valley, Maryland was 12,262 / 13,608
Whole page based on the data from 2000 / 2022 when the population of Green Valley, Maryland was 12,262 / 13,608
Most common industries
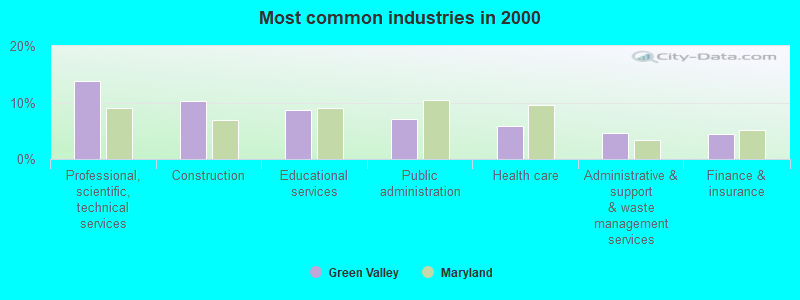
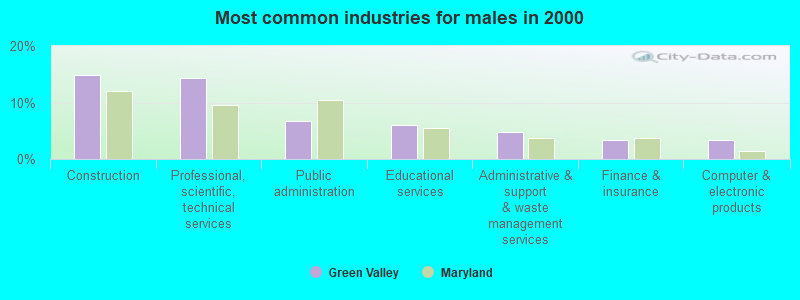
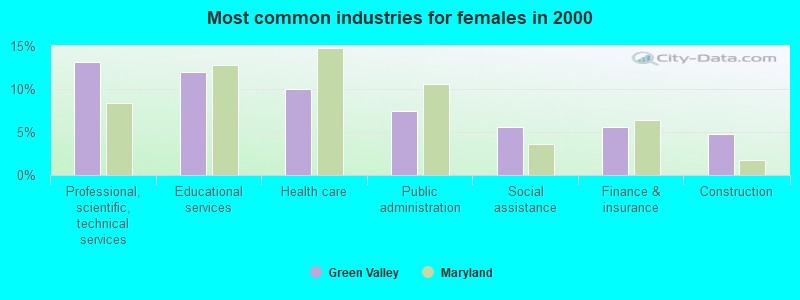
Most common industries | |||
|---|---|---|---|
Industry | All | Males | Females |
| Professional, scientific, and technical services | 13.8% (870) | 14.3% (498) | 13.1% (372) |
| Construction | 10.3% (651) | 14.8% (516) | 4.8% (135) |
| Educational services | 8.7% (548) | 6.0% (208) | 12.0% (340) |
| Public administration | 7.0% (443) | 6.7% (233) | 7.4% (210) |
| Health care | 5.8% (366) | 2.3% (81) | 10.0% (285) |
| Administrative and support and waste management services | 4.6% (288) | 4.8% (168) | 4.2% (120) |
| Finance and insurance | 4.3% (275) | 3.4% (117) | 5.6% (158) |
| Accommodation and food services | 3.0% (189) | 3.0% (104) | 3.0% (85) |
| Computer and electronic products | 2.9% (185) | 3.3% (116) | 2.4% (69) |
| Social assistance | 2.6% (166) | 0.2% (7) | 5.6% (159) |
| Food and beverage stores | 2.5% (158) | 2.4% (85) | 2.6% (73) |
| Motor vehicle and parts dealers | 2.3% (148) | 2.7% (94) | 1.9% (54) |
| Other transportation, and support activities, and couriers | 2.3% (145) | 3.3% (115) | 1.1% (30) |
| Repair and maintenance | 1.7% (106) | 2.1% (73) | 1.2% (33) |
| Broadcasting and telecommunications | 1.6% (104) | 1.6% (56) | 1.7% (48) |
| Religious, grantmaking, civic, professional, and similar organizations | 1.6% (103) | 1.1% (37) | 2.3% (66) |
| Radio, TV, and computer stores | 1.6% (99) | 1.5% (54) | 1.6% (45) |
| Miscellaneous manufacturing | 1.6% (99) | 2.3% (81) | 0.6% (18) |
| U. S. Postal service | 1.5% (98) | 1.6% (55) | 1.5% (43) |
| Real estate and rental and leasing | 1.5% (97) | 2.0% (69) | 1.0% (28) |
| Transportation equipment | 1.4% (91) | 2.6% (91) | 0.0% (0) |
| Printing and related support activities | 1.4% (87) | 1.7% (60) | 1.0% (27) |
| Personal and laundry services | 1.3% (82) | 0.7% (26) | 2.0% (56) |
| Publishing, and motion picture and sound recording industries | 1.3% (80) | 0.7% (23) | 2.0% (57) |
| Data processing, libraries, and other information services | 1.2% (77) | 1.2% (43) | 1.2% (34) |
| Arts, entertainment, and recreation | 1.1% (71) | 1.8% (61) | 0.4% (10) |
| Department and other general merchandise stores | 0.9% (56) | 0.8% (27) | 1.0% (29) |
| Utilities | 0.9% (54) | 1.3% (47) | 0.2% (7) |
| Used merchandise, gift, novelty, and souvenir, and other miscellaneous stores | 0.7% (42) | 0.5% (16) | 0.9% (26) |
| Chemicals | 0.6% (38) | 0.6% (21) | 0.6% (17) |
| Sporting goods, camera, and hobby and toy stores | 0.6% (35) | 0.3% (9) | 0.9% (26) |
| Building material and garden equipment and supplies dealers | 0.6% (35) | 0.7% (25) | 0.4% (10) |
| Hardware, plumbing and heating equipment, and supplies merchant wholesalers | 0.6% (35) | 0.7% (25) | 0.4% (10) |
| Gasoline stations | 0.5% (29) | 0.6% (21) | 0.3% (8) |
| Machinery | 0.4% (25) | 0.7% (25) | 0.0% (0) |
| Metal and metal products | 0.4% (25) | 0.5% (18) | 0.2% (7) |
| Recyclable material merchant wholesalers | 0.4% (25) | 0.7% (25) | 0.0% (0) |
| Furniture and home furnishings, and household appliance stores | 0.4% (24) | 0.3% (9) | 0.5% (15) |
| Management of companies and enterprises | 0.4% (24) | 0.4% (14) | 0.4% (10) |
| Rail transportation | 0.4% (23) | 0.7% (23) | 0.0% (0) |
| Agriculture, forestry, fishing and hunting | 0.3% (22) | 0.0% (0) | 0.8% (22) |
| Lumber and other construction materials merchant wholesalers | 0.3% (20) | 0.6% (20) | 0.0% (0) |
| Other direct selling establishments | 0.3% (18) | 0.0% (0) | 0.6% (18) |
| Music stores | 0.3% (18) | 0.3% (9) | 0.3% (9) |
| Nonmetallic mineral products | 0.2% (15) | 0.4% (15) | 0.0% (0) |
| Food | 0.2% (13) | 0.2% (7) | 0.2% (6) |
| Machinery, equipment, and supplies merchant wholesalers | 0.2% (12) | 0.3% (12) | 0.0% (0) |
| Truck transportation | 0.2% (12) | 0.3% (12) | 0.0% (0) |
| Private households | 0.2% (11) | 0.0% (0) | 0.4% (11) |
| Pharmacies and drug stores | 0.2% (10) | 0.0% (0) | 0.4% (10) |
| Paper and paper products merchant wholesalers | 0.2% (10) | 0.0% (0) | 0.4% (10) |
| Groceries and related products merchant wholesalers | 0.1% (9) | 0.3% (9) | 0.0% (0) |
| Textile mills and textile products | 0.1% (8) | 0.2% (8) | 0.0% (0) |
| Warehousing and storage | 0.1% (8) | 0.2% (8) | 0.0% (0) |
| Miscellaneous durable goods merchant wholesalers | 0.1% (8) | 0.2% (8) | 0.0% (0) |
| Air transportation | 0.1% (8) | 0.0% (0) | 0.3% (8) |
| Professional and commercial equipment and supplies merchant wholesalers | 0.1% (8) | 0.0% (0) | 0.3% (8) |
| Beverage and tobacco products | 0.1% (7) | 0.0% (0) | 0.2% (7) |
Unemployment in Green Valley
- Unemployment by race in 2022
- Unemployment rate for White non-Hispanic residents
- 0.8%Males
- 2.1%Females
- Unemployment rate for Black residents
- 27.5%Males
- 11.5%Females
- Unemployment rate for Asian residents
- 19.0%Females
- Unemployment rate for two or more race residents
- 3.2%Males
- Unemployment by race in 2000
- Unemployment rate for White non-Hispanic residents
- 2.2%Males
- 2.6%Females
- Unemployment rate for Black residents
- 69.2%Males
- 20.0%Females
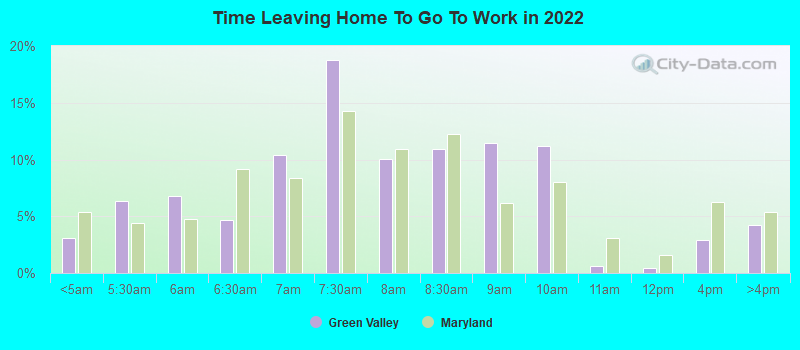
Time leaving home to go to work
12:00 a.m. to 4:59 a.m.:
| Green Valley: | 3.1% (165) |
| Maryland: | 5.4% (137,252) |
5:00 a.m. to 5:29 a.m.:
| Green Valley: | 6.4% (340) |
| Maryland: | 4.4% (112,169) |
5:30 a.m. to 5:59 a.m.:
| Green Valley: | 6.8% (364) |
| Maryland: | 4.8% (121,529) |
6:00 a.m. to 6:29 a.m.:
| Green Valley: | 4.6% (247) |
| Maryland: | 9.1% (231,673) |
6:30 a.m. to 6:59 a.m.:
| Green Valley: | 10.4% (558) |
| Maryland: | 8.3% (211,777) |
7:00 a.m. to 7:29 a.m.:
| Green Valley: | 18.7% (1,002) |
| Maryland: | 14.3% (362,787) |
7:30 a.m. to 7:59 a.m.:
| Green Valley: | 10.0% (535) |
| Maryland: | 10.9% (277,831) |
8:00 a.m. to 8:29 a.m.:
| Green Valley: | 10.9% (586) |
| Maryland: | 12.2% (310,633) |
8:30 a.m. to 8:59 a.m.:
| Green Valley: | 11.5% (612) |
| Maryland: | 6.2% (157,490) |
9:00 a.m. to 9:59 a.m.:
| Green Valley: | 11.2% (600) |
| Maryland: | 8.0% (204,415) |
10:00 a.m. to 10:59 a.m.:
| Green Valley: | 0.7% (35) |
| Maryland: | 3.0% (77,287) |
11:00 a.m. to 11:59 a.m.:
| Green Valley: | 0.4% (22) |
| Maryland: | 1.6% (40,296) |
12:00 p.m. to 3:59 p.m.:
| Green Valley: | 2.9% (157) |
| Maryland: | 6.3% (159,318) |
4:00 p.m. to 11:59 p.m.:
| Green Valley: | 4.2% (224) |
| Maryland: | 5.3% (135,542) |

<5am:
| Green Valley: | 3.3% (205) |
| Maryland: | 3.0% (77,561) |
5:30am:
| Green Valley: | 5.4% (339) |
| Maryland: | 3.2% (81,972) |
6am:
| Green Valley: | 6.0% (380) |
| Maryland: | 4.7% (120,768) |
6:30am:
| Green Valley: | 11.4% (719) |
| Maryland: | 9.1% (235,203) |
7am:
| Green Valley: | 10.4% (656) |
| Maryland: | 10.3% (267,702) |
7:30am:
| Green Valley: | 14.9% (936) |
| Maryland: | 14.9% (386,941) |
8am:
| Green Valley: | 13.0% (817) |
| Maryland: | 14.3% (370,838) |
8:30am:
| Green Valley: | 9.7% (607) |
| Maryland: | 11.6% (300,061) |
9am:
| Green Valley: | 6.5% (411) |
| Maryland: | 6.0% (154,337) |
10am:
| Green Valley: | 5.5% (346) |
| Maryland: | 5.9% (151,747) |
11am:
| Green Valley: | 1.1% (68) |
| Maryland: | 2.2% (56,218) |
12pm:
| Green Valley: | 1.1% (72) |
| Maryland: | 1.0% (26,260) |
4pm:
| Green Valley: | 3.3% (210) |
| Maryland: | 5.3% (136,187) |
>4pm:
| Green Valley: | 3.4% (216) |
| Maryland: | 5.4% (139,172) |

12:00 a.m. to 4:59 a.m. - Males:
| Green Valley: | 4.4% (133) |
| Maryland: | 7.5% (99,701) |
5:00 a.m. to 5:29 a.m. - Males:
| Green Valley: | 8.3% (250) |
| Maryland: | 5.9% (79,059) |
5:30 a.m. to 5:59 a.m. - Males:
| Green Valley: | 5.8% (175) |
| Maryland: | 5.9% (79,436) |
6:00 a.m. to 6:29 a.m. - Males:
| Green Valley: | 4.8% (145) |
| Maryland: | 10.9% (145,135) |
6:30 a.m. to 6:59 a.m. - Males:
| Green Valley: | 8.6% (258) |
| Maryland: | 8.3% (110,674) |
7:00 a.m. to 7:29 a.m. - Males:
| Green Valley: | 21.9% (663) |
| Maryland: | 13.0% (173,935) |
7:30 a.m. to 7:59 a.m. - Males:
| Green Valley: | 6.7% (201) |
| Maryland: | 9.1% (121,963) |
8:00 a.m. to 8:29 a.m. - Males:
| Green Valley: | 16.0% (485) |
| Maryland: | 11.3% (150,709) |
8:30 a.m. to 8:59 a.m. - Males:
| Green Valley: | 6.7% (203) |
| Maryland: | 4.7% (62,260) |
9:00 a.m. to 9:59 a.m. - Males:
| Green Valley: | 7.6% (230) |
| Maryland: | 7.6% (101,199) |
10:00 a.m. to 10:59 a.m. - Males:
| Green Valley: | 0.6% (18) |
| Maryland: | 2.7% (35,582) |
11:00 a.m. to 11:59 a.m. - Males:
| Green Valley: | 0.6% (17) |
| Maryland: | 1.6% (20,846) |
12:00 p.m. to 3:59 p.m. - Males:
| Green Valley: | 4.4% (134) |
| Maryland: | 6.5% (86,966) |
4:00 p.m. to 11:59 p.m. - Males:
| Green Valley: | 4.1% (122) |
| Maryland: | 5.1% (68,188) |

12:00 a.m. to 4:59 a.m. - Females:
| Green Valley: | 1.2% (28) |
| Maryland: | 3.1% (37,551) |
5:00 a.m. to 5:29 a.m. - Females:
| Green Valley: | 3.9% (90) |
| Maryland: | 2.7% (33,110) |
5:30 a.m. to 5:59 a.m. - Females:
| Green Valley: | 9.2% (213) |
| Maryland: | 3.5% (42,093) |
6:00 a.m. to 6:29 a.m. - Females:
| Green Valley: | 4.4% (102) |
| Maryland: | 7.2% (86,538) |
6:30 a.m. to 6:59 a.m. - Females:
| Green Valley: | 13.0% (303) |
| Maryland: | 8.4% (101,103) |
7:00 a.m. to 7:29 a.m. - Females:
| Green Valley: | 14.4% (335) |
| Maryland: | 15.7% (188,852) |
7:30 a.m. to 7:59 a.m. - Females:
| Green Valley: | 14.4% (336) |
| Maryland: | 12.9% (155,868) |
8:00 a.m. to 8:29 a.m. - Females:
| Green Valley: | 6.2% (145) |
| Maryland: | 13.3% (159,924) |
8:30 a.m. to 8:59 a.m. - Females:
| Green Valley: | 17.3% (403) |
| Maryland: | 7.9% (95,230) |
9:00 a.m. to 9:59 a.m. - Females:
| Green Valley: | 14.7% (343) |
| Maryland: | 8.6% (103,216) |
10:00 a.m. to 10:59 a.m. - Females:
| Green Valley: | 0.7% (16) |
| Maryland: | 3.5% (41,705) |
12:00 p.m. to 3:59 p.m. - Females:
| Green Valley: | 1.5% (34) |
| Maryland: | 6.0% (72,352) |
4:00 p.m. to 11:59 p.m. - Females:
| Green Valley: | 2.4% (56) |
| Maryland: | 5.6% (67,354) |
Travel time to work
Percentage of workers working in this county: 50.0%
Number of people working at home: 1,257 (18.0% of all workers)
Daytime population change due to commuting: -5,058 (-41.2%)
Workers who live and work in this place: 668 (10.6%)
Number of people working at home: 1,257 (18.0% of all workers)
Daytime population change due to commuting: -5,058 (-41.2%)
Workers who live and work in this place: 668 (10.6%)


Less than 5 minutes:
| Green Valley: | 1.9% (119) |
| Maryland: | 1.8% (47,843) |
5 to 9 minutes:
| Green Valley: | 3.9% (248) |
| Maryland: | 6.6% (169,884) |
10 to 14 minutes:
| Green Valley: | 5.0% (313) |
| Maryland: | 10.5% (271,204) |
15 to 19 minutes:
| Green Valley: | 5.4% (341) |
| Maryland: | 12.4% (320,679) |
20 to 24 minutes:
| Green Valley: | 9.4% (592) |
| Maryland: | 13.0% (337,452) |
25 to 29 minutes:
| Green Valley: | 5.9% (368) |
| Maryland: | 6.1% (158,702) |
30 to 34 minutes:
| Green Valley: | 16.2% (1,016) |
| Maryland: | 14.5% (375,140) |
35 to 39 minutes:
| Green Valley: | 6.4% (402) |
| Maryland: | 3.5% (91,893) |
40 to 44 minutes:
| Green Valley: | 8.3% (520) |
| Maryland: | 4.8% (123,823) |
45 to 59 minutes:
| Green Valley: | 16.6% (1,042) |
| Maryland: | 11.3% (291,586) |
60 to 89 minutes:
| Green Valley: | 13.0% (817) |
| Maryland: | 8.6% (223,613) |
90 or more minutes:
| Green Valley: | 3.2% (204) |
| Maryland: | 3.6% (93,148) |
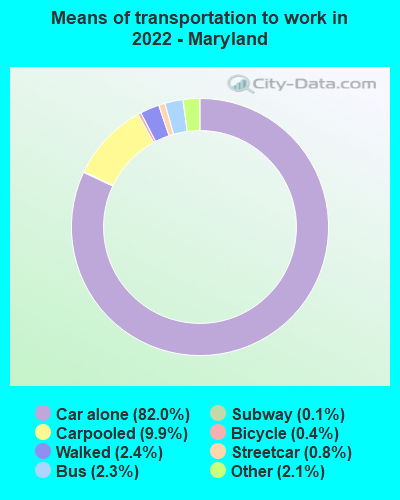
Means of transportation to work
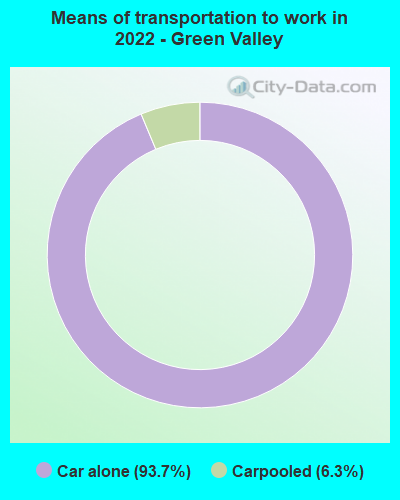
Drove car alone:
| Green Valley: | 93.7% (585) |
| Maryland: | 82.0% (909,901) |
Carpooled:
| Green Valley: | 6.3% (40) |
| Maryland: | 9.9% (115,593) |


Drove car alone:
| Green Valley: | 86.9% (5,458) |
| Maryland: | 73.7% (1,910,917) |
Carpooled:
| Green Valley: | 6.8% (425) |
| Maryland: | 12.4% (320,992) |
Bus or trolley bus:
| Green Valley: | 0.1% (8) |
| Maryland: | 3.6% (93,111) |
Subway or elevated:
| Green Valley: | 0.7% (41) |
| Maryland: | 2.9% (75,090) |
Railroad:
| Green Valley: | 0.1% (8) |
| Maryland: | 0.4% (10,568) |
Walked:
| Green Valley: | 0.5% (31) |
| Maryland: | 2.5% (64,852) |
Other means:
| Green Valley: | 0.2% (11) |
| Maryland: | 0.6% (14,621) |

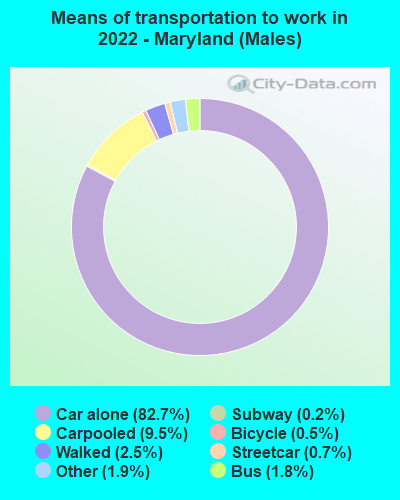
Drove car alone - Males:
| Green Valley: | 89.6% (271) |
| Maryland: | 82.7% (909,901) |
Carpooled - Males:
| Green Valley: | 10.4% (32) |
| Maryland: | 9.5% (115,593) |

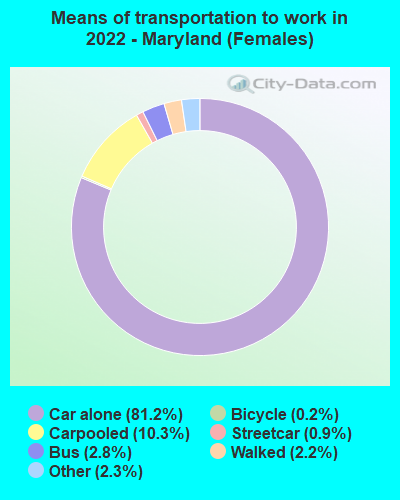
Drove car alone - Females:
| Green Valley: | 97.6% (315) |
| Maryland: | 81.2% (909,901) |
Carpooled - Females:
| Green Valley: | 2.4% (8) |
| Maryland: | 10.3% (115,593) |
Private vehicle occupancy

Drove alone:
| Green Valley: | 93.5% (5,017) |
| Maryland: | 89.2% (2,046,832) |
In 2 person carpool:
| Green Valley: | 4.2% (227) |
| Maryland: | 8.2% (188,419) |
In 3 person carpool:
| Green Valley: | 1.3% (70) |
| Maryland: | 1.6% (36,765) |
In 4 person carpool:
| Green Valley: | 0.3% (16) |
| Maryland: | 0.5% (11,805) |
In 5-6 person carpool:
| Green Valley: | 0.5% (27) |
| Maryland: | 0.4% (8,574) |
In 7+ person carpool:
| Green Valley: | 0.2% (8) |
| Maryland: | 0.1% (3,085) |

Drove alone:
| Green Valley: | 92.8% (5,458) |
| Maryland: | 85.6% (1,910,917) |
In 2 person carpool:
| Green Valley: | 5.7% (333) |
| Maryland: | 11.2% (249,591) |
In 3 person carpool:
| Green Valley: | 1.0% (58) |
| Maryland: | 1.9% (43,068) |
In 4 person carpool:
| Green Valley: | 0.3% (18) |
| Maryland: | 0.7% (15,540) |
In 5-6 person carpool:
| Green Valley: | 0.2% (10) |
| Maryland: | 0.3% (6,773) |
In 7+ person carpool:
| Green Valley: | 0.1% (6) |
| Maryland: | 0.3% (6,020) |
Class of workers
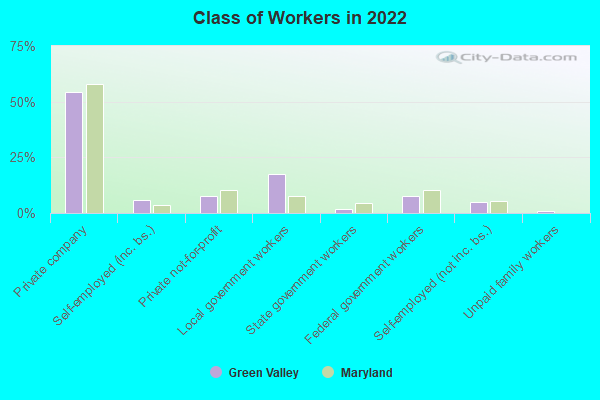
Employee of private company:
| Green Valley: | 54.3% (3,883) |
| Maryland: | 57.9% (1,834,766) |
Self-employed in own incorporated business:
| Green Valley: | 5.8% (417) |
| Maryland: | 3.6% (114,186) |
Private not-for-profit wage and salary workers:
| Green Valley: | 7.4% (530) |
| Maryland: | 10.1% (321,165) |
Local government workers:
| Green Valley: | 17.4% (1,245) |
| Maryland: | 7.7% (243,652) |
State government workers:
| Green Valley: | 1.7% (121) |
| Maryland: | 4.5% (142,830) |
Federal government workers:
| Green Valley: | 7.4% (533) |
| Maryland: | 10.5% (333,930) |
Self-employed workers in own not incorporated business:
| Green Valley: | 5.0% (359) |
| Maryland: | 5.4% (171,588) |
Unpaid family workers:
| Green Valley: | 0.9% (62) |
| Maryland: | 0.2% (6,301) |

Employee of private company:
| Green Valley: | 63.9% (4,041) |
| Maryland: | 60.5% (1,579,238) |
Self-employed in own incorporated business:
| Green Valley: | 6.1% (386) |
| Maryland: | 3.2% (82,204) |
Private not-for-profit wage and salary workers:
| Green Valley: | 3.9% (247) |
| Maryland: | 8.4% (219,162) |
Local government workers:
| Green Valley: | 10.0% (632) |
| Maryland: | 7.9% (204,895) |
State government workers:
| Green Valley: | 1.7% (109) |
| Maryland: | 4.4% (114,670) |
Federal government workers:
| Green Valley: | 9.1% (577) |
| Maryland: | 10.0% (262,046) |
Self-employed workers in own not incorporated business:
| Green Valley: | 5.2% (326) |
| Maryland: | 5.4% (140,769) |
Unpaid family workers:
| Green Valley: | 0.1% (7) |
| Maryland: | 0.2% (5,473) |

Employee of private company - Males:
| Green Valley: | 53.3% (2,132) |
| Maryland: | 62.1% (1,004,780) |
Self-employed in own incorporated business - Males:
| Green Valley: | 5.7% (227) |
| Maryland: | 4.6% (73,780) |
Private not-for-profit wage and salary workers - Males:
| Green Valley: | 6.5% (261) |
| Maryland: | 7.2% (115,680) |
Local government workers - Males:
| Green Valley: | 19.2% (769) |
| Maryland: | 5.3% (85,832) |
State government workers - Males:
| Green Valley: | 1.5% (60) |
| Maryland: | 3.8% (61,646) |
Federal government workers - Males:
| Green Valley: | 8.2% (327) |
| Maryland: | 10.8% (174,115) |
Self-employed workers in own not incorporated business - Males:
| Green Valley: | 4.0% (162) |
| Maryland: | 6.0% (97,677) |
Unpaid family workers - Males:
| Green Valley: | 1.6% (62) |
| Maryland: | 0.2% (3,498) |

Employee of private company - Females:
| Green Valley: | 55.6% (1,751) |
| Maryland: | 53.5% (829,986) |
Self-employed in own incorporated business - Females:
| Green Valley: | 6.0% (190) |
| Maryland: | 2.6% (40,406) |
Private not-for-profit wage and salary workers - Females:
| Green Valley: | 8.5% (269) |
| Maryland: | 13.2% (205,485) |
Local government workers - Females:
| Green Valley: | 15.1% (476) |
| Maryland: | 10.2% (157,820) |
State government workers - Females:
| Green Valley: | 1.9% (61) |
| Maryland: | 5.2% (81,184) |
Federal government workers - Females:
| Green Valley: | 6.5% (206) |
| Maryland: | 10.3% (159,815) |
Self-employed workers in own not incorporated business - Females:
| Green Valley: | 6.3% (197) |
| Maryland: | 4.8% (73,911) |