Work and Jobs in Huntsville, Texas (TX) Detailed Stats
Occupations, Industries, Unemployment, Workers, Commute
Settings
X


Recent posts about work in Huntsville, Texas on our local forum with over 2,400,000 registered users:
 | New job in Huntsville, looking to live in The Woodlands and commute (10 replies) |
| Is Huntsville part of Greater Houston? (24 replies) |
| Job opportunities in Texas (16 replies) |
| Moving to Huntsville - looking for advice (16 replies) |
| Huntsville to Houston (12 replies) |
| Private School Decisions 2022 (115 replies) |
Latest news about work in Huntsville, TX collected exclusively by city-data.com from local newspapers, TV, and radio stations
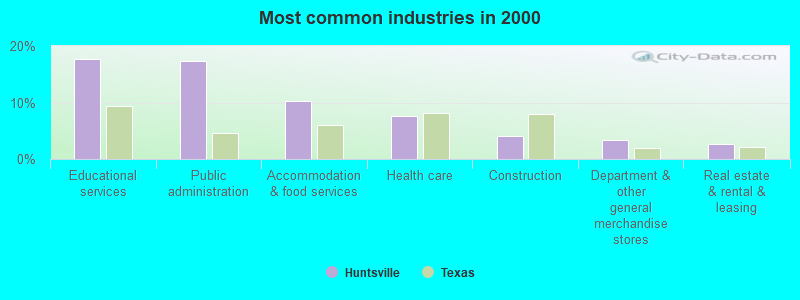
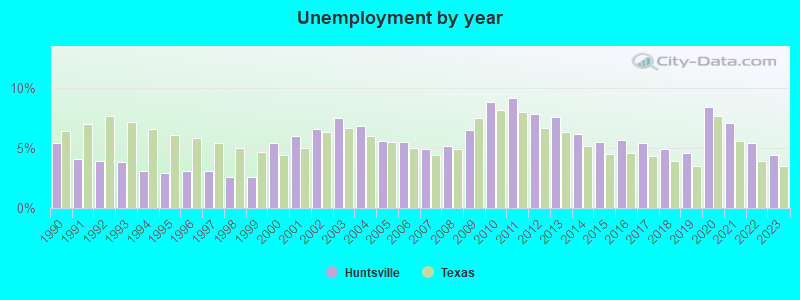
The unemployment rate in 2023 in Huntsville, TX was 4.4%, which was 20.5% greater than the unemployment rate of 3.5% across the entire state of Texas. Compared to the unemployment rate of 7.6% in 2013, this represents a decrease of 72.7%. The most common industries in Huntsville are: Educational services (17.7% of civilian employees), Public administration (17.3% of civilian employees), Accommodation & food services (10.2% of civilian employees). 78.3% of workers work in Walker County and 6.6% of all workers work at home. 55.2% of workers are employees of private companies, which is 26.1% less than the rate of 69.6% across the entire state of Texas.
Whole page based on the data from 2000 / 2022 when the population of Huntsville, Texas was 35,078 / 47,212
Whole page based on the data from 2000 / 2022 when the population of Huntsville, Texas was 35,078 / 47,212
Most common industries
Most common industries | |||
|---|---|---|---|
Industry | All | Males | Females |
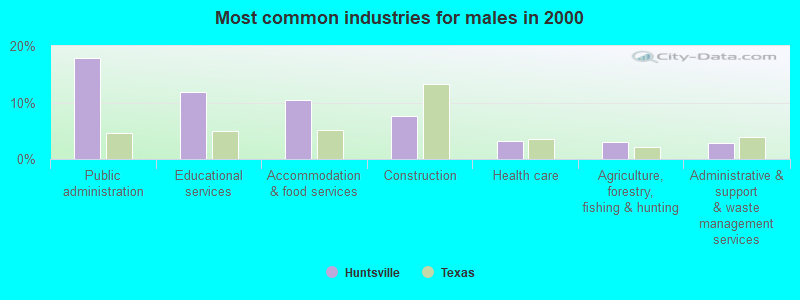
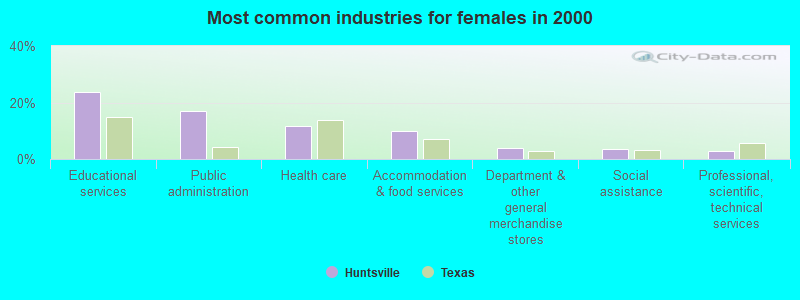
| Educational services | 17.7% (2,219) | 11.9% (741) | 23.6% (1,478) |
| Public administration | 17.3% (2,170) | 17.8% (1,112) | 16.9% (1,058) |
| Accommodation and food services | 10.2% (1,274) | 10.5% (656) | 9.9% (618) |
| Health care | 7.6% (945) | 3.2% (203) | 11.8% (742) |
| Construction | 4.1% (517) | 7.7% (480) | 0.6% (37) |
| Department and other general merchandise stores | 3.3% (418) | 2.8% (176) | 3.9% (242) |
| Real estate and rental and leasing | 2.7% (332) | 2.8% (178) | 2.5% (154) |
| Finance and insurance | 2.3% (293) | 2.6% (164) | 2.1% (129) |
| Professional, scientific, and technical services | 2.3% (288) | 1.6% (101) | 3.0% (187) |
| Administrative and support and waste management services | 2.1% (263) | 2.8% (178) | 1.4% (85) |
| Arts, entertainment, and recreation | 2.1% (262) | 2.6% (164) | 1.6% (98) |
| Social assistance | 2.1% (261) | 0.5% (33) | 3.6% (228) |
| Food and beverage stores | 2.1% (257) | 1.6% (103) | 2.5% (154) |
| Agriculture, forestry, fishing and hunting | 1.9% (241) | 3.1% (193) | 0.8% (48) |
| Religious, grantmaking, civic, professional, and similar organizations | 1.5% (190) | 1.5% (91) | 1.6% (99) |
| Personal and laundry services | 1.5% (183) | 0.6% (37) | 2.3% (146) |
| Wood products | 1.4% (177) | 2.7% (171) | 0.1% (6) |
| Repair and maintenance | 1.2% (150) | 2.0% (127) | 0.4% (23) |
| Clothing and accessories, including shoe, stores | 1.1% (141) | 0.9% (58) | 1.3% (83) |
| Motor vehicle and parts dealers | 1.1% (132) | 1.8% (110) | 0.4% (22) |
| Building material and garden equipment and supplies dealers | 0.9% (117) | 1.4% (85) | 0.5% (32) |
| Metal and metal products | 0.8% (106) | 1.4% (90) | 0.3% (16) |
| Pharmacies and drug stores | 0.8% (103) | 0.6% (37) | 1.1% (66) |
| Truck transportation | 0.8% (95) | 1.3% (84) | 0.2% (11) |
| Other transportation, and support activities, and couriers | 0.8% (95) | 1.2% (78) | 0.3% (17) |
| Publishing, and motion picture and sound recording industries | 0.8% (95) | 0.6% (39) | 0.9% (56) |
| Mining, quarrying, and oil and gas extraction | 0.6% (72) | 1.2% (72) | 0.0% (0) |
| Nonmetallic mineral products | 0.6% (70) | 1.1% (70) | 0.0% (0) |
| Broadcasting and telecommunications | 0.5% (66) | 0.4% (26) | 0.6% (40) |
| Computer and electronic products | 0.5% (64) | 0.7% (45) | 0.3% (19) |
| Radio, TV, and computer stores | 0.5% (61) | 0.7% (42) | 0.3% (19) |
| Gasoline stations | 0.4% (56) | 0.5% (31) | 0.4% (25) |
| Private households | 0.4% (47) | 0.0% (0) | 0.8% (47) |
| Furniture and home furnishings, and household appliance stores | 0.4% (44) | 0.6% (38) | 0.1% (6) |
| Used merchandise, gift, novelty, and souvenir, and other miscellaneous stores | 0.4% (44) | 0.1% (5) | 0.6% (39) |
| Miscellaneous nondurable goods merchant wholesalers | 0.3% (42) | 0.4% (27) | 0.2% (15) |
| Groceries and related products merchant wholesalers | 0.3% (39) | 0.5% (30) | 0.1% (9) |
| Music stores | 0.3% (38) | 0.2% (13) | 0.4% (25) |
| Data processing, libraries, and other information services | 0.3% (36) | 0.1% (6) | 0.5% (30) |
| Machinery | 0.3% (36) | 0.5% (30) | 0.1% (6) |
| Book stores and news dealers | 0.3% (35) | 0.4% (24) | 0.2% (11) |
| Furniture and related product manufacturing | 0.3% (33) | 0.5% (33) | 0.0% (0) |
| Chemicals | 0.3% (32) | 0.5% (32) | 0.0% (0) |
| Other direct selling establishments | 0.2% (29) | 0.4% (23) | 0.1% (6) |
| Miscellaneous manufacturing | 0.2% (28) | 0.3% (21) | 0.1% (7) |
| Food | 0.2% (26) | 0.3% (17) | 0.1% (9) |
| Retail florists | 0.2% (26) | 0.0% (0) | 0.4% (26) |
| Office supplies and stationery stores | 0.2% (23) | 0.0% (0) | 0.4% (23) |
| Petroleum and petroleum products merchant wholesalers | 0.2% (22) | 0.4% (22) | 0.0% (0) |
| Printing and related support activities | 0.2% (20) | 0.1% (4) | 0.3% (16) |
| Utilities | 0.1% (17) | 0.3% (17) | 0.0% (0) |
| Farm supplies merchant wholesalers | 0.1% (17) | 0.1% (7) | 0.2% (10) |
| U. S. Postal service | 0.1% (15) | 0.1% (8) | 0.1% (7) |
| Professional and commercial equipment and supplies merchant wholesalers | 0.1% (15) | 0.1% (9) | 0.1% (6) |
| Electrical and electronic goods merchant wholesalers | 0.1% (15) | 0.1% (7) | 0.1% (8) |
| Paper | 0.1% (14) | 0.2% (14) | 0.0% (0) |
| Plastics and rubber products | 0.1% (14) | 0.2% (14) | 0.0% (0) |
| Lumber and other construction materials merchant wholesalers | 0.1% (10) | 0.2% (10) | 0.0% (0) |
| Machinery, equipment, and supplies merchant wholesalers | 0.1% (10) | 0.2% (10) | 0.0% (0) |
| Sporting goods, camera, and hobby and toy stores | 0.1% (10) | 0.2% (10) | 0.0% (0) |
| Motor vehicles, parts and supplies merchant wholesalers | 0.1% (9) | 0.1% (9) | 0.0% (0) |
| Recyclable material merchant wholesalers | 0.1% (9) | 0.1% (9) | 0.0% (0) |
| Drugs, sundries, and chemical and allied products merchant wholesalers | 0.1% (8) | 0.1% (8) | 0.0% (0) |
| Metals and minerals, except petroleum, merchant wholesalers | 0.1% (8) | 0.1% (8) | 0.0% (0) |
Unemployment in Huntsville
- Unemployment by race in 2022
- Unemployment rate for White non-Hispanic residents
- 15.0%Males
- 9.8%Females
- Unemployment rate for Black residents
- 22.2%Males
- 15.4%Females
- Unemployment rate for other race residents
- 16.8%Females
- Unemployment rate for two or more race residents
- 15.3%Males
- 6.0%Females
- Unemployment rate for Hispanic or Latino residents
- 5.6%Males
- 3.8%Females
- Unemployment by race in 2000
- Unemployment rate for White non-Hispanic residents
- 10.4%Males
- 8.1%Females
- Unemployment rate for Black residents
- 22.2%Males
- 14.7%Females
- Unemployment rate for Asian residents
- 20.0%Males
- Unemployment rate for other race residents
- 14.4%Males
- 4.1%Females
- Unemployment rate for two or more race residents
- 29.3%Males
- 26.6%Females
- Unemployment rate for Hispanic or Latino residents
- 13.5%Males
- 12.4%Females
Unemployment in 2023:
| Huntsville: | 4.4% |
| Texas: | 3.5% |
Unemployment in 2022:
| Huntsville: | 5.4% |
| Texas: | 3.9% |
Unemployment in 2021:
| Huntsville: | 7.1% |
| Texas: | 5.6% |
Unemployment in 2020:
| Huntsville: | 8.4% |
| Texas: | 7.7% |
Unemployment in 2019:
| Huntsville: | 4.6% |
| Texas: | 3.5% |
Unemployment in 2018:
| Huntsville: | 4.9% |
| Texas: | 3.9% |
Unemployment in 2017:
| Huntsville: | 5.4% |
| Texas: | 4.3% |
Unemployment in 2016:
| Huntsville: | 5.7% |
| Texas: | 4.6% |
Unemployment in 2015:
| Huntsville: | 5.5% |
| Texas: | 4.5% |
Unemployment in 2014:
| Huntsville: | 6.2% |
| Texas: | 5.2% |
Unemployment in 2013:
| Huntsville: | 7.6% |
| Texas: | 6.3% |
Unemployment in 2012:
| Huntsville: | 7.8% |
| Texas: | 6.7% |
Unemployment in 2011:
| Huntsville: | 9.2% |
| Texas: | 8.0% |
Unemployment in 2010:
| Huntsville: | 8.8% |
| Texas: | 8.2% |
Unemployment in 2009:
| Huntsville: | 6.5% |
| Texas: | 7.5% |
Unemployment in 2008:
| Huntsville: | 5.2% |
| Texas: | 4.9% |
Unemployment in 2007:
| Huntsville: | 4.9% |
| Texas: | 4.4% |
Unemployment in 2006:
| Huntsville: | 5.5% |
| Texas: | 5.0% |
Unemployment in 2005:
| Huntsville: | 5.6% |
| Texas: | 5.5% |
Unemployment in 2004:
| Huntsville: | 6.8% |
| Texas: | 6.0% |
Unemployment in 2003:
| Huntsville: | 7.5% |
| Texas: | 6.7% |
Unemployment in 2002:
| Huntsville: | 6.6% |
| Texas: | 6.3% |
Unemployment in 2001:
| Huntsville: | 6.0% |
| Texas: | 5.0% |
Unemployment in 2000:
| Huntsville: | 5.4% |
| Texas: | 4.4% |
Unemployment in 1999:
| Huntsville: | 2.6% |
| Texas: | 4.7% |
Unemployment in 1998:
| Huntsville: | 2.6% |
| Texas: | 5.0% |
Unemployment in 1997:
| Huntsville: | 3.1% |
| Texas: | 5.4% |
Unemployment in 1996:
| Huntsville: | 3.1% |
| Texas: | 5.8% |
Unemployment in 1995:
| Huntsville: | 2.9% |
| Texas: | 6.1% |
Unemployment in 1994:
| Huntsville: | 3.1% |
| Texas: | 6.6% |
Unemployment in 1993:
| Huntsville: | 3.8% |
| Texas: | 7.2% |
Unemployment in 1992:
| Huntsville: | 3.9% |
| Texas: | 7.7% |
Unemployment in 1991:
| Huntsville: | 4.1% |
| Texas: | 7.0% |
Unemployment in 1990:
| Huntsville: | 5.4% |
| Texas: | 6.4% |
Time leaving home to go to work
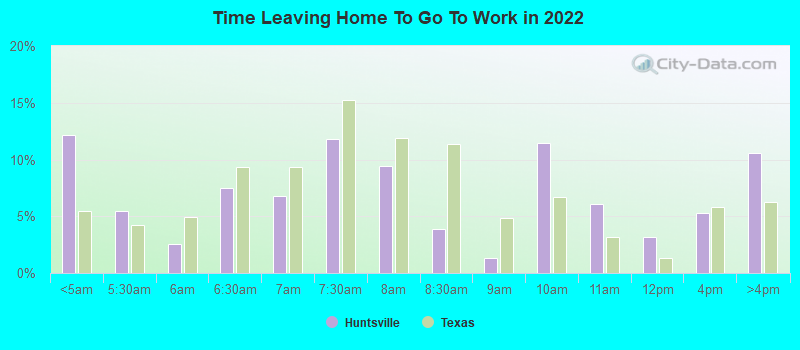
12:00 a.m. to 4:59 a.m.:
| Huntsville: | 12.2% (1,864) |
| Texas: | 5.5% (678,264) |
5:00 a.m. to 5:29 a.m.:
| Huntsville: | 5.4% (830) |
| Texas: | 4.3% (525,841) |
5:30 a.m. to 5:59 a.m.:
| Huntsville: | 2.6% (392) |
| Texas: | 4.9% (603,953) |
6:00 a.m. to 6:29 a.m.:
| Huntsville: | 7.5% (1,150) |
| Texas: | 9.4% (1,155,020) |
6:30 a.m. to 6:59 a.m.:
| Huntsville: | 6.7% (1,031) |
| Texas: | 9.3% (1,152,822) |
7:00 a.m. to 7:29 a.m.:
| Huntsville: | 11.8% (1,800) |
| Texas: | 15.3% (1,885,477) |
7:30 a.m. to 7:59 a.m.:
| Huntsville: | 9.4% (1,437) |
| Texas: | 11.9% (1,469,628) |
8:00 a.m. to 8:29 a.m.:
| Huntsville: | 3.9% (591) |
| Texas: | 11.3% (1,400,175) |
8:30 a.m. to 8:59 a.m.:
| Huntsville: | 1.3% (199) |
| Texas: | 4.9% (599,574) |
9:00 a.m. to 9:59 a.m.:
| Huntsville: | 11.4% (1,747) |
| Texas: | 6.7% (829,367) |
10:00 a.m. to 10:59 a.m.:
| Huntsville: | 6.1% (926) |
| Texas: | 3.2% (390,354) |
11:00 a.m. to 11:59 a.m.:
| Huntsville: | 3.2% (483) |
| Texas: | 1.3% (162,330) |
12:00 p.m. to 3:59 p.m.:
| Huntsville: | 5.3% (804) |
| Texas: | 5.8% (720,594) |
4:00 p.m. to 11:59 p.m.:
| Huntsville: | 10.5% (1,611) |
| Texas: | 6.3% (777,072) |

<5am:
| Huntsville: | 3.1% (378) |
| Texas: | 3.1% (281,361) |
5:30am:
| Huntsville: | 2.0% (248) |
| Texas: | 2.9% (262,060) |
6am:
| Huntsville: | 3.6% (443) |
| Texas: | 4.4% (403,423) |
6:30am:
| Huntsville: | 6.1% (746) |
| Texas: | 8.8% (808,876) |
7am:
| Huntsville: | 7.9% (961) |
| Texas: | 10.7% (976,557) |
7:30am:
| Huntsville: | 12.1% (1,471) |
| Texas: | 16.4% (1,500,904) |
8am:
| Huntsville: | 17.6% (2,146) |
| Texas: | 16.8% (1,536,308) |
8:30am:
| Huntsville: | 8.7% (1,062) |
| Texas: | 10.0% (913,601) |
9am:
| Huntsville: | 3.3% (405) |
| Texas: | 4.4% (398,656) |
10am:
| Huntsville: | 5.0% (612) |
| Texas: | 5.2% (472,592) |
11am:
| Huntsville: | 3.9% (480) |
| Texas: | 2.2% (197,844) |
12pm:
| Huntsville: | 2.0% (242) |
| Texas: | 0.9% (86,997) |
4pm:
| Huntsville: | 13.8% (1,685) |
| Texas: | 5.5% (503,565) |
>4pm:
| Huntsville: | 9.2% (1,127) |
| Texas: | 6.1% (563,107) |

12:00 a.m. to 4:59 a.m. - Males:
| Huntsville: | 18.4% (1,362) |
| Texas: | 7.0% (477,284) |
5:00 a.m. to 5:29 a.m. - Males:
| Huntsville: | 7.5% (557) |
| Texas: | 5.8% (394,876) |
5:30 a.m. to 5:59 a.m. - Males:
| Huntsville: | 1.8% (134) |
| Texas: | 5.9% (402,788) |
6:00 a.m. to 6:29 a.m. - Males:
| Huntsville: | 10.8% (798) |
| Texas: | 10.9% (751,118) |
6:30 a.m. to 6:59 a.m. - Males:
| Huntsville: | 5.9% (436) |
| Texas: | 9.5% (652,306) |
7:00 a.m. to 7:29 a.m. - Males:
| Huntsville: | 9.4% (692) |
| Texas: | 14.1% (970,598) |
7:30 a.m. to 7:59 a.m. - Males:
| Huntsville: | 7.7% (566) |
| Texas: | 10.2% (696,429) |
8:00 a.m. to 8:29 a.m. - Males:
| Huntsville: | 4.8% (358) |
| Texas: | 10.6% (729,041) |
8:30 a.m. to 8:59 a.m. - Males:
| Huntsville: | 2.4% (177) |
| Texas: | 4.1% (281,762) |
9:00 a.m. to 9:59 a.m. - Males:
| Huntsville: | 7.7% (571) |
| Texas: | 5.8% (401,071) |
10:00 a.m. to 10:59 a.m. - Males:
| Huntsville: | 4.2% (308) |
| Texas: | 2.7% (186,469) |
11:00 a.m. to 11:59 a.m. - Males:
| Huntsville: | 6.7% (499) |
| Texas: | 1.2% (82,242) |
12:00 p.m. to 3:59 p.m. - Males:
| Huntsville: | 11.3% (834) |
| Texas: | 5.8% (397,795) |
4:00 p.m. to 11:59 p.m. - Males:
| Huntsville: | 9.5% (704) |
| Texas: | 6.4% (435,950) |

12:00 a.m. to 4:59 a.m. - Females:
| Huntsville: | 2.5% (202) |
| Texas: | 3.7% (200,980) |
5:00 a.m. to 5:29 a.m. - Females:
| Huntsville: | 3.2% (262) |
| Texas: | 2.4% (130,965) |
5:30 a.m. to 5:59 a.m. - Females:
| Huntsville: | 2.9% (238) |
| Texas: | 3.7% (201,165) |
6:00 a.m. to 6:29 a.m. - Females:
| Huntsville: | 4.3% (347) |
| Texas: | 7.4% (403,902) |
6:30 a.m. to 6:59 a.m. - Females:
| Huntsville: | 7.3% (594) |
| Texas: | 9.1% (500,516) |
7:00 a.m. to 7:29 a.m. - Females:
| Huntsville: | 14.1% (1,140) |
| Texas: | 16.7% (914,879) |
7:30 a.m. to 7:59 a.m. - Females:
| Huntsville: | 9.6% (779) |
| Texas: | 14.1% (773,199) |
8:00 a.m. to 8:29 a.m. - Females:
| Huntsville: | 2.9% (234) |
| Texas: | 12.2% (671,134) |
8:30 a.m. to 8:59 a.m. - Females:
| Huntsville: | 0.6% (47) |
| Texas: | 5.8% (317,812) |
9:00 a.m. to 9:59 a.m. - Females:
| Huntsville: | 6.8% (554) |
| Texas: | 7.8% (428,296) |
10:00 a.m. to 10:59 a.m. - Females:
| Huntsville: | 10.6% (856) |
| Texas: | 3.7% (203,885) |
11:00 a.m. to 11:59 a.m. - Females:
| Huntsville: | 2.8% (228) |
| Texas: | 1.5% (80,088) |
12:00 p.m. to 3:59 p.m. - Females:
| Huntsville: | 7.3% (590) |
| Texas: | 5.9% (322,799) |
4:00 p.m. to 11:59 p.m. - Females:
| Huntsville: | 11.1% (901) |
| Texas: | 6.2% (341,122) |
Travel time to work
Percentage of workers working in this county: 78.3%
Number of people working at home: 1,160 (6.6% of all workers)
Daytime population change due to commuting: +6,094 (+17.4%)
Workers who live and work in this city: 8,883 (72.9%)
Number of people working at home: 1,160 (6.6% of all workers)
Daytime population change due to commuting: +6,094 (+17.4%)
Workers who live and work in this city: 8,883 (72.9%)

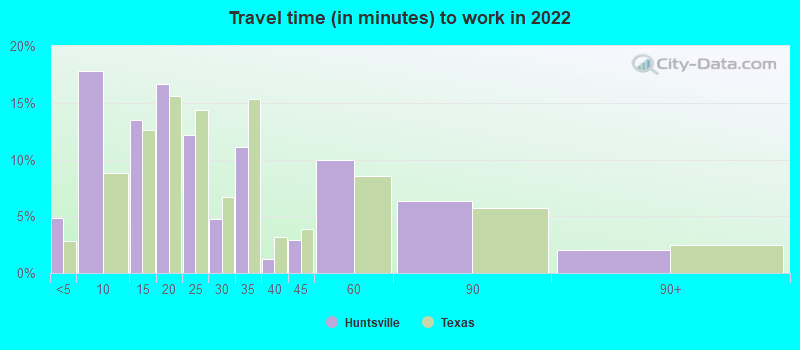

Less than 5 minutes:
| Huntsville: | 4.8% (1,046) |
| Texas: | 2.8% (350,462) |
5 to 9 minutes:
| Huntsville: | 17.8% (3,877) |
| Texas: | 8.8% (1,087,762) |
10 to 14 minutes:
| Huntsville: | 13.5% (2,936) |
| Texas: | 12.6% (1,550,271) |
15 to 19 minutes:
| Huntsville: | 16.7% (3,624) |
| Texas: | 15.6% (1,918,353) |
20 to 24 minutes:
| Huntsville: | 12.2% (2,649) |
| Texas: | 14.4% (1,772,079) |
25 to 29 minutes:
| Huntsville: | 4.7% (1,029) |
| Texas: | 6.7% (827,833) |
30 to 34 minutes:
| Huntsville: | 11.1% (2,418) |
| Texas: | 15.3% (1,887,878) |
35 to 39 minutes:
| Huntsville: | 1.2% (267) |
| Texas: | 3.2% (394,170) |
40 to 44 minutes:
| Huntsville: | 2.9% (630) |
| Texas: | 3.9% (476,118) |
45 to 59 minutes:
| Huntsville: | 10.0% (2,174) |
| Texas: | 8.6% (1,058,376) |
60 to 89 minutes:
| Huntsville: | 6.3% (1,370) |
| Texas: | 5.7% (706,002) |
90 or more minutes:
| Huntsville: | 2.0% (433) |
| Texas: | 2.4% (299,884) |


Less than 5 minutes:
| Huntsville: | 6.4% (775) |
| Texas: | 3.0% (277,642) |
5 to 9 minutes:
| Huntsville: | 27.4% (3,341) |
| Texas: | 10.3% (942,891) |
10 to 14 minutes:
| Huntsville: | 20.3% (2,469) |
| Texas: | 14.4% (1,317,555) |
15 to 19 minutes:
| Huntsville: | 15.3% (1,861) |
| Texas: | 16.0% (1,467,945) |
20 to 24 minutes:
| Huntsville: | 5.4% (660) |
| Texas: | 13.9% (1,276,781) |
25 to 29 minutes:
| Huntsville: | 3.1% (373) |
| Texas: | 5.3% (482,838) |
30 to 34 minutes:
| Huntsville: | 9.3% (1,138) |
| Texas: | 14.3% (1,309,699) |
35 to 39 minutes:
| Huntsville: | 0.9% (114) |
| Texas: | 2.4% (219,873) |
40 to 44 minutes:
| Huntsville: | 1.0% (122) |
| Texas: | 3.1% (280,916) |
45 to 59 minutes:
| Huntsville: | 3.6% (442) |
| Texas: | 7.6% (692,006) |
60 to 89 minutes:
| Huntsville: | 3.1% (383) |
| Texas: | 4.6% (418,905) |
90 or more minutes:
| Huntsville: | 2.7% (328) |
| Texas: | 2.4% (218,800) |

Less than 5 minutes - Males:
| Huntsville: | 3.1% (319) |
| Texas: | 2.7% (181,937) |
5 to 9 minutes - Males:
| Huntsville: | 9.9% (1,028) |
| Texas: | 7.6% (522,166) |
10 to 14 minutes - Males:
| Huntsville: | 15.6% (1,626) |
| Texas: | 11.5% (785,572) |
15 to 19 minutes - Males:
| Huntsville: | 14.1% (1,465) |
| Texas: | 14.6% (1,001,179) |
20 to 24 minutes - Males:
| Huntsville: | 19.7% (2,051) |
| Texas: | 13.9% (950,043) |
25 to 29 minutes - Males:
| Huntsville: | 6.1% (633) |
| Texas: | 6.7% (457,259) |
30 to 34 minutes - Males:
| Huntsville: | 15.4% (1,603) |
| Texas: | 16.2% (1,110,357) |
35 to 39 minutes - Males:
| Huntsville: | 4.4% (459) |
| Texas: | 3.3% (223,512) |
40 to 44 minutes - Males:
| Huntsville: | 2.3% (244) |
| Texas: | 4.2% (289,434) |
45 to 59 minutes - Males:
| Huntsville: | 12.4% (1,297) |
| Texas: | 9.3% (639,122) |
60 to 89 minutes - Males:
| Huntsville: | 9.6% (996) |
| Texas: | 6.8% (467,154) |
90 or more minutes - Males:
| Huntsville: | 1.0% (108) |
| Texas: | 3.1% (211,313) |

Less than 5 minutes - Females:
| Huntsville: | 1.8% (201) |
| Texas: | 3.1% (168,525) |
5 to 9 minutes - Females:
| Huntsville: | 25.6% (2,930) |
| Texas: | 10.3% (565,596) |
10 to 14 minutes - Females:
| Huntsville: | 11.4% (1,304) |
| Texas: | 13.9% (764,699) |
15 to 19 minutes - Females:
| Huntsville: | 19.8% (2,263) |
| Texas: | 16.7% (917,174) |
20 to 24 minutes - Females:
| Huntsville: | 17.2% (1,967) |
| Texas: | 15.0% (822,036) |
25 to 29 minutes - Females:
| Huntsville: | 3.5% (397) |
| Texas: | 6.7% (370,574) |
30 to 34 minutes - Females:
| Huntsville: | 17.2% (1,966) |
| Texas: | 14.2% (777,521) |
35 to 39 minutes - Females:
| Huntsville: | 1.2% (138) |
| Texas: | 3.1% (170,658) |
40 to 44 minutes - Females:
| Huntsville: | 2.0% (225) |
| Texas: | 3.4% (186,684) |
45 to 59 minutes - Females:
| Huntsville: | 7.6% (875) |
| Texas: | 7.6% (419,254) |
60 to 89 minutes - Females:
| Huntsville: | 3.3% (376) |
| Texas: | 4.4% (238,848) |
90 or more minutes - Females:
| Huntsville: | 3.0% (342) |
| Texas: | 1.6% (88,571) |
Means of transportation to work
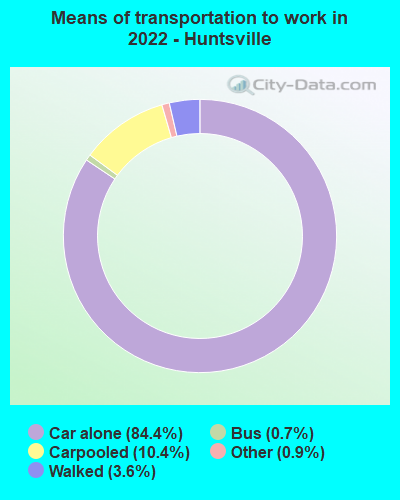

Drove car alone:
| Huntsville: | 84.4% (21,272) |
| Texas: | 83.3% (4,557,023) |
Carpooled:
| Huntsville: | 10.4% (2,614) |
| Texas: | 11.7% (674,818) |
Bus:
| Huntsville: | 0.7% (189) |
| Texas: | 0.9% (50,435) |
Bicycle:
| Huntsville: | 0.0% (9) |
| Texas: | 0.2% (7,954) |
Walked:
| Huntsville: | 3.6% (901) |
| Texas: | 1.7% (99,911) |
Other means:
| Huntsville: | 0.9% (220) |
| Texas: | 2.0% (95,481) |


Drove car alone:
| Huntsville: | 77.2% (9,405) |
| Texas: | 77.7% (7,115,590) |
Carpooled:
| Huntsville: | 15.6% (1,895) |
| Texas: | 14.5% (1,326,012) |
Bus or trolley bus:
| Huntsville: | 0.2% (24) |
| Texas: | 1.7% (157,014) |
Taxicab:
| Huntsville: | 0.1% (12) |
| Texas: | 0.1% (6,102) |
Motorcycle:
| Huntsville: | 0.2% (28) |
| Texas: | 0.1% (12,068) |
Bicycle:
| Huntsville: | 0.3% (34) |
| Texas: | 0.2% (21,551) |
Walked:
| Huntsville: | 4.1% (498) |
| Texas: | 1.9% (173,670) |
Other means:
| Huntsville: | 0.9% (110) |
| Texas: | 0.9% (86,692) |


Drove car alone - Males:
| Huntsville: | 81.7% (10,462) |
| Texas: | 83.6% (4,557,023) |
Carpooled - Males:
| Huntsville: | 12.9% (1,646) |
| Texas: | 11.2% (674,818) |
Bus - Males:
| Huntsville: | 0.1% (10) |
| Texas: | 0.8% (50,435) |
Bicycle - Males:
| Huntsville: | 0.1% (9) |
| Texas: | 0.3% (7,954) |
Walked - Males:
| Huntsville: | 3.8% (485) |
| Texas: | 1.7% (99,911) |
Other means - Males:
| Huntsville: | 1.5% (193) |
| Texas: | 2.2% (95,481) |


Drove car alone - Females:
| Huntsville: | 87.2% (10,823) |
| Texas: | 83.0% (4,557,023) |
Carpooled - Females:
| Huntsville: | 7.8% (966) |
| Texas: | 12.3% (674,818) |
Bus - Females:
| Huntsville: | 1.4% (180) |
| Texas: | 0.9% (50,435) |
Walked - Females:
| Huntsville: | 3.4% (416) |
| Texas: | 1.8% (99,911) |
Other means - Females:
| Huntsville: | 0.2% (26) |
| Texas: | 1.7% (95,481) |
Private vehicle occupancy

Drove alone:
| Huntsville: | 91.3% (13,290) |
| Texas: | 87.6% (10,283,021) |
In 2 person carpool:
| Huntsville: | 7.6% (1,109) |
| Texas: | 9.0% (1,052,595) |
In 3 person carpool:
| Huntsville: | 0.3% (43) |
| Texas: | 2.1% (244,139) |
In 4 person carpool:
| Huntsville: | 0.4% (59) |
| Texas: | 0.8% (92,732) |

Drove alone:
| Huntsville: | 83.2% (9,405) |
| Texas: | 84.3% (7,115,590) |
In 2 person carpool:
| Huntsville: | 12.0% (1,353) |
| Texas: | 11.6% (982,994) |
In 3 person carpool:
| Huntsville: | 3.0% (338) |
| Texas: | 2.4% (201,602) |
In 4 person carpool:
| Huntsville: | 1.1% (122) |
| Texas: | 1.0% (83,518) |
In 5-6 person carpool:
| Huntsville: | 0.7% (82) |
| Texas: | 0.5% (40,662) |
Class of workers
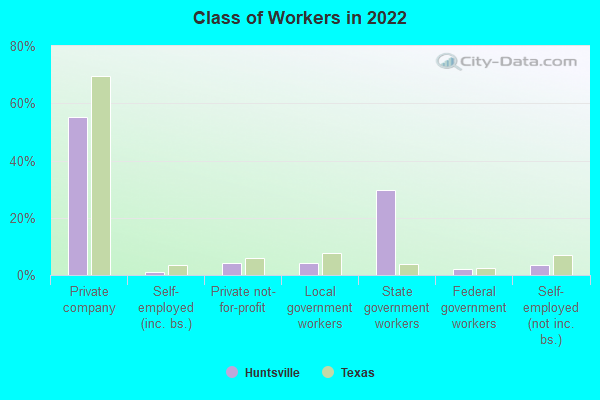
Employee of private company:
| Huntsville: | 55.2% (10,213) |
| Texas: | 69.6% (10,139,666) |
Self-employed in own incorporated business:
| Huntsville: | 0.9% (175) |
| Texas: | 3.5% (516,446) |
Private not-for-profit wage and salary workers:
| Huntsville: | 4.2% (786) |
| Texas: | 6.0% (870,454) |
Local government workers:
| Huntsville: | 4.3% (799) |
| Texas: | 7.6% (1,109,799) |
State government workers:
| Huntsville: | 29.7% (5,499) |
| Texas: | 3.8% (558,618) |
Federal government workers:
| Huntsville: | 2.0% (371) |
| Texas: | 2.5% (357,298) |
Self-employed workers in own not incorporated business:
| Huntsville: | 3.6% (661) |
| Texas: | 6.8% (998,270) |
Unpaid family workers:
| Huntsville: | 0.1% (14) |
| Texas: | 0.2% (27,882) |

Employee of private company:
| Huntsville: | 51.8% (6,487) |
| Texas: | 69.6% (6,425,274) |
Self-employed in own incorporated business:
| Huntsville: | 1.6% (203) |
| Texas: | 2.7% (250,864) |
Private not-for-profit wage and salary workers:
| Huntsville: | 5.6% (695) |
| Texas: | 5.7% (526,631) |
Local government workers:
| Huntsville: | 7.2% (902) |
| Texas: | 6.6% (608,479) |
State government workers:
| Huntsville: | 26.8% (3,355) |
| Texas: | 5.4% (501,082) |
Federal government workers:
| Huntsville: | 1.0% (127) |
| Texas: | 2.6% (237,177) |
Self-employed workers in own not incorporated business:
| Huntsville: | 5.6% (697) |
| Texas: | 7.1% (653,527) |
Unpaid family workers:
| Huntsville: | 0.4% (49) |
| Texas: | 0.3% (31,338) |

Employee of private company - Males:
| Huntsville: | 55.5% (5,516) |
| Texas: | 73.1% (5,788,450) |
Self-employed in own incorporated business - Males:
| Huntsville: | 1.0% (97) |
| Texas: | 4.2% (332,655) |
Private not-for-profit wage and salary workers - Males:
| Huntsville: | 2.8% (276) |
| Texas: | 4.1% (323,476) |
Local government workers - Males:
| Huntsville: | 5.5% (543) |
| Texas: | 5.1% (405,467) |
State government workers - Males:
| Huntsville: | 29.7% (2,948) |
| Texas: | 3.0% (236,706) |
Federal government workers - Males:
| Huntsville: | 1.7% (168) |
| Texas: | 2.7% (211,629) |
Self-employed workers in own not incorporated business - Males:
| Huntsville: | 3.8% (379) |
| Texas: | 7.7% (609,246) |
Unpaid family workers - Males:
| Huntsville: | 0.1% (14) |
| Texas: | 0.2% (12,606) |

Employee of private company - Females:
| Huntsville: | 54.8% (4,697) |
| Texas: | 65.4% (4,351,216) |
Self-employed in own incorporated business - Females:
| Huntsville: | 0.9% (79) |
| Texas: | 2.8% (183,791) |
Private not-for-profit wage and salary workers - Females:
| Huntsville: | 5.9% (510) |
| Texas: | 8.2% (546,978) |
Local government workers - Females:
| Huntsville: | 3.0% (256) |
| Texas: | 10.6% (704,332) |
State government workers - Females:
| Huntsville: | 29.7% (2,551) |
| Texas: | 4.8% (321,912) |
Federal government workers - Females:
| Huntsville: | 2.4% (203) |
| Texas: | 2.2% (145,669) |
Self-employed workers in own not incorporated business - Females:
| Huntsville: | 3.3% (282) |
| Texas: | 5.8% (389,024) |