Work and Jobs in Hyde Park, New York (NY) Detailed Stats
Occupations, Industries, Unemployment, Workers, Commute
Settings
X


Recent posts about work in Hyde Park, New York on our local forum with over 2,400,000 registered users:
 | Upstate NY job openings...... (1437 replies) |
| Houses in New Hyde Park (39 replies) |
| Up to $850K in Nassau.... (263 replies) |
| For those interested in Technology and Economic activity in Upstate NY... (2824 replies) |
| Commuting to Work from New Hyde Park Road School (7 replies) |
| KEW GARDENS vs. BRIARWOOD (QUEENS, NY)-Which is better to live? (25 replies) |
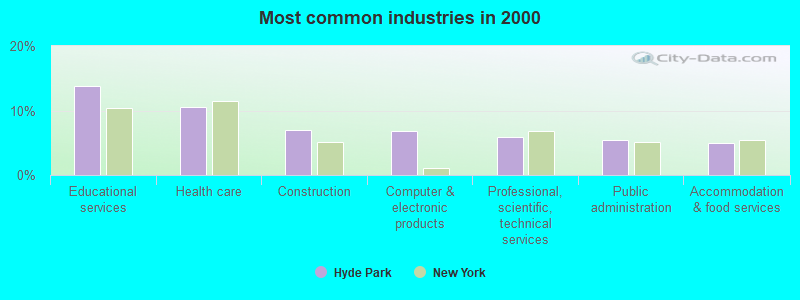
The most common industries in Hyde Park are: Educational services (13.7% of civilian employees), Health care (10.6% of civilian employees), Construction (7.0% of civilian employees). 59.4% of workers are employees of private companies, which is 7.2% less than the rate of 63.7% across the entire state of New York.
Most common industries
Most common industries | |||
|---|---|---|---|
Industry | All | Males | Females |
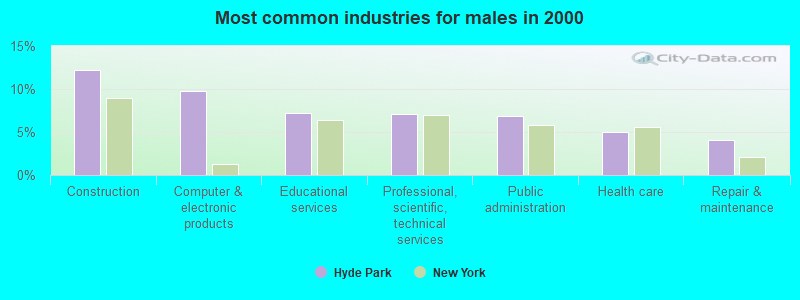
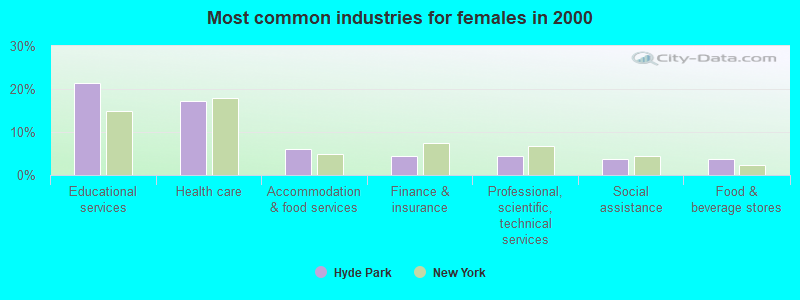
| Educational services | 13.7% (1,328) | 7.3% (378) | 21.3% (950) |
| Health care | 10.6% (1,020) | 5.0% (258) | 17.1% (762) |
| Construction | 7.0% (679) | 12.2% (636) | 1.0% (43) |
| Computer and electronic products | 6.8% (657) | 9.7% (506) | 3.4% (151) |
| Professional, scientific, and technical services | 5.8% (564) | 7.1% (371) | 4.3% (193) |
| Public administration | 5.4% (526) | 6.9% (360) | 3.7% (166) |
| Accommodation and food services | 4.9% (475) | 3.9% (202) | 6.1% (273) |
| Finance and insurance | 3.6% (345) | 2.8% (147) | 4.4% (198) |
| Administrative and support and waste management services | 3.4% (327) | 3.2% (169) | 3.5% (158) |
| Food and beverage stores | 3.2% (305) | 2.6% (137) | 3.8% (168) |
| Arts, entertainment, and recreation | 2.4% (236) | 2.8% (148) | 2.0% (88) |
| Repair and maintenance | 2.4% (235) | 4.0% (209) | 0.6% (26) |
| Social assistance | 2.4% (232) | 1.2% (62) | 3.8% (170) |
| Department and other general merchandise stores | 1.9% (182) | 1.5% (80) | 2.3% (102) |
| Motor vehicle and parts dealers | 1.4% (137) | 2.4% (127) | 0.2% (10) |
| Religious, grantmaking, civic, professional, and similar organizations | 1.4% (135) | 1.0% (51) | 1.9% (84) |
| Broadcasting and telecommunications | 1.3% (124) | 2.1% (108) | 0.4% (16) |
| Utilities | 1.3% (123) | 2.2% (112) | 0.2% (11) |
| Personal and laundry services | 1.2% (119) | 0.0% (0) | 2.7% (119) |
| Pharmacies and drug stores | 1.2% (115) | 1.3% (67) | 1.1% (48) |
| Building material and garden equipment and supplies dealers | 1.1% (106) | 0.8% (44) | 1.4% (62) |
| Other transportation, and support activities, and couriers | 1.1% (103) | 1.1% (58) | 1.0% (45) |
| Real estate and rental and leasing | 1.0% (101) | 1.2% (62) | 0.9% (39) |
| Used merchandise, gift, novelty, and souvenir, and other miscellaneous stores | 1.0% (96) | 0.4% (19) | 1.7% (77) |
| Publishing, and motion picture and sound recording industries | 0.9% (91) | 0.8% (43) | 1.1% (48) |
| Metal and metal products | 0.9% (86) | 0.9% (46) | 0.9% (40) |
| Printing and related support activities | 0.9% (85) | 0.9% (49) | 0.8% (36) |
| U. S. Postal service | 0.9% (84) | 1.1% (58) | 0.6% (26) |
| Furniture and home furnishings, and household appliance stores | 0.7% (66) | 0.6% (33) | 0.7% (33) |
| Food | 0.7% (63) | 0.7% (38) | 0.6% (25) |
| Radio, TV, and computer stores | 0.6% (58) | 0.8% (40) | 0.4% (18) |
| Miscellaneous manufacturing | 0.5% (51) | 0.9% (46) | 0.1% (5) |
| Data processing, libraries, and other information services | 0.5% (49) | 0.3% (18) | 0.7% (31) |
| Motor vehicles, parts and supplies merchant wholesalers | 0.4% (38) | 0.4% (21) | 0.4% (17) |
| Wood products | 0.4% (36) | 0.5% (24) | 0.3% (12) |
| Gasoline stations | 0.4% (35) | 0.7% (35) | 0.0% (0) |
| Health and personal care, except drug, stores | 0.4% (34) | 0.3% (18) | 0.4% (16) |
| Vending machine operators | 0.3% (33) | 0.6% (33) | 0.0% (0) |
| Sporting goods, camera, and hobby and toy stores | 0.3% (32) | 0.4% (20) | 0.3% (12) |
| Machinery, equipment, and supplies merchant wholesalers | 0.3% (30) | 0.2% (8) | 0.5% (22) |
| Machinery | 0.3% (29) | 0.6% (29) | 0.0% (0) |
| Hardware, plumbing and heating equipment, and supplies merchant wholesalers | 0.3% (29) | 0.4% (21) | 0.2% (8) |
| Groceries and related products merchant wholesalers | 0.3% (28) | 0.2% (11) | 0.4% (17) |
| Clothing and accessories, including shoe, stores | 0.3% (25) | 0.2% (9) | 0.4% (16) |
| Retail florists | 0.2% (24) | 0.1% (5) | 0.4% (19) |
| Furniture and related product manufacturing | 0.2% (24) | 0.5% (24) | 0.0% (0) |
| Other direct selling establishments | 0.2% (24) | 0.4% (19) | 0.1% (5) |
| Electrical equipment, appliances, and components | 0.2% (22) | 0.0% (2) | 0.4% (20) |
| Petroleum and petroleum products merchant wholesalers | 0.2% (21) | 0.4% (21) | 0.0% (0) |
| Office supplies and stationery stores | 0.2% (20) | 0.4% (20) | 0.0% (0) |
| Miscellaneous nondurable goods merchant wholesalers | 0.2% (19) | 0.0% (0) | 0.4% (19) |
| Electrical and electronic goods merchant wholesalers | 0.2% (19) | 0.3% (14) | 0.1% (5) |
| Drugs, sundries, and chemical and allied products merchant wholesalers | 0.2% (18) | 0.3% (18) | 0.0% (0) |
| Rail transportation | 0.2% (17) | 0.3% (17) | 0.0% (0) |
| Plastics and rubber products | 0.2% (16) | 0.2% (10) | 0.1% (6) |
| Book stores and news dealers | 0.2% (16) | 0.1% (7) | 0.2% (9) |
| Agriculture, forestry, fishing and hunting | 0.2% (15) | 0.3% (15) | 0.0% (0) |
| Chemicals | 0.2% (15) | 0.1% (7) | 0.2% (8) |
| Mining, quarrying, and oil and gas extraction | 0.1% (14) | 0.3% (14) | 0.0% (0) |
| Professional and commercial equipment and supplies merchant wholesalers | 0.1% (12) | 0.2% (12) | 0.0% (0) |
| Water transportation | 0.1% (11) | 0.2% (11) | 0.0% (0) |
| Nonmetallic mineral products | 0.1% (10) | 0.2% (10) | 0.0% (0) |
| Beverage and tobacco products | 0.1% (10) | 0.2% (10) | 0.0% (0) |
| Recyclable material merchant wholesalers | 0.1% (9) | 0.2% (9) | 0.0% (0) |
| Lumber and other construction materials merchant wholesalers | 0.1% (9) | 0.2% (9) | 0.0% (0) |
| Electronic shopping and mail-order houses | 0.1% (7) | 0.1% (7) | 0.0% (0) |
| Truck transportation | 0.1% (7) | 0.1% (7) | 0.0% (0) |
| Miscellaneous durable goods merchant wholesalers | 0.1% (6) | 0.1% (6) | 0.0% (0) |
| Music stores | 0.1% (6) | 0.1% (6) | 0.0% (0) |
Unemployment in Hyde Park
- Unemployment by race in 2000
- Unemployment rate for White non-Hispanic residents
- 13.4%Males
- 7.3%Females
- Unemployment rate for Black residents
- 12.1%Males
- Unemployment rate for Asian residents
- 26.0%Males
- 20.8%Females
- Unemployment rate for other race residents
- 17.2%Males
- Unemployment rate for two or more race residents
- 13.6%Males
- 42.0%Females
- Unemployment rate for Hispanic or Latino residents
- 12.0%Males
Time leaving home to go to work

<5am:
| Hyde Park: | 3.2% (309) |
| New York: | 2.4% (194,562) |
5:30am:
| Hyde Park: | 1.7% (160) |
| New York: | 2.1% (174,328) |
6am:
| Hyde Park: | 3.0% (291) |
| New York: | 3.1% (253,826) |
6:30am:
| Hyde Park: | 6.3% (601) |
| New York: | 7.0% (573,349) |
7am:
| Hyde Park: | 10.1% (964) |
| New York: | 8.6% (706,982) |
7:30am:
| Hyde Park: | 14.7% (1,404) |
| New York: | 14.0% (1,147,579) |
8am:
| Hyde Park: | 16.1% (1,542) |
| New York: | 14.8% (1,213,706) |
8:30am:
| Hyde Park: | 12.9% (1,231) |
| New York: | 13.9% (1,144,298) |
9am:
| Hyde Park: | 7.2% (690) |
| New York: | 7.5% (614,475) |
10am:
| Hyde Park: | 6.7% (642) |
| New York: | 7.2% (593,377) |
11am:
| Hyde Park: | 2.1% (202) |
| New York: | 2.7% (224,011) |
12pm:
| Hyde Park: | 1.1% (108) |
| New York: | 1.3% (105,049) |
4pm:
| Hyde Park: | 7.5% (716) |
| New York: | 6.3% (517,309) |
>4pm:
| Hyde Park: | 5.3% (503) |
| New York: | 6.1% (501,196) |
Travel time to work


Less than 5 minutes:
| Hyde Park: | 2.3% (220) |
| New York: | 2.7% (219,036) |
5 to 9 minutes:
| Hyde Park: | 8.9% (850) |
| New York: | 8.3% (680,270) |
10 to 14 minutes:
| Hyde Park: | 17.4% (1,661) |
| New York: | 11.6% (956,590) |
15 to 19 minutes:
| Hyde Park: | 16.2% (1,544) |
| New York: | 12.4% (1,020,084) |
20 to 24 minutes:
| Hyde Park: | 16.6% (1,583) |
| New York: | 12.3% (1,013,757) |
25 to 29 minutes:
| Hyde Park: | 5.4% (520) |
| New York: | 4.9% (399,384) |
30 to 34 minutes:
| Hyde Park: | 10.1% (964) |
| New York: | 12.9% (1,058,688) |
35 to 39 minutes:
| Hyde Park: | 2.3% (215) |
| New York: | 2.5% (203,722) |
40 to 44 minutes:
| Hyde Park: | 4.6% (440) |
| New York: | 4.1% (340,311) |
45 to 59 minutes:
| Hyde Park: | 6.3% (604) |
| New York: | 9.8% (806,556) |
60 to 89 minutes:
| Hyde Park: | 3.8% (362) |
| New York: | 10.3% (848,185) |
90 or more minutes:
| Hyde Park: | 4.2% (400) |
| New York: | 5.1% (417,464) |
Means of transportation to work


Drove car alone:
| Hyde Park: | 83.3% (7,952) |
| New York: | 56.3% (4,620,178) |
Carpooled:
| Hyde Park: | 9.7% (929) |
| New York: | 9.2% (756,918) |
Bus or trolley bus:
| Hyde Park: | 0.8% (73) |
| New York: | 5.8% (475,389) |
Subway or elevated:
| Hyde Park: | 0.1% (7) |
| New York: | 14.8% (1,217,009) |
Railroad:
| Hyde Park: | 1.4% (130) |
| New York: | 2.8% (228,215) |
Motorcycle:
| Hyde Park: | 0.1% (13) |
| New York: | 0.0% (3,625) |
Walked:
| Hyde Park: | 2.2% (207) |
| New York: | 6.2% (511,721) |
Other means:
| Hyde Park: | 0.5% (52) |
| New York: | 0.5% (40,375) |
Private vehicle occupancy

Drove alone:
| Hyde Park: | 89.5% (7,952) |
| New York: | 85.9% (4,620,178) |
In 2 person carpool:
| Hyde Park: | 8.5% (755) |
| New York: | 11.0% (590,255) |
In 3 person carpool:
| Hyde Park: | 1.3% (116) |
| New York: | 1.8% (96,470) |
In 4 person carpool:
| Hyde Park: | 0.5% (48) |
| New York: | 0.7% (36,112) |
In 7+ person carpool:
| Hyde Park: | 0.1% (10) |
| New York: | 0.3% (17,437) |
Class of workers
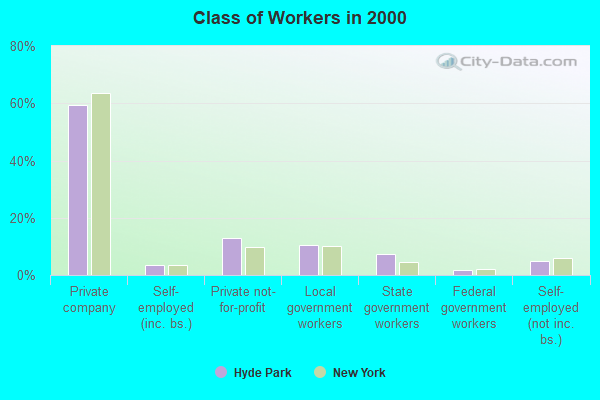
Employee of private company:
| Hyde Park: | 59.4% (5,741) |
| New York: | 63.7% (5,340,134) |
Self-employed in own incorporated business:
| Hyde Park: | 3.4% (327) |
| New York: | 3.4% (283,619) |
Private not-for-profit wage and salary workers:
| Hyde Park: | 12.8% (1,238) |
| New York: | 9.7% (810,356) |
Local government workers:
| Hyde Park: | 10.4% (1,002) |
| New York: | 10.2% (858,120) |
State government workers:
| Hyde Park: | 7.3% (702) |
| New York: | 4.6% (383,673) |
Federal government workers:
| Hyde Park: | 1.8% (177) |
| New York: | 2.2% (185,100) |
Self-employed workers in own not incorporated business:
| Hyde Park: | 4.9% (472) |
| New York: | 6.0% (501,068) |
Unpaid family workers:
| Hyde Park: | 0.0% (4) |
| New York: | 0.2% (20,918) |

Employee of private company - Males:
| Hyde Park: | 62.1% (3,236) |
| New York: | 66.2% (2,902,064) |
Self-employed in own incorporated business - Males:
| Hyde Park: | 5.2% (273) |
| New York: | 4.9% (215,651) |
Private not-for-profit wage and salary workers - Males:
| Hyde Park: | 7.1% (372) |
| New York: | 6.3% (277,787) |
Local government workers - Males:
| Hyde Park: | 8.9% (463) |
| New York: | 8.7% (380,426) |
State government workers - Males:
| Hyde Park: | 7.9% (410) |
| New York: | 4.1% (181,784) |
Federal government workers - Males:
| Hyde Park: | 2.3% (122) |
| New York: | 2.3% (102,647) |
Self-employed workers in own not incorporated business - Males:
| Hyde Park: | 6.4% (331) |
| New York: | 7.1% (312,497) |

Employee of private company - Females:
| Hyde Park: | 56.2% (2,505) |
| New York: | 60.9% (2,438,070) |
Self-employed in own incorporated business - Females:
| Hyde Park: | 1.2% (54) |
| New York: | 1.7% (67,968) |
Private not-for-profit wage and salary workers - Females:
| Hyde Park: | 19.4% (866) |
| New York: | 13.3% (532,569) |
Local government workers - Females:
| Hyde Park: | 12.1% (539) |
| New York: | 11.9% (477,694) |
State government workers - Females:
| Hyde Park: | 6.6% (292) |
| New York: | 5.0% (201,889) |
Federal government workers - Females:
| Hyde Park: | 1.2% (55) |
| New York: | 2.1% (82,453) |
Self-employed workers in own not incorporated business - Females:
| Hyde Park: | 3.2% (141) |
| New York: | 4.7% (188,571) |
Unpaid family workers - Females:
| Hyde Park: | 0.1% (4) |
| New York: | 0.3% (11,448) |