Work and Jobs in Iowa City, Iowa (IA) Detailed Stats
Occupations, Industries, Unemployment, Workers, Commute
Settings
X


Recent posts about work in Iowa City, Iowa on our local forum with over 2,400,000 registered users:
 | Interested in Visiting\Possibly Moving to Iowa City-Info Needed (17 replies) |
| Older gay men in Iowa City (5 replies) |
| Are there really jobs available in Iowa City? (5 replies) |
| Congrats to Iowa City - nations lowest unemployment rate (4 replies) |
| Job market in Iowa City. (9 replies) |
| Moving to Iowa City, working in Marion (18 replies) |
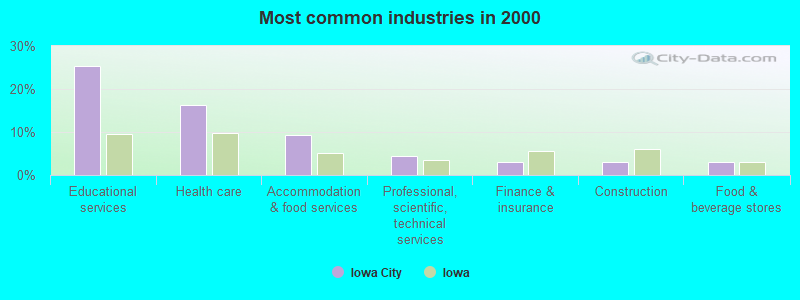
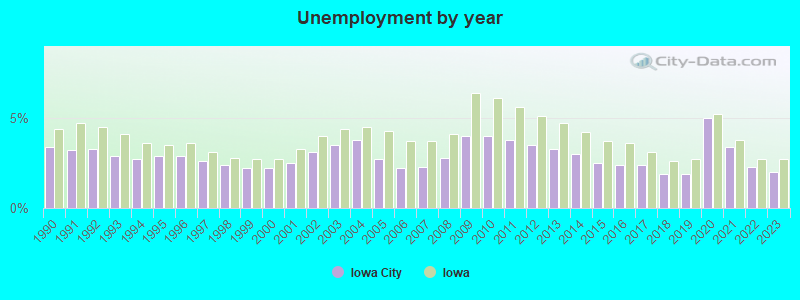
The unemployment rate in 2023 in Iowa City, IA was 2.0%, which was 35.0% less than the unemployment rate of 2.7% across the entire state of Iowa. Compared to the unemployment rate of 3.3% in 2013, this represents a decrease of 65.0%. The most common industries in Iowa City are: Educational services (25.4% of civilian employees), Health care (16.2% of civilian employees), Accommodation & food services (9.3% of civilian employees). 91.2% of workers work in Johnson County and 11.8% of all workers work at home. 55.0% of workers are employees of private companies, which is 20.3% less than the rate of 66.1% across the entire state of Iowa.
Whole page based on the data from 2000 / 2022 when the population of Iowa City, Iowa was 62,220 / 75,231
Whole page based on the data from 2000 / 2022 when the population of Iowa City, Iowa was 62,220 / 75,231
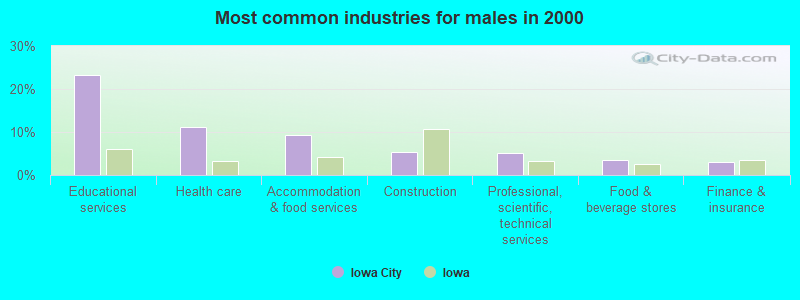
Most common industries

Most common industries | |||
|---|---|---|---|
Industry | All | Males | Females |
| Educational services | 25.4% (9,284) | 23.3% (4,330) | 27.6% (4,954) |
| Health care | 16.2% (5,906) | 11.1% (2,065) | 21.4% (3,841) |
| Accommodation and food services | 9.3% (3,381) | 9.2% (1,705) | 9.3% (1,676) |
| Professional, scientific, and technical services | 4.5% (1,653) | 5.1% (953) | 3.9% (700) |
| Finance and insurance | 3.1% (1,139) | 2.9% (539) | 3.3% (600) |
| Construction | 3.0% (1,113) | 5.4% (1,002) | 0.6% (111) |
| Food and beverage stores | 3.0% (1,082) | 3.4% (631) | 2.5% (451) |
| Social assistance | 2.7% (977) | 0.6% (114) | 4.8% (863) |
| Data processing, libraries, and other information services | 2.3% (838) | 2.2% (409) | 2.4% (429) |
| Department and other general merchandise stores | 2.2% (786) | 1.5% (274) | 2.9% (512) |
| Public administration | 2.0% (741) | 2.3% (429) | 1.7% (312) |
| Arts, entertainment, and recreation | 1.5% (549) | 1.6% (304) | 1.4% (245) |
| Real estate and rental and leasing | 1.4% (501) | 1.6% (293) | 1.2% (208) |
| Publishing, and motion picture and sound recording industries | 1.3% (489) | 1.7% (324) | 0.9% (165) |
| Administrative and support and waste management services | 1.3% (462) | 1.5% (276) | 1.0% (186) |
| Broadcasting and telecommunications | 1.2% (456) | 1.7% (310) | 0.8% (146) |
| Religious, grantmaking, civic, professional, and similar organizations | 1.2% (437) | 0.9% (161) | 1.5% (276) |
| Personal and laundry services | 1.1% (414) | 0.9% (170) | 1.4% (244) |
| Pharmacies and drug stores | 0.9% (326) | 0.6% (116) | 1.2% (210) |
| Motor vehicle and parts dealers | 0.8% (306) | 1.4% (256) | 0.3% (50) |
| Miscellaneous manufacturing | 0.8% (299) | 1.3% (233) | 0.4% (66) |
| Food | 0.8% (298) | 1.0% (177) | 0.7% (121) |
| Transportation equipment | 0.8% (288) | 1.1% (202) | 0.5% (86) |
| Used merchandise, gift, novelty, and souvenir, and other miscellaneous stores | 0.8% (285) | 0.6% (103) | 1.0% (182) |
| Printing and related support activities | 0.8% (275) | 1.0% (193) | 0.5% (82) |
| Chemicals | 0.7% (260) | 1.0% (184) | 0.4% (76) |
| Building material and garden equipment and supplies dealers | 0.7% (244) | 1.0% (188) | 0.3% (56) |
| Other transportation, and support activities, and couriers | 0.7% (243) | 1.0% (179) | 0.4% (64) |
| Repair and maintenance | 0.6% (216) | 1.0% (192) | 0.1% (24) |
| Clothing and accessories, including shoe, stores | 0.6% (206) | 0.4% (80) | 0.7% (126) |
| Truck transportation | 0.5% (188) | 0.9% (166) | 0.1% (22) |
| Sporting goods, camera, and hobby and toy stores | 0.5% (187) | 0.8% (155) | 0.2% (32) |
| Computer and electronic products | 0.5% (180) | 0.8% (141) | 0.2% (39) |
| Groceries and related products merchant wholesalers | 0.5% (168) | 0.6% (113) | 0.3% (55) |
| Utilities | 0.4% (153) | 0.7% (136) | 0.1% (17) |
| Radio, TV, and computer stores | 0.4% (152) | 0.8% (145) | 0.0% (7) |
| Book stores and news dealers | 0.4% (148) | 0.4% (67) | 0.5% (81) |
| Furniture and home furnishings, and household appliance stores | 0.4% (145) | 0.5% (99) | 0.3% (46) |
| Plastics and rubber products | 0.3% (122) | 0.5% (100) | 0.1% (22) |
| Other direct selling establishments | 0.3% (114) | 0.2% (37) | 0.4% (77) |
| U. S. Postal service | 0.3% (111) | 0.5% (90) | 0.1% (21) |
| Gasoline stations | 0.3% (108) | 0.4% (79) | 0.2% (29) |
| Agriculture, forestry, fishing and hunting | 0.3% (102) | 0.4% (79) | 0.1% (23) |
| Metal and metal products | 0.2% (77) | 0.3% (61) | 0.1% (16) |
| Professional and commercial equipment and supplies merchant wholesalers | 0.2% (75) | 0.4% (67) | 0.0% (8) |
| Health and personal care, except drug, stores | 0.2% (73) | 0.1% (13) | 0.3% (60) |
| Music stores | 0.2% (70) | 0.1% (25) | 0.3% (45) |
| Machinery | 0.2% (63) | 0.3% (48) | 0.1% (15) |
| Electrical equipment, appliances, and components | 0.2% (62) | 0.3% (48) | 0.1% (14) |
| Private households | 0.2% (60) | 0.0% (0) | 0.3% (60) |
| Electrical and electronic goods merchant wholesalers | 0.2% (59) | 0.3% (49) | 0.1% (10) |
| Furniture and related product manufacturing | 0.2% (57) | 0.2% (40) | 0.1% (17) |
| Warehousing and storage | 0.1% (53) | 0.3% (53) | 0.0% (0) |
| Retail florists | 0.1% (46) | 0.1% (22) | 0.1% (24) |
| Jewelry, luggage, and leather goods stores | 0.1% (44) | 0.0% (8) | 0.2% (36) |
| Miscellaneous nondurable goods merchant wholesalers | 0.1% (38) | 0.1% (18) | 0.1% (20) |
| Paper | 0.1% (36) | 0.2% (29) | 0.0% (7) |
| Office supplies and stationery stores | 0.1% (32) | 0.1% (23) | 0.1% (9) |
| Rail transportation | 0.1% (32) | 0.2% (32) | 0.0% (0) |
| Wood products | 0.1% (27) | 0.1% (27) | 0.0% (0) |
| Hardware, plumbing and heating equipment, and supplies merchant wholesalers | 0.1% (26) | 0.1% (20) | 0.0% (6) |
| Farm supplies merchant wholesalers | 0.1% (23) | 0.1% (23) | 0.0% (0) |
| Motor vehicles, parts and supplies merchant wholesalers | 0.1% (19) | 0.1% (19) | 0.0% (0) |
Unemployment in Iowa City
- Unemployment by race in 2022
- Unemployment rate for White non-Hispanic residents
- 3.2%Males
- 3.4%Females
- Unemployment rate for Black residents
- 7.2%Males
- 5.9%Females
- Unemployment rate for Asian residents
- 2.7%Males
- 8.2%Females
- Unemployment rate for other race residents
- 1.6%Males
- 4.9%Females
- Unemployment rate for two or more race residents
- 2.2%Males
- 5.5%Females
- Unemployment rate for Hispanic or Latino residents
- 5.3%Males
- 3.5%Females
- Unemployment by race in 2000
- Unemployment rate for White non-Hispanic residents
- 4.7%Males
- 3.2%Females
- Unemployment rate for Black residents
- 13.2%Males
- 6.5%Females
- Unemployment rate for American Indian and Alaska Native residents
- 6.3%Females
- Unemployment rate for Asian residents
- 1.5%Males
- 4.6%Females
- Unemployment rate for other race residents
- 4.9%Males
- Unemployment rate for two or more race residents
- 3.1%Males
- 10.1%Females
- Unemployment rate for Hispanic or Latino residents
- 8.8%Males
- 5.8%Females
Unemployment in 2023:
| Iowa City: | 2.0% |
| Iowa: | 2.7% |
Unemployment in 2022:
| Iowa City: | 2.3% |
| Iowa: | 2.7% |
Unemployment in 2021:
| Iowa City: | 3.4% |
| Iowa: | 3.8% |
Unemployment in 2020:
| Iowa City: | 5.0% |
| Iowa: | 5.2% |
Unemployment in 2019:
| Iowa City: | 1.9% |
| Iowa: | 2.7% |
Unemployment in 2018:
| Iowa City: | 1.9% |
| Iowa: | 2.6% |
Unemployment in 2017:
| Iowa City: | 2.4% |
| Iowa: | 3.1% |
Unemployment in 2016:
| Iowa City: | 2.4% |
| Iowa: | 3.6% |
Unemployment in 2015:
| Iowa City: | 2.5% |
| Iowa: | 3.7% |
Unemployment in 2014:
| Iowa City: | 3.0% |
| Iowa: | 4.2% |
Unemployment in 2013:
| Iowa City: | 3.3% |
| Iowa: | 4.7% |
Unemployment in 2012:
| Iowa City: | 3.5% |
| Iowa: | 5.1% |
Unemployment in 2011:
| Iowa City: | 3.8% |
| Iowa: | 5.6% |
Unemployment in 2010:
| Iowa City: | 4.0% |
| Iowa: | 6.1% |
Unemployment in 2009:
| Iowa City: | 4.0% |
| Iowa: | 6.4% |
Unemployment in 2008:
| Iowa City: | 2.8% |
| Iowa: | 4.1% |
Unemployment in 2007:
| Iowa City: | 2.3% |
| Iowa: | 3.7% |
Unemployment in 2006:
| Iowa City: | 2.2% |
| Iowa: | 3.7% |
Unemployment in 2005:
| Iowa City: | 2.7% |
| Iowa: | 4.3% |
Unemployment in 2004:
| Iowa City: | 3.8% |
| Iowa: | 4.5% |
Unemployment in 2003:
| Iowa City: | 3.5% |
| Iowa: | 4.4% |
Unemployment in 2002:
| Iowa City: | 3.1% |
| Iowa: | 4.0% |
Unemployment in 2001:
| Iowa City: | 2.5% |
| Iowa: | 3.3% |
Unemployment in 2000:
| Iowa City: | 2.2% |
| Iowa: | 2.7% |
Unemployment in 1999:
| Iowa City: | 2.2% |
| Iowa: | 2.7% |
Unemployment in 1998:
| Iowa City: | 2.4% |
| Iowa: | 2.8% |
Unemployment in 1997:
| Iowa City: | 2.6% |
| Iowa: | 3.1% |
Unemployment in 1996:
| Iowa City: | 2.9% |
| Iowa: | 3.6% |
Unemployment in 1995:
| Iowa City: | 2.9% |
| Iowa: | 3.5% |
Unemployment in 1994:
| Iowa City: | 2.7% |
| Iowa: | 3.6% |
Unemployment in 1993:
| Iowa City: | 2.9% |
| Iowa: | 4.1% |
Unemployment in 1992:
| Iowa City: | 3.3% |
| Iowa: | 4.5% |
Unemployment in 1991:
| Iowa City: | 3.2% |
| Iowa: | 4.7% |
Unemployment in 1990:
| Iowa City: | 3.4% |
| Iowa: | 4.4% |
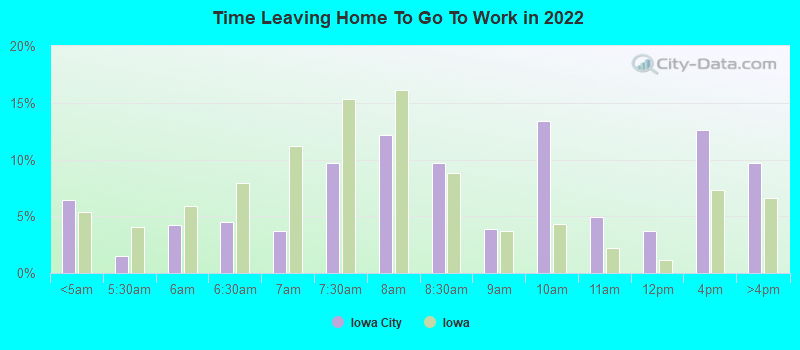
Time leaving home to go to work
12:00 a.m. to 4:59 a.m.:
| Iowa City: | 6.4% (2,298) |
| Iowa: | 5.4% (78,069) |
5:00 a.m. to 5:29 a.m.:
| Iowa City: | 1.5% (543) |
| Iowa: | 4.1% (59,137) |
5:30 a.m. to 5:59 a.m.:
| Iowa City: | 4.2% (1,499) |
| Iowa: | 5.9% (85,191) |
6:00 a.m. to 6:29 a.m.:
| Iowa City: | 4.5% (1,595) |
| Iowa: | 7.9% (115,215) |
6:30 a.m. to 6:59 a.m.:
| Iowa City: | 3.7% (1,311) |
| Iowa: | 11.2% (163,096) |
7:00 a.m. to 7:29 a.m.:
| Iowa City: | 9.7% (3,473) |
| Iowa: | 15.3% (222,036) |
7:30 a.m. to 7:59 a.m.:
| Iowa City: | 12.1% (4,324) |
| Iowa: | 16.1% (233,545) |
8:00 a.m. to 8:29 a.m.:
| Iowa City: | 9.7% (3,444) |
| Iowa: | 8.8% (128,101) |
8:30 a.m. to 8:59 a.m.:
| Iowa City: | 3.9% (1,396) |
| Iowa: | 3.7% (54,230) |
9:00 a.m. to 9:59 a.m.:
| Iowa City: | 13.4% (4,770) |
| Iowa: | 4.4% (63,292) |
10:00 a.m. to 10:59 a.m.:
| Iowa City: | 4.9% (1,747) |
| Iowa: | 2.2% (31,476) |
11:00 a.m. to 11:59 a.m.:
| Iowa City: | 3.7% (1,305) |
| Iowa: | 1.1% (16,255) |
12:00 p.m. to 3:59 p.m.:
| Iowa City: | 12.6% (4,502) |
| Iowa: | 7.3% (106,198) |
4:00 p.m. to 11:59 p.m.:
| Iowa City: | 9.7% (3,469) |
| Iowa: | 6.6% (96,179) |

<5am:
| Iowa City: | 1.8% (629) |
| Iowa: | 3.2% (47,736) |
5:30am:
| Iowa City: | 0.9% (336) |
| Iowa: | 2.9% (42,797) |
6am:
| Iowa City: | 1.9% (667) |
| Iowa: | 4.6% (68,195) |
6:30am:
| Iowa City: | 3.3% (1,171) |
| Iowa: | 7.5% (110,529) |
7am:
| Iowa City: | 7.4% (2,639) |
| Iowa: | 11.2% (164,470) |
7:30am:
| Iowa City: | 11.4% (4,080) |
| Iowa: | 14.2% (208,547) |
8am:
| Iowa City: | 18.3% (6,513) |
| Iowa: | 17.7% (260,172) |
8:30am:
| Iowa City: | 11.1% (3,953) |
| Iowa: | 8.3% (121,843) |
9am:
| Iowa City: | 5.8% (2,069) |
| Iowa: | 3.6% (53,363) |
10am:
| Iowa City: | 7.0% (2,501) |
| Iowa: | 3.6% (53,533) |
11am:
| Iowa City: | 3.6% (1,286) |
| Iowa: | 1.7% (25,691) |
12pm:
| Iowa City: | 2.4% (843) |
| Iowa: | 0.9% (13,464) |
4pm:
| Iowa City: | 11.5% (4,085) |
| Iowa: | 8.0% (117,038) |
>4pm:
| Iowa City: | 11.2% (3,988) |
| Iowa: | 7.7% (112,601) |

12:00 a.m. to 4:59 a.m. - Males:
| Iowa City: | 7.3% (1,374) |
| Iowa: | 7.0% (54,907) |
5:00 a.m. to 5:29 a.m. - Males:
| Iowa City: | 2.5% (475) |
| Iowa: | 5.0% (38,853) |
5:30 a.m. to 5:59 a.m. - Males:
| Iowa City: | 5.4% (1,010) |
| Iowa: | 6.9% (54,231) |
6:00 a.m. to 6:29 a.m. - Males:
| Iowa City: | 2.2% (420) |
| Iowa: | 9.7% (76,023) |
6:30 a.m. to 6:59 a.m. - Males:
| Iowa City: | 2.6% (493) |
| Iowa: | 12.3% (95,751) |
7:00 a.m. to 7:29 a.m. - Males:
| Iowa City: | 9.5% (1,772) |
| Iowa: | 14.1% (110,477) |
7:30 a.m. to 7:59 a.m. - Males:
| Iowa City: | 11.3% (2,113) |
| Iowa: | 13.3% (103,974) |
8:00 a.m. to 8:29 a.m. - Males:
| Iowa City: | 7.5% (1,407) |
| Iowa: | 8.0% (62,850) |
8:30 a.m. to 8:59 a.m. - Males:
| Iowa City: | 5.4% (1,009) |
| Iowa: | 3.0% (23,631) |
9:00 a.m. to 9:59 a.m. - Males:
| Iowa City: | 16.2% (3,032) |
| Iowa: | 3.8% (29,331) |
10:00 a.m. to 10:59 a.m. - Males:
| Iowa City: | 4.6% (857) |
| Iowa: | 1.8% (14,356) |
11:00 a.m. to 11:59 a.m. - Males:
| Iowa City: | 0.5% (94) |
| Iowa: | 1.0% (7,664) |
12:00 p.m. to 3:59 p.m. - Males:
| Iowa City: | 14.6% (2,740) |
| Iowa: | 7.3% (57,343) |
4:00 p.m. to 11:59 p.m. - Males:
| Iowa City: | 10.3% (1,931) |
| Iowa: | 6.7% (51,988) |

12:00 a.m. to 4:59 a.m. - Females:
| Iowa City: | 5.5% (924) |
| Iowa: | 3.5% (23,162) |
5:00 a.m. to 5:29 a.m. - Females:
| Iowa City: | 0.4% (68) |
| Iowa: | 3.0% (20,284) |
5:30 a.m. to 5:59 a.m. - Females:
| Iowa City: | 2.9% (489) |
| Iowa: | 4.6% (30,960) |
6:00 a.m. to 6:29 a.m. - Females:
| Iowa City: | 6.9% (1,175) |
| Iowa: | 5.8% (39,192) |
6:30 a.m. to 6:59 a.m. - Females:
| Iowa City: | 4.8% (818) |
| Iowa: | 10.0% (67,345) |
7:00 a.m. to 7:29 a.m. - Females:
| Iowa City: | 10.0% (1,701) |
| Iowa: | 16.6% (111,559) |
7:30 a.m. to 7:59 a.m. - Females:
| Iowa City: | 13.0% (2,211) |
| Iowa: | 19.3% (129,571) |
8:00 a.m. to 8:29 a.m. - Females:
| Iowa City: | 12.0% (2,037) |
| Iowa: | 9.7% (65,251) |
8:30 a.m. to 8:59 a.m. - Females:
| Iowa City: | 2.3% (387) |
| Iowa: | 4.6% (30,599) |
9:00 a.m. to 9:59 a.m. - Females:
| Iowa City: | 10.3% (1,738) |
| Iowa: | 5.1% (33,961) |
10:00 a.m. to 10:59 a.m. - Females:
| Iowa City: | 5.3% (890) |
| Iowa: | 2.6% (17,120) |
11:00 a.m. to 11:59 a.m. - Females:
| Iowa City: | 7.1% (1,211) |
| Iowa: | 1.3% (8,591) |
12:00 p.m. to 3:59 p.m. - Females:
| Iowa City: | 10.4% (1,762) |
| Iowa: | 7.3% (48,855) |
4:00 p.m. to 11:59 p.m. - Females:
| Iowa City: | 9.1% (1,538) |
| Iowa: | 6.6% (44,191) |
Travel time to work
Percentage of workers working in this county: 91.2%
Number of people working at home: 4,776 (11.8% of all workers)
Daytime population change due to commuting: +17,074 (+27.4%)
Workers who live and work in this city: 28,067 (78.7%)
Number of people working at home: 4,776 (11.8% of all workers)
Daytime population change due to commuting: +17,074 (+27.4%)
Workers who live and work in this city: 28,067 (78.7%)

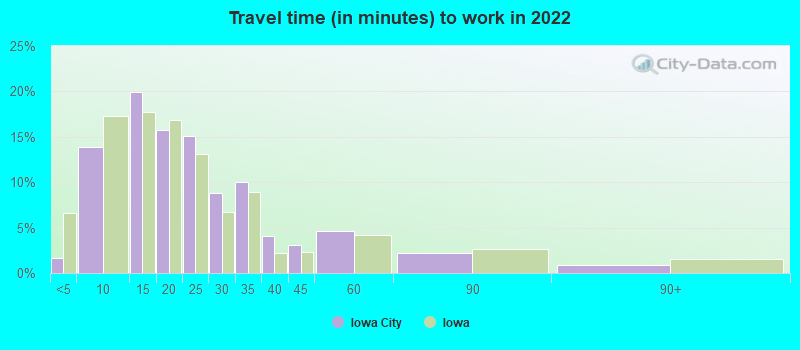

Less than 5 minutes:
| Iowa City: | 1.7% (843) |
| Iowa: | 6.6% (95,496) |
5 to 9 minutes:
| Iowa City: | 13.9% (7,058) |
| Iowa: | 17.3% (250,741) |
10 to 14 minutes:
| Iowa City: | 19.9% (10,107) |
| Iowa: | 17.7% (257,557) |
15 to 19 minutes:
| Iowa City: | 15.8% (7,992) |
| Iowa: | 16.8% (243,839) |
20 to 24 minutes:
| Iowa City: | 15.1% (7,633) |
| Iowa: | 13.1% (190,675) |
25 to 29 minutes:
| Iowa City: | 8.8% (4,453) |
| Iowa: | 6.7% (97,304) |
30 to 34 minutes:
| Iowa City: | 10.0% (5,089) |
| Iowa: | 8.9% (129,029) |
35 to 39 minutes:
| Iowa City: | 4.1% (2,077) |
| Iowa: | 2.2% (32,071) |
40 to 44 minutes:
| Iowa City: | 3.0% (1,541) |
| Iowa: | 2.3% (33,530) |
45 to 59 minutes:
| Iowa City: | 4.6% (2,347) |
| Iowa: | 4.2% (60,805) |
60 to 89 minutes:
| Iowa City: | 2.2% (1,134) |
| Iowa: | 2.6% (37,616) |
90 or more minutes:
| Iowa City: | 0.9% (437) |
| Iowa: | 1.6% (22,955) |


Less than 5 minutes:
| Iowa City: | 3.9% (1,391) |
| Iowa: | 6.8% (100,616) |
5 to 9 minutes:
| Iowa City: | 18.1% (6,458) |
| Iowa: | 18.5% (271,589) |
10 to 14 minutes:
| Iowa City: | 28.1% (10,026) |
| Iowa: | 19.3% (283,804) |
15 to 19 minutes:
| Iowa City: | 22.1% (7,881) |
| Iowa: | 16.0% (234,745) |
20 to 24 minutes:
| Iowa City: | 10.7% (3,823) |
| Iowa: | 12.5% (183,539) |
25 to 29 minutes:
| Iowa City: | 2.7% (960) |
| Iowa: | 4.6% (67,775) |
30 to 34 minutes:
| Iowa City: | 5.9% (2,113) |
| Iowa: | 7.6% (111,454) |
35 to 39 minutes:
| Iowa City: | 0.8% (294) |
| Iowa: | 1.5% (22,220) |
40 to 44 minutes:
| Iowa City: | 1.2% (417) |
| Iowa: | 1.7% (24,880) |
45 to 59 minutes:
| Iowa City: | 2.0% (725) |
| Iowa: | 3.4% (49,913) |
60 to 89 minutes:
| Iowa City: | 1.2% (416) |
| Iowa: | 2.0% (28,703) |
90 or more minutes:
| Iowa City: | 0.7% (256) |
| Iowa: | 1.4% (20,741) |

Less than 5 minutes - Males:
| Iowa City: | 2.2% (515) |
| Iowa: | 6.6% (51,625) |
5 to 9 minutes - Males:
| Iowa City: | 13.9% (3,286) |
| Iowa: | 16.0% (124,588) |
10 to 14 minutes - Males:
| Iowa City: | 20.7% (4,879) |
| Iowa: | 16.9% (131,859) |
15 to 19 minutes - Males:
| Iowa City: | 15.2% (3,595) |
| Iowa: | 16.5% (128,726) |
20 to 24 minutes - Males:
| Iowa City: | 18.9% (4,448) |
| Iowa: | 13.7% (107,194) |
25 to 29 minutes - Males:
| Iowa City: | 5.8% (1,359) |
| Iowa: | 6.2% (48,704) |
30 to 34 minutes - Males:
| Iowa City: | 12.0% (2,821) |
| Iowa: | 10.1% (78,492) |
35 to 39 minutes - Males:
| Iowa City: | 3.9% (914) |
| Iowa: | 2.2% (17,505) |
40 to 44 minutes - Males:
| Iowa City: | 3.7% (880) |
| Iowa: | 2.5% (19,340) |
45 to 59 minutes - Males:
| Iowa City: | 2.1% (496) |
| Iowa: | 4.2% (32,880) |
60 to 89 minutes - Males:
| Iowa City: | 1.1% (258) |
| Iowa: | 3.2% (24,911) |
90 or more minutes - Males:
| Iowa City: | 0.6% (131) |
| Iowa: | 1.9% (14,756) |

Less than 5 minutes - Females:
| Iowa City: | 1.2% (328) |
| Iowa: | 6.5% (43,871) |
5 to 9 minutes - Females:
| Iowa City: | 13.9% (3,772) |
| Iowa: | 18.8% (126,153) |
10 to 14 minutes - Females:
| Iowa City: | 19.3% (5,228) |
| Iowa: | 18.7% (125,698) |
15 to 19 minutes - Females:
| Iowa City: | 16.2% (4,397) |
| Iowa: | 17.2% (115,113) |
20 to 24 minutes - Females:
| Iowa City: | 11.7% (3,185) |
| Iowa: | 12.4% (83,481) |
25 to 29 minutes - Females:
| Iowa City: | 11.4% (3,094) |
| Iowa: | 7.2% (48,600) |
30 to 34 minutes - Females:
| Iowa City: | 8.4% (2,268) |
| Iowa: | 7.5% (50,537) |
35 to 39 minutes - Females:
| Iowa City: | 4.3% (1,163) |
| Iowa: | 2.2% (14,566) |
40 to 44 minutes - Females:
| Iowa City: | 2.4% (661) |
| Iowa: | 2.1% (14,190) |
45 to 59 minutes - Females:
| Iowa City: | 6.8% (1,851) |
| Iowa: | 4.2% (27,925) |
60 to 89 minutes - Females:
| Iowa City: | 3.2% (876) |
| Iowa: | 1.9% (12,705) |
90 or more minutes - Females:
| Iowa City: | 1.1% (306) |
| Iowa: | 1.2% (8,199) |
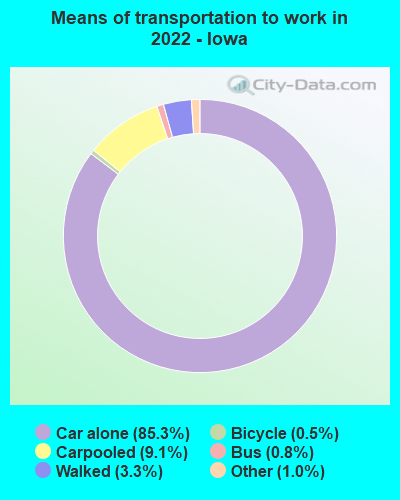
Means of transportation to work
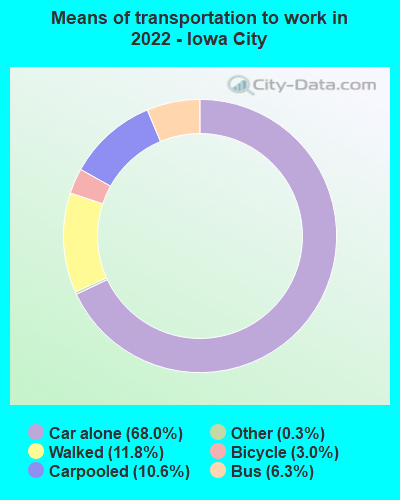
Drove car alone:
| Iowa City: | 68.0% (34,501) |
| Iowa: | 85.3% (570,774) |
Carpooled:
| Iowa City: | 10.6% (5,393) |
| Iowa: | 9.1% (65,446) |
Bus:
| Iowa City: | 6.3% (3,186) |
| Iowa: | 0.8% (5,487) |
Bicycle:
| Iowa City: | 3.0% (1,518) |
| Iowa: | 0.5% (1,516) |
Walked:
| Iowa City: | 11.8% (5,981) |
| Iowa: | 3.3% (21,070) |
Other means:
| Iowa City: | 0.3% (132) |
| Iowa: | 1.0% (6,656) |

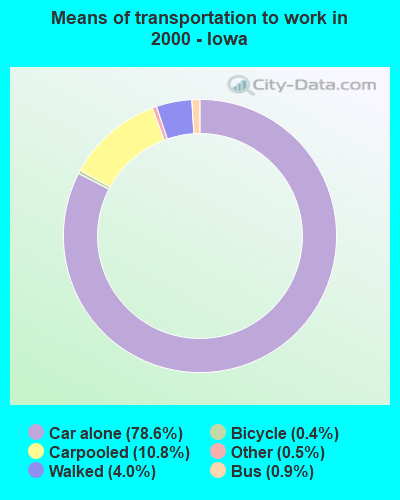
Drove car alone:
| Iowa City: | 61.0% (21,747) |
| Iowa: | 78.6% (1,155,008) |
Carpooled:
| Iowa City: | 10.2% (3,650) |
| Iowa: | 10.8% (158,699) |
Bus or trolley bus:
| Iowa City: | 7.6% (2,696) |
| Iowa: | 0.9% (13,917) |
Streetcar or trolley car:
| Iowa City: | 0.0% (6) |
| Iowa: | 0.0% (192) |
Taxicab:
| Iowa City: | 0.1% (36) |
| Iowa: | 0.0% (730) |
Motorcycle:
| Iowa City: | 0.2% (59) |
| Iowa: | 0.1% (766) |
Bicycle:
| Iowa City: | 2.5% (885) |
| Iowa: | 0.4% (5,244) |
Walked:
| Iowa City: | 15.5% (5,544) |
| Iowa: | 4.0% (58,088) |
Other means:
| Iowa City: | 0.4% (137) |
| Iowa: | 0.5% (7,153) |


Drove car alone - Males:
| Iowa City: | 67.2% (15,848) |
| Iowa: | 85.5% (570,774) |
Carpooled - Males:
| Iowa City: | 11.2% (2,640) |
| Iowa: | 8.6% (65,446) |
Bus - Males:
| Iowa City: | 5.6% (1,316) |
| Iowa: | 0.9% (5,487) |
Bicycle - Males:
| Iowa City: | 5.5% (1,289) |
| Iowa: | 0.6% (1,516) |
Walked - Males:
| Iowa City: | 10.2% (2,404) |
| Iowa: | 3.4% (21,070) |
Other means - Males:
| Iowa City: | 0.4% (85) |
| Iowa: | 1.0% (6,656) |

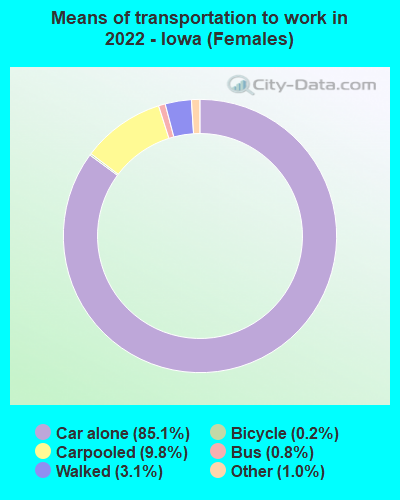
Drove car alone - Females:
| Iowa City: | 68.8% (18,653) |
| Iowa: | 85.1% (570,774) |
Carpooled - Females:
| Iowa City: | 10.1% (2,753) |
| Iowa: | 9.8% (65,446) |
Bus - Females:
| Iowa City: | 6.9% (1,870) |
| Iowa: | 0.8% (5,487) |
Bicycle - Females:
| Iowa City: | 0.8% (229) |
| Iowa: | 0.2% (1,516) |
Walked - Females:
| Iowa City: | 13.2% (3,577) |
| Iowa: | 3.1% (21,070) |
Other means - Females:
| Iowa City: | 0.2% (47) |
| Iowa: | 1.0% (6,656) |
Private vehicle occupancy

Drove alone:
| Iowa City: | 85.4% (22,174) |
| Iowa: | 90.5% (1,240,859) |
In 2 person carpool:
| Iowa City: | 12.2% (3,180) |
| Iowa: | 6.9% (94,195) |
In 3 person carpool:
| Iowa City: | 1.0% (256) |
| Iowa: | 1.4% (19,770) |
In 4 person carpool:
| Iowa City: | 0.6% (148) |
| Iowa: | 0.7% (10,059) |
In 5-6 person carpool:
| Iowa City: | 0.7% (191) |
| Iowa: | 0.3% (4,603) |
In 7+ person carpool:
| Iowa City: | 0.0% (12) |
| Iowa: | 0.2% (2,104) |

Drove alone:
| Iowa City: | 85.6% (21,747) |
| Iowa: | 87.9% (1,155,008) |
In 2 person carpool:
| Iowa City: | 13.0% (3,298) |
| Iowa: | 9.8% (128,891) |
In 3 person carpool:
| Iowa City: | 1.0% (256) |
| Iowa: | 1.4% (18,510) |
In 4 person carpool:
| Iowa City: | 0.3% (78) |
| Iowa: | 0.5% (6,602) |
In 5-6 person carpool:
| Iowa City: | 0.0% (8) |
| Iowa: | 0.2% (2,434) |
In 7+ person carpool:
| Iowa City: | 0.0% (10) |
| Iowa: | 0.2% (2,262) |
Class of workers
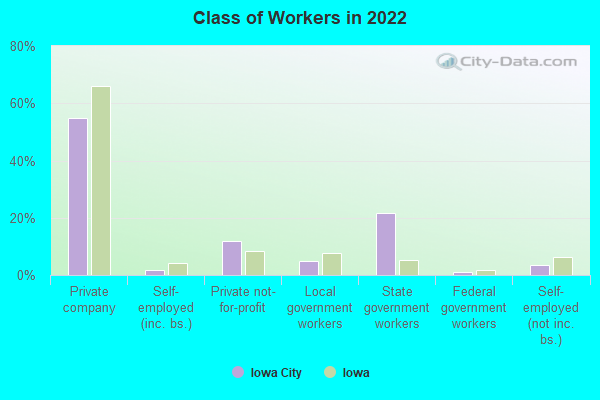
Employee of private company:
| Iowa City: | 55.0% (23,238) |
| Iowa: | 66.1% (1,096,595) |
Self-employed in own incorporated business:
| Iowa City: | 1.7% (724) |
| Iowa: | 4.1% (67,511) |
Private not-for-profit wage and salary workers:
| Iowa City: | 11.8% (5,001) |
| Iowa: | 8.5% (140,926) |
Local government workers:
| Iowa City: | 4.9% (2,088) |
| Iowa: | 7.8% (129,397) |
State government workers:
| Iowa City: | 21.8% (9,198) |
| Iowa: | 5.2% (86,770) |
Federal government workers:
| Iowa City: | 1.2% (508) |
| Iowa: | 1.7% (28,231) |
Self-employed workers in own not incorporated business:
| Iowa City: | 3.6% (1,522) |
| Iowa: | 6.3% (105,099) |

Employee of private company:
| Iowa City: | 50.1% (18,284) |
| Iowa: | 66.6% (992,122) |
Self-employed in own incorporated business:
| Iowa City: | 1.7% (636) |
| Iowa: | 3.0% (44,330) |
Private not-for-profit wage and salary workers:
| Iowa City: | 9.4% (3,429) |
| Iowa: | 8.2% (121,940) |
Local government workers:
| Iowa City: | 5.1% (1,858) |
| Iowa: | 6.1% (90,430) |
State government workers:
| Iowa City: | 27.8% (10,138) |
| Iowa: | 5.8% (85,726) |
Federal government workers:
| Iowa City: | 2.0% (724) |
| Iowa: | 1.8% (27,176) |
Self-employed workers in own not incorporated business:
| Iowa City: | 3.7% (1,365) |
| Iowa: | 8.2% (121,579) |
Unpaid family workers:
| Iowa City: | 0.2% (81) |
| Iowa: | 0.4% (6,513) |

Employee of private company - Males:
| Iowa City: | 56.6% (12,284) |
| Iowa: | 70.3% (615,735) |
Self-employed in own incorporated business - Males:
| Iowa City: | 3.1% (673) |
| Iowa: | 5.3% (46,477) |
Private not-for-profit wage and salary workers - Males:
| Iowa City: | 8.4% (1,821) |
| Iowa: | 5.1% (44,923) |
Local government workers - Males:
| Iowa City: | 4.9% (1,057) |
| Iowa: | 5.7% (49,834) |
State government workers - Males:
| Iowa City: | 23.3% (5,057) |
| Iowa: | 4.4% (38,327) |
Federal government workers - Males:
| Iowa City: | 0.6% (141) |
| Iowa: | 1.7% (14,570) |
Self-employed workers in own not incorporated business - Males:
| Iowa City: | 3.1% (679) |
| Iowa: | 7.4% (64,591) |

Employee of private company - Females:
| Iowa City: | 53.3% (10,954) |
| Iowa: | 61.5% (480,860) |
Self-employed in own incorporated business - Females:
| Iowa City: | 0.2% (51) |
| Iowa: | 2.7% (21,034) |
Private not-for-profit wage and salary workers - Females:
| Iowa City: | 15.5% (3,180) |
| Iowa: | 12.3% (96,003) |
Local government workers - Females:
| Iowa City: | 5.0% (1,031) |
| Iowa: | 10.2% (79,563) |
State government workers - Females:
| Iowa City: | 20.1% (4,141) |
| Iowa: | 6.2% (48,443) |
Federal government workers - Females:
| Iowa City: | 1.8% (367) |
| Iowa: | 1.7% (13,661) |
Self-employed workers in own not incorporated business - Females:
| Iowa City: | 4.1% (843) |
| Iowa: | 5.2% (40,508) |