Work and Jobs in Lee, New York (NY) Detailed Stats
Occupations, Industries, Unemployment, Workers, Commute

Recent posts about work in Lee, New York on our local forum with over 2,400,000 registered users:
 | Crane watch map (349 replies) |
| Bills want new stadium to be completely funded by taxpayer money (998 replies) |
| An estimated 25% of NYC renters haven’t paid rent since March (36 replies) |
| For those interested in state political issues (428 replies) |
| LIRR workers made over 1.1 billion in overtime in 2020, during a pandemic (14 replies) |
| Overworked ? (38 replies) |
Latest news about work in Lee, NY collected exclusively by city-data.com from local newspapers, TV, and radio stations
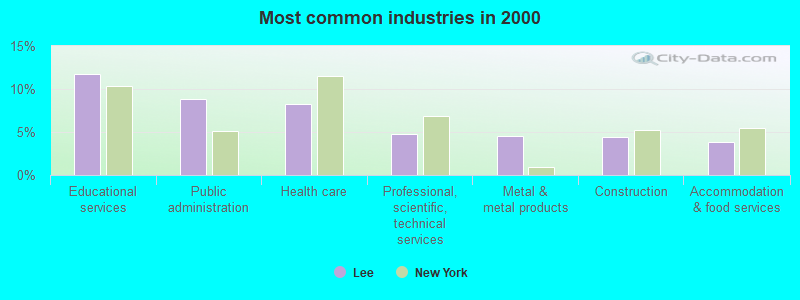
The most common industries in Lee are: Educational services (11.8% of civilian employees), Public administration (8.9% of civilian employees), Health care (8.3% of civilian employees). 57.8% of workers are employees of private companies, which is 10.1% less than the rate of 63.7% across the entire state of New York.
Most common industries
Most common industries | |||
|---|---|---|---|
Industry | All | Males | Females |
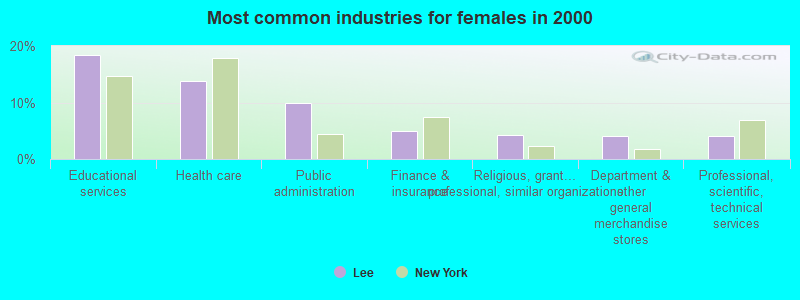
| Educational services | 11.8% (369) | 5.6% (92) | 18.5% (277) |
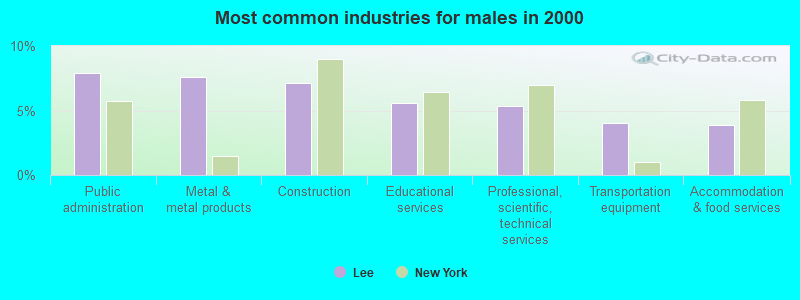
| Public administration | 8.9% (279) | 7.9% (130) | 9.9% (149) |
| Health care | 8.3% (261) | 3.4% (55) | 13.7% (206) |
| Professional, scientific, and technical services | 4.7% (148) | 5.4% (88) | 4.0% (60) |
| Metal and metal products | 4.6% (143) | 7.6% (125) | 1.2% (18) |
| Construction | 4.4% (137) | 7.1% (117) | 1.3% (20) |
| Accommodation and food services | 3.9% (121) | 3.9% (64) | 3.8% (57) |
| Finance and insurance | 3.4% (108) | 2.1% (34) | 4.9% (74) |
| Department and other general merchandise stores | 3.0% (93) | 2.0% (32) | 4.1% (61) |
| Religious, grantmaking, civic, professional, and similar organizations | 3.0% (93) | 1.8% (30) | 4.2% (63) |
| Transportation equipment | 2.5% (78) | 4.0% (66) | 0.8% (12) |
| Food and beverage stores | 2.5% (77) | 3.4% (56) | 1.4% (21) |
| Miscellaneous manufacturing | 2.4% (74) | 2.7% (45) | 1.9% (29) |
| Agriculture, forestry, fishing and hunting | 2.0% (63) | 3.4% (56) | 0.5% (7) |
| Other direct selling establishments | 1.9% (61) | 2.1% (34) | 1.8% (27) |
| Arts, entertainment, and recreation | 1.9% (60) | 2.0% (33) | 1.8% (27) |
| Machinery | 1.8% (57) | 2.7% (44) | 0.9% (13) |
| Social assistance | 1.8% (56) | 1.4% (23) | 2.2% (33) |
| Administrative and support and waste management services | 1.8% (56) | 2.1% (34) | 1.5% (22) |
| Motor vehicle and parts dealers | 1.8% (56) | 2.7% (44) | 0.8% (12) |
| Pharmacies and drug stores | 1.7% (54) | 0.4% (7) | 3.1% (47) |
| Other transportation, and support activities, and couriers | 1.7% (52) | 1.2% (19) | 2.2% (33) |
| Electrical equipment, appliances, and components | 1.7% (52) | 2.5% (41) | 0.7% (11) |
| Air transportation | 1.3% (42) | 1.2% (19) | 1.5% (23) |
| Publishing, and motion picture and sound recording industries | 1.1% (34) | 1.6% (27) | 0.5% (7) |
| Repair and maintenance | 1.0% (32) | 1.6% (26) | 0.4% (6) |
| Truck transportation | 1.0% (31) | 1.9% (31) | 0.0% (0) |
| Personal and laundry services | 1.0% (30) | 0.3% (5) | 1.7% (25) |
| Drugs, sundries, and chemical and allied products merchant wholesalers | 0.9% (28) | 1.3% (21) | 0.5% (7) |
| Furniture and related product manufacturing | 0.9% (27) | 1.6% (27) | 0.0% (0) |
| U. S. Postal service | 0.8% (25) | 1.1% (18) | 0.5% (7) |
| Broadcasting and telecommunications | 0.8% (25) | 0.7% (12) | 0.9% (13) |
| Computer and electronic products | 0.8% (24) | 1.0% (16) | 0.5% (8) |
| Building material and garden equipment and supplies dealers | 0.7% (23) | 0.5% (8) | 1.0% (15) |
| Printing and related support activities | 0.7% (23) | 0.7% (11) | 0.8% (12) |
| Real estate and rental and leasing | 0.6% (20) | 0.2% (4) | 1.1% (16) |
| Used merchandise, gift, novelty, and souvenir, and other miscellaneous stores | 0.6% (19) | 0.3% (5) | 0.9% (14) |
| Clothing and accessories, including shoe, stores | 0.6% (18) | 0.0% (0) | 1.2% (18) |
| Electronic shopping and mail-order houses | 0.6% (18) | 1.1% (18) | 0.0% (0) |
| Wood products | 0.5% (17) | 1.0% (17) | 0.0% (0) |
| Warehousing and storage | 0.5% (16) | 0.3% (5) | 0.7% (11) |
| Food | 0.4% (13) | 0.5% (9) | 0.3% (4) |
| Gasoline stations | 0.4% (12) | 0.4% (6) | 0.4% (6) |
| Book stores and news dealers | 0.4% (12) | 0.4% (7) | 0.3% (5) |
| Private households | 0.4% (11) | 0.0% (0) | 0.7% (11) |
| Motor vehicles, parts and supplies merchant wholesalers | 0.3% (10) | 0.6% (10) | 0.0% (0) |
| Nonmetallic mineral products | 0.3% (9) | 0.5% (9) | 0.0% (0) |
| Radio, TV, and computer stores | 0.3% (8) | 0.5% (8) | 0.0% (0) |
| Petroleum and petroleum products merchant wholesalers | 0.3% (8) | 0.5% (8) | 0.0% (0) |
| Paper | 0.2% (7) | 0.4% (7) | 0.0% (0) |
| Metals and minerals, except petroleum, merchant wholesalers | 0.2% (7) | 0.4% (7) | 0.0% (0) |
| Data processing, libraries, and other information services | 0.2% (6) | 0.4% (6) | 0.0% (0) |
| Paper and paper products merchant wholesalers | 0.2% (6) | 0.4% (6) | 0.0% (0) |
| Electrical and electronic goods merchant wholesalers | 0.2% (6) | 0.4% (6) | 0.0% (0) |
| Health and personal care, except drug, stores | 0.2% (5) | 0.0% (0) | 0.3% (5) |
| Chemicals | 0.2% (5) | 0.3% (5) | 0.0% (0) |
| Furniture and home furnishing merchant wholesalers | 0.1% (4) | 0.0% (0) | 0.3% (4) |
| Miscellaneous durable goods merchant wholesalers | 0.1% (4) | 0.2% (4) | 0.0% (0) |
| Hardware, plumbing and heating equipment, and supplies merchant wholesalers | 0.1% (4) | 0.0% (0) | 0.3% (4) |
| Plastics and rubber products | 0.1% (3) | 0.2% (3) | 0.0% (0) |
Unemployment in Lee
- Unemployment by race in 2000
- Unemployment rate for White non-Hispanic residents
- 6.0%Males
- 2.0%Females
- Unemployment rate for Hispanic or Latino residents
- 18.8%Females
Time leaving home to go to work

<5am:
| Lee: | 2.7% (86) |
| New York: | 2.4% (194,562) |
5:30am:
| Lee: | 2.4% (76) |
| New York: | 2.1% (174,328) |
6am:
| Lee: | 2.9% (91) |
| New York: | 3.1% (253,826) |
6:30am:
| Lee: | 6.8% (215) |
| New York: | 7.0% (573,349) |
7am:
| Lee: | 14.3% (454) |
| New York: | 8.6% (706,982) |
7:30am:
| Lee: | 12.0% (381) |
| New York: | 14.0% (1,147,579) |
8am:
| Lee: | 15.7% (498) |
| New York: | 14.8% (1,213,706) |
8:30am:
| Lee: | 10.0% (317) |
| New York: | 13.9% (1,144,298) |
9am:
| Lee: | 5.5% (174) |
| New York: | 7.5% (614,475) |
10am:
| Lee: | 2.9% (93) |
| New York: | 7.2% (593,377) |
11am:
| Lee: | 2.3% (72) |
| New York: | 2.7% (224,011) |
12pm:
| Lee: | 0.8% (24) |
| New York: | 1.3% (105,049) |
4pm:
| Lee: | 9.8% (310) |
| New York: | 6.3% (517,309) |
>4pm:
| Lee: | 9.1% (288) |
| New York: | 6.1% (501,196) |
Travel time to work


Less than 5 minutes:
| Lee: | 1.4% (43) |
| New York: | 2.7% (219,036) |
5 to 9 minutes:
| Lee: | 5.1% (162) |
| New York: | 8.3% (680,270) |
10 to 14 minutes:
| Lee: | 15.7% (496) |
| New York: | 11.6% (956,590) |
15 to 19 minutes:
| Lee: | 23.1% (731) |
| New York: | 12.4% (1,020,084) |
20 to 24 minutes:
| Lee: | 17.7% (562) |
| New York: | 12.3% (1,013,757) |
25 to 29 minutes:
| Lee: | 4.6% (145) |
| New York: | 4.9% (399,384) |
30 to 34 minutes:
| Lee: | 9.6% (305) |
| New York: | 12.9% (1,058,688) |
35 to 39 minutes:
| Lee: | 3.2% (101) |
| New York: | 2.5% (203,722) |
40 to 44 minutes:
| Lee: | 4.5% (142) |
| New York: | 4.1% (340,311) |
45 to 59 minutes:
| Lee: | 8.2% (261) |
| New York: | 9.8% (806,556) |
60 to 89 minutes:
| Lee: | 2.0% (63) |
| New York: | 10.3% (848,185) |
90 or more minutes:
| Lee: | 2.1% (68) |
| New York: | 5.1% (417,464) |
Means of transportation to work


Drove car alone:
| Lee: | 85.4% (2,707) |
| New York: | 56.3% (4,620,178) |
Carpooled:
| Lee: | 9.8% (312) |
| New York: | 9.2% (756,918) |
Bus or trolley bus:
| Lee: | 0.1% (4) |
| New York: | 5.8% (475,389) |
Walked:
| Lee: | 1.4% (43) |
| New York: | 6.2% (511,721) |
Other means:
| Lee: | 0.4% (13) |
| New York: | 0.5% (40,375) |
Private vehicle occupancy

Drove alone:
| Lee: | 89.7% (2,707) |
| New York: | 85.9% (4,620,178) |
In 2 person carpool:
| Lee: | 9.2% (278) |
| New York: | 11.0% (590,255) |
In 3 person carpool:
| Lee: | 1.1% (34) |
| New York: | 1.8% (96,470) |
Class of workers
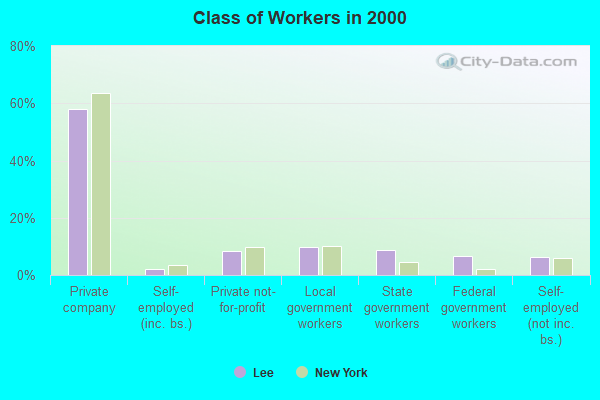
Employee of private company:
| Lee: | 57.8% (1,816) |
| New York: | 63.7% (5,340,134) |
Self-employed in own incorporated business:
| Lee: | 2.0% (64) |
| New York: | 3.4% (283,619) |
Private not-for-profit wage and salary workers:
| Lee: | 8.4% (265) |
| New York: | 9.7% (810,356) |
Local government workers:
| Lee: | 9.7% (305) |
| New York: | 10.2% (858,120) |
State government workers:
| Lee: | 8.7% (273) |
| New York: | 4.6% (383,673) |
Federal government workers:
| Lee: | 6.7% (211) |
| New York: | 2.2% (185,100) |
Self-employed workers in own not incorporated business:
| Lee: | 6.3% (199) |
| New York: | 6.0% (501,068) |
Unpaid family workers:
| Lee: | 0.2% (7) |
| New York: | 0.2% (20,918) |

Employee of private company - Males:
| Lee: | 65.2% (1,070) |
| New York: | 66.2% (2,902,064) |
Self-employed in own incorporated business - Males:
| Lee: | 2.7% (45) |
| New York: | 4.9% (215,651) |
Private not-for-profit wage and salary workers - Males:
| Lee: | 3.9% (64) |
| New York: | 6.3% (277,787) |
Local government workers - Males:
| Lee: | 5.2% (85) |
| New York: | 8.7% (380,426) |
State government workers - Males:
| Lee: | 7.5% (123) |
| New York: | 4.1% (181,784) |
Federal government workers - Males:
| Lee: | 7.1% (116) |
| New York: | 2.3% (102,647) |
Self-employed workers in own not incorporated business - Males:
| Lee: | 8.4% (137) |
| New York: | 7.1% (312,497) |

Employee of private company - Females:
| Lee: | 49.7% (746) |
| New York: | 60.9% (2,438,070) |
Self-employed in own incorporated business - Females:
| Lee: | 1.3% (19) |
| New York: | 1.7% (67,968) |
Private not-for-profit wage and salary workers - Females:
| Lee: | 13.4% (201) |
| New York: | 13.3% (532,569) |
Local government workers - Females:
| Lee: | 14.7% (220) |
| New York: | 11.9% (477,694) |
State government workers - Females:
| Lee: | 10.0% (150) |
| New York: | 5.0% (201,889) |
Federal government workers - Females:
| Lee: | 6.3% (95) |
| New York: | 2.1% (82,453) |
Self-employed workers in own not incorporated business - Females:
| Lee: | 4.1% (62) |
| New York: | 4.7% (188,571) |
Unpaid family workers - Females:
| Lee: | 0.5% (7) |
| New York: | 0.3% (11,448) |