Work and Jobs in Logan, Utah (UT) Detailed Stats
Occupations, Industries, Unemployment, Workers, Commute
Settings
X


Recent posts about work in Logan, Utah on our local forum with over 2,400,000 registered users:
 | low income young family moving to UT in a month (38 replies) |
| Nursing jobs, SLC and above? (5 replies) |
| Is moving to SLC without being LDS or have a job lined up a big mistake? (13 replies) |
| Help me decide on where to buy a vacation home in Utah (16 replies) |
| Any recommendations for apartment rentals in Logan/Brigham City/Ogden (4 replies) |
| Logan vs SLC (USU vs UU) (19 replies) |
Latest news about work in Logan, UT collected exclusively by city-data.com from local newspapers, TV, and radio stations
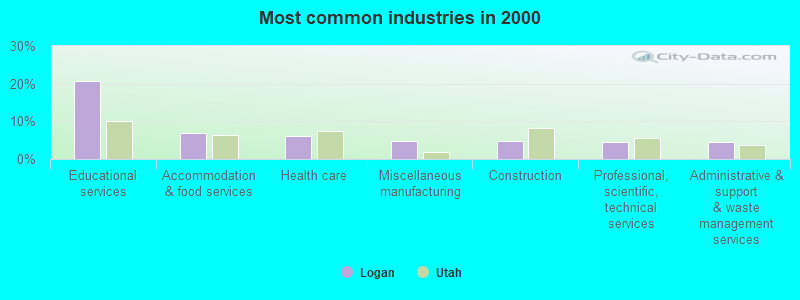
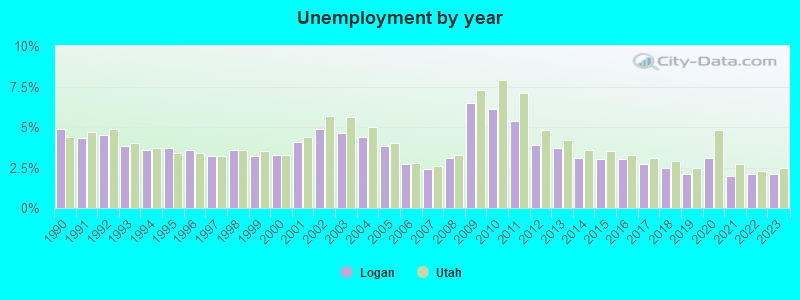
The unemployment rate in 2023 in Logan, UT was 2.1%, which was 19.0% less than the unemployment rate of 2.5% across the entire state of Utah. Compared to the unemployment rate of 3.7% in 2013, this represents a decrease of 76.2%. The most common industries in Logan are: Educational services (20.7% of civilian employees), Accommodation & food services (6.9% of civilian employees), Health care (6.2% of civilian employees). 94.4% of workers work in Cache County and 10.1% of all workers work at home. 72.6% of workers are employees of private companies, which is 6.3% greater than the rate of 68.0% across the entire state of Utah.
Whole page based on the data from 2000 / 2022 when the population of Logan, Utah was 42,670 / 55,522
Whole page based on the data from 2000 / 2022 when the population of Logan, Utah was 42,670 / 55,522
Most common industries
Most common industries | |||
|---|---|---|---|
Industry | All | Males | Females |
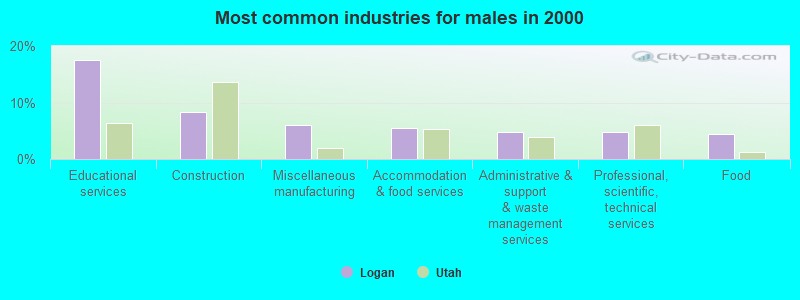
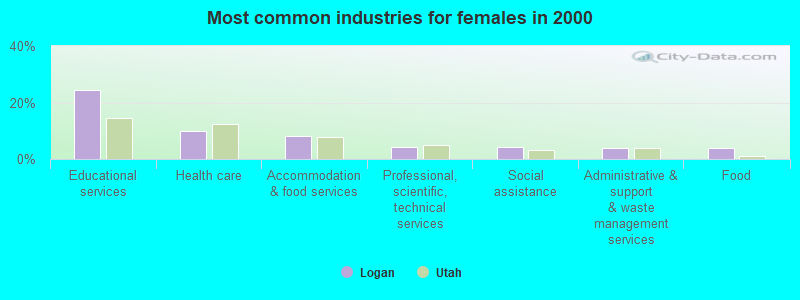
| Educational services | 20.7% (4,593) | 17.5% (2,039) | 24.3% (2,554) |
| Accommodation and food services | 6.9% (1,519) | 5.6% (647) | 8.3% (872) |
| Health care | 6.2% (1,370) | 2.7% (314) | 10.0% (1,056) |
| Miscellaneous manufacturing | 4.8% (1,067) | 5.9% (691) | 3.6% (376) |
| Construction | 4.7% (1,044) | 8.3% (960) | 0.8% (84) |
| Professional, scientific, and technical services | 4.5% (990) | 4.7% (549) | 4.2% (441) |
| Administrative and support and waste management services | 4.4% (979) | 4.8% (564) | 3.9% (415) |
| Food | 4.1% (913) | 4.4% (513) | 3.8% (400) |
| Arts, entertainment, and recreation | 2.7% (589) | 2.1% (250) | 3.2% (339) |
| Computer and electronic products | 2.4% (528) | 2.8% (324) | 1.9% (204) |
| Printing and related support activities | 2.2% (496) | 2.5% (289) | 2.0% (207) |
| Food and beverage stores | 2.2% (492) | 2.1% (248) | 2.3% (244) |
| Finance and insurance | 2.2% (489) | 2.0% (229) | 2.5% (260) |
| Social assistance | 2.2% (485) | 0.4% (45) | 4.2% (440) |
| Department and other general merchandise stores | 2.1% (470) | 1.8% (213) | 2.4% (257) |
| Transportation equipment | 2.1% (469) | 3.6% (422) | 0.4% (47) |
| Public administration | 1.8% (401) | 2.2% (261) | 1.3% (140) |
| Agriculture, forestry, fishing and hunting | 1.4% (303) | 2.2% (257) | 0.4% (46) |
| Repair and maintenance | 1.3% (297) | 2.2% (251) | 0.4% (46) |
| Real estate and rental and leasing | 1.3% (288) | 1.2% (140) | 1.4% (148) |
| Truck transportation | 1.3% (282) | 2.0% (236) | 0.4% (46) |
| Personal and laundry services | 1.1% (247) | 0.3% (38) | 2.0% (209) |
| Metal and metal products | 1.0% (231) | 1.7% (197) | 0.3% (34) |
| Publishing, and motion picture and sound recording industries | 0.9% (203) | 0.9% (107) | 0.9% (96) |
| Furniture and home furnishings, and household appliance stores | 0.9% (200) | 1.0% (111) | 0.8% (89) |
| Building material and garden equipment and supplies dealers | 0.9% (191) | 1.3% (147) | 0.4% (44) |
| Gasoline stations | 0.8% (186) | 0.9% (104) | 0.8% (82) |
| Wood products | 0.8% (180) | 0.9% (110) | 0.7% (70) |
| Motor vehicle and parts dealers | 0.8% (175) | 1.0% (113) | 0.6% (62) |
| Religious, grantmaking, civic, professional, and similar organizations | 0.8% (171) | 0.6% (72) | 0.9% (99) |
| Sporting goods, camera, and hobby and toy stores | 0.7% (161) | 0.3% (39) | 1.2% (122) |
| Used merchandise, gift, novelty, and souvenir, and other miscellaneous stores | 0.6% (135) | 0.1% (8) | 1.2% (127) |
| Plastics and rubber products | 0.6% (130) | 0.6% (74) | 0.5% (56) |
| Radio, TV, and computer stores | 0.6% (129) | 1.0% (122) | 0.1% (7) |
| Private households | 0.5% (106) | 0.0% (0) | 1.0% (106) |
| Electrical equipment, appliances, and components | 0.4% (96) | 0.6% (67) | 0.3% (29) |
| Chemicals | 0.4% (89) | 0.6% (74) | 0.1% (15) |
| Book stores and news dealers | 0.4% (88) | 0.0% (0) | 0.8% (88) |
| Data processing, libraries, and other information services | 0.4% (85) | 0.5% (63) | 0.2% (22) |
| Machinery | 0.4% (80) | 0.6% (74) | 0.1% (6) |
| Furniture and related product manufacturing | 0.4% (80) | 0.5% (62) | 0.2% (18) |
| Clothing and accessories, including shoe, stores | 0.3% (77) | 0.4% (44) | 0.3% (33) |
| Pharmacies and drug stores | 0.3% (76) | 0.3% (40) | 0.3% (36) |
| Electronic shopping and mail-order houses | 0.3% (74) | 0.1% (17) | 0.5% (57) |
| Other transportation, and support activities, and couriers | 0.3% (64) | 0.4% (47) | 0.2% (17) |
| Utilities | 0.3% (61) | 0.4% (44) | 0.2% (17) |
| Textile mills and textile products | 0.2% (53) | 0.3% (30) | 0.2% (23) |
| Broadcasting and telecommunications | 0.2% (52) | 0.4% (43) | 0.1% (9) |
| Electrical and electronic goods merchant wholesalers | 0.2% (50) | 0.3% (36) | 0.1% (14) |
| Apparel | 0.2% (48) | 0.0% (4) | 0.4% (44) |
| Health and personal care, except drug, stores | 0.2% (44) | 0.0% (0) | 0.4% (44) |
| Office supplies and stationery stores | 0.2% (44) | 0.3% (35) | 0.1% (9) |
| Sewing, needlework, and piece goods stores | 0.2% (41) | 0.1% (14) | 0.3% (27) |
| Other direct selling establishments | 0.2% (40) | 0.1% (10) | 0.3% (30) |
| Retail florists | 0.2% (35) | 0.1% (7) | 0.3% (28) |
| Jewelry, luggage, and leather goods stores | 0.1% (28) | 0.1% (10) | 0.2% (18) |
| Motor vehicles, parts and supplies merchant wholesalers | 0.1% (26) | 0.1% (16) | 0.1% (10) |
| Professional and commercial equipment and supplies merchant wholesalers | 0.1% (26) | 0.2% (20) | 0.1% (6) |
| Furniture and home furnishing merchant wholesalers | 0.1% (23) | 0.1% (7) | 0.2% (16) |
| Air transportation | 0.1% (20) | 0.2% (20) | 0.0% (0) |
| U. S. Postal service | 0.1% (20) | 0.2% (20) | 0.0% (0) |
| Hardware, plumbing and heating equipment, and supplies merchant wholesalers | 0.1% (18) | 0.2% (18) | 0.0% (0) |
| Drugs, sundries, and chemical and allied products merchant wholesalers | 0.1% (17) | 0.1% (17) | 0.0% (0) |
| Fuel dealers | 0.1% (14) | 0.1% (14) | 0.0% (0) |
| Machinery, equipment, and supplies merchant wholesalers | 0.1% (14) | 0.1% (14) | 0.0% (0) |
| Mining, quarrying, and oil and gas extraction | 0.1% (13) | 0.1% (13) | 0.0% (0) |
| Paper and paper products merchant wholesalers | 0.1% (12) | 0.1% (12) | 0.0% (0) |
Unemployment in Logan
- Unemployment by race in 2022
- Unemployment rate for White non-Hispanic residents
- 1.6%Males
- 2.3%Females
- Unemployment rate for Asian residents
- 1.1%Females
- Unemployment rate for two or more race residents
- 12.9%Males
- 2.6%Females
- Unemployment rate for Hispanic or Latino residents
- 5.1%Males
- 0.8%Females
- Unemployment by race in 2000
- Unemployment rate for White non-Hispanic residents
- 5.7%Males
- 6.4%Females
- Unemployment rate for Black residents
- 18.2%Males
- Unemployment rate for American Indian and Alaska Native residents
- 7.7%Males
- Unemployment rate for Asian residents
- 3.8%Males
- 4.0%Females
- Unemployment rate for other race residents
- 8.4%Males
- 12.8%Females
- Unemployment rate for two or more race residents
- 42.5%Males
- 46.5%Females
- Unemployment rate for Hispanic or Latino residents
- 7.9%Males
- 8.2%Females
Unemployment in 2023:
| Logan: | 2.1% |
| Utah: | 2.5% |
Unemployment in 2022:
| Logan: | 2.1% |
| Utah: | 2.3% |
Unemployment in 2021:
| Logan: | 2.0% |
| Utah: | 2.7% |
Unemployment in 2020:
| Logan: | 3.1% |
| Utah: | 4.8% |
Unemployment in 2019:
| Logan: | 2.1% |
| Utah: | 2.5% |
Unemployment in 2018:
| Logan: | 2.5% |
| Utah: | 2.9% |
Unemployment in 2017:
| Logan: | 2.7% |
| Utah: | 3.1% |
Unemployment in 2016:
| Logan: | 3.0% |
| Utah: | 3.3% |
Unemployment in 2015:
| Logan: | 3.0% |
| Utah: | 3.5% |
Unemployment in 2014:
| Logan: | 3.1% |
| Utah: | 3.6% |
Unemployment in 2013:
| Logan: | 3.7% |
| Utah: | 4.2% |
Unemployment in 2012:
| Logan: | 3.9% |
| Utah: | 4.8% |
Unemployment in 2011:
| Logan: | 5.4% |
| Utah: | 7.1% |
Unemployment in 2010:
| Logan: | 6.1% |
| Utah: | 7.9% |
Unemployment in 2009:
| Logan: | 6.5% |
| Utah: | 7.3% |
Unemployment in 2008:
| Logan: | 3.1% |
| Utah: | 3.3% |
Unemployment in 2007:
| Logan: | 2.4% |
| Utah: | 2.6% |
Unemployment in 2006:
| Logan: | 2.7% |
| Utah: | 2.8% |
Unemployment in 2005:
| Logan: | 3.8% |
| Utah: | 4.0% |
Unemployment in 2004:
| Logan: | 4.4% |
| Utah: | 5.0% |
Unemployment in 2003:
| Logan: | 4.6% |
| Utah: | 5.6% |
Unemployment in 2002:
| Logan: | 4.9% |
| Utah: | 5.7% |
Unemployment in 2001:
| Logan: | 4.1% |
| Utah: | 4.4% |
Unemployment in 2000:
| Logan: | 3.3% |
| Utah: | 3.3% |
Unemployment in 1999:
| Logan: | 3.2% |
| Utah: | 3.5% |
Unemployment in 1998:
| Logan: | 3.6% |
| Utah: | 3.6% |
Unemployment in 1997:
| Logan: | 3.2% |
| Utah: | 3.2% |
Unemployment in 1996:
| Logan: | 3.6% |
| Utah: | 3.4% |
Unemployment in 1995:
| Logan: | 3.7% |
| Utah: | 3.4% |
Unemployment in 1994:
| Logan: | 3.6% |
| Utah: | 3.7% |
Unemployment in 1993:
| Logan: | 3.8% |
| Utah: | 4.0% |
Unemployment in 1992:
| Logan: | 4.5% |
| Utah: | 4.9% |
Unemployment in 1991:
| Logan: | 4.3% |
| Utah: | 4.7% |
Unemployment in 1990:
| Logan: | 4.9% |
| Utah: | 4.4% |
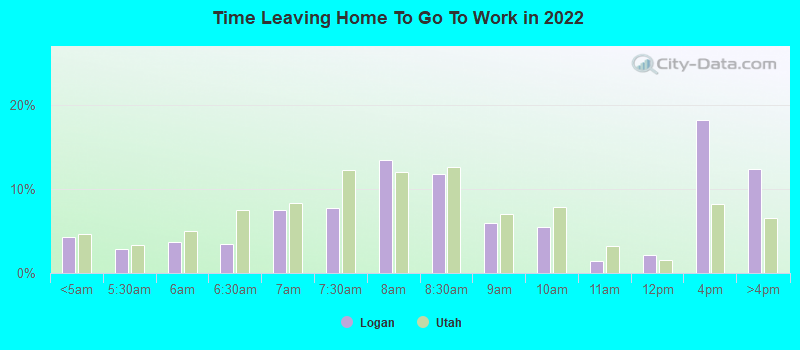
Time leaving home to go to work
12:00 a.m. to 4:59 a.m.:
| Logan: | 4.3% (1,182) |
| Utah: | 4.6% (65,402) |
5:00 a.m. to 5:29 a.m.:
| Logan: | 2.9% (803) |
| Utah: | 3.3% (46,230) |
5:30 a.m. to 5:59 a.m.:
| Logan: | 3.7% (1,029) |
| Utah: | 5.0% (70,703) |
6:00 a.m. to 6:29 a.m.:
| Logan: | 3.4% (946) |
| Utah: | 7.5% (106,014) |
6:30 a.m. to 6:59 a.m.:
| Logan: | 7.5% (2,088) |
| Utah: | 8.3% (116,899) |
7:00 a.m. to 7:29 a.m.:
| Logan: | 7.7% (2,143) |
| Utah: | 12.2% (171,911) |
7:30 a.m. to 7:59 a.m.:
| Logan: | 13.4% (3,717) |
| Utah: | 12.0% (168,559) |
8:00 a.m. to 8:29 a.m.:
| Logan: | 11.8% (3,278) |
| Utah: | 12.6% (177,854) |
8:30 a.m. to 8:59 a.m.:
| Logan: | 6.0% (1,659) |
| Utah: | 7.0% (98,031) |
9:00 a.m. to 9:59 a.m.:
| Logan: | 5.4% (1,509) |
| Utah: | 7.9% (110,519) |
10:00 a.m. to 10:59 a.m.:
| Logan: | 1.4% (388) |
| Utah: | 3.2% (45,072) |
11:00 a.m. to 11:59 a.m.:
| Logan: | 2.1% (594) |
| Utah: | 1.6% (22,413) |
12:00 p.m. to 3:59 p.m.:
| Logan: | 18.2% (5,040) |
| Utah: | 8.2% (115,811) |
4:00 p.m. to 11:59 p.m.:
| Logan: | 12.4% (3,435) |
| Utah: | 6.5% (91,789) |

<5am:
| Logan: | 4.0% (856) |
| Utah: | 3.4% (34,668) |
5:30am:
| Logan: | 1.9% (409) |
| Utah: | 2.6% (27,208) |
6am:
| Logan: | 3.5% (758) |
| Utah: | 4.9% (50,890) |
6:30am:
| Logan: | 3.7% (804) |
| Utah: | 6.9% (71,407) |
7am:
| Logan: | 5.9% (1,276) |
| Utah: | 9.6% (99,512) |
7:30am:
| Logan: | 7.7% (1,673) |
| Utah: | 12.2% (126,423) |
8am:
| Logan: | 13.2% (2,853) |
| Utah: | 14.5% (149,517) |
8:30am:
| Logan: | 11.9% (2,584) |
| Utah: | 10.4% (107,893) |
9am:
| Logan: | 6.0% (1,297) |
| Utah: | 5.7% (59,261) |
10am:
| Logan: | 6.7% (1,442) |
| Utah: | 5.8% (59,537) |
11am:
| Logan: | 3.7% (791) |
| Utah: | 2.6% (26,709) |
12pm:
| Logan: | 1.8% (396) |
| Utah: | 1.4% (14,712) |
4pm:
| Logan: | 15.7% (3,395) |
| Utah: | 8.5% (87,296) |
>4pm:
| Logan: | 11.3% (2,445) |
| Utah: | 7.2% (74,490) |

12:00 a.m. to 4:59 a.m. - Males:
| Logan: | 4.1% (631) |
| Utah: | 5.5% (44,081) |
5:00 a.m. to 5:29 a.m. - Males:
| Logan: | 2.9% (445) |
| Utah: | 3.9% (31,245) |
5:30 a.m. to 5:59 a.m. - Males:
| Logan: | 3.8% (580) |
| Utah: | 6.3% (50,369) |
6:00 a.m. to 6:29 a.m. - Males:
| Logan: | 3.5% (540) |
| Utah: | 9.3% (74,366) |
6:30 a.m. to 6:59 a.m. - Males:
| Logan: | 7.8% (1,197) |
| Utah: | 9.4% (75,243) |
7:00 a.m. to 7:29 a.m. - Males:
| Logan: | 11.9% (1,830) |
| Utah: | 12.2% (97,752) |
7:30 a.m. to 7:59 a.m. - Males:
| Logan: | 12.2% (1,864) |
| Utah: | 10.8% (86,306) |
8:00 a.m. to 8:29 a.m. - Males:
| Logan: | 8.7% (1,341) |
| Utah: | 11.9% (95,202) |
8:30 a.m. to 8:59 a.m. - Males:
| Logan: | 6.1% (935) |
| Utah: | 5.7% (45,602) |
9:00 a.m. to 9:59 a.m. - Males:
| Logan: | 4.9% (747) |
| Utah: | 6.7% (53,428) |
10:00 a.m. to 10:59 a.m. - Males:
| Logan: | 1.9% (290) |
| Utah: | 2.7% (21,311) |
11:00 a.m. to 11:59 a.m. - Males:
| Logan: | 2.5% (386) |
| Utah: | 1.4% (10,948) |
12:00 p.m. to 3:59 p.m. - Males:
| Logan: | 20.9% (3,200) |
| Utah: | 8.0% (63,596) |
4:00 p.m. to 11:59 p.m. - Males:
| Logan: | 9.5% (1,451) |
| Utah: | 6.2% (49,619) |

12:00 a.m. to 4:59 a.m. - Females:
| Logan: | 3.9% (480) |
| Utah: | 3.5% (21,321) |
5:00 a.m. to 5:29 a.m. - Females:
| Logan: | 2.4% (296) |
| Utah: | 2.5% (14,985) |
5:30 a.m. to 5:59 a.m. - Females:
| Logan: | 3.7% (455) |
| Utah: | 3.3% (20,334) |
6:00 a.m. to 6:29 a.m. - Females:
| Logan: | 3.1% (388) |
| Utah: | 5.2% (31,648) |
6:30 a.m. to 6:59 a.m. - Females:
| Logan: | 7.5% (923) |
| Utah: | 6.8% (41,656) |
7:00 a.m. to 7:29 a.m. - Females:
| Logan: | 3.3% (403) |
| Utah: | 12.2% (74,159) |
7:30 a.m. to 7:59 a.m. - Females:
| Logan: | 15.0% (1,850) |
| Utah: | 13.5% (82,253) |
8:00 a.m. to 8:29 a.m. - Females:
| Logan: | 15.4% (1,897) |
| Utah: | 13.6% (82,652) |
8:30 a.m. to 8:59 a.m. - Females:
| Logan: | 6.0% (743) |
| Utah: | 8.6% (52,429) |
9:00 a.m. to 9:59 a.m. - Females:
| Logan: | 6.2% (760) |
| Utah: | 9.4% (57,091) |
10:00 a.m. to 10:59 a.m. - Females:
| Logan: | 1.0% (124) |
| Utah: | 3.9% (23,761) |
11:00 a.m. to 11:59 a.m. - Females:
| Logan: | 1.8% (220) |
| Utah: | 1.9% (11,465) |
12:00 p.m. to 3:59 p.m. - Females:
| Logan: | 15.1% (1,861) |
| Utah: | 8.6% (52,215) |
4:00 p.m. to 11:59 p.m. - Females:
| Logan: | 16.2% (1,995) |
| Utah: | 6.9% (42,170) |
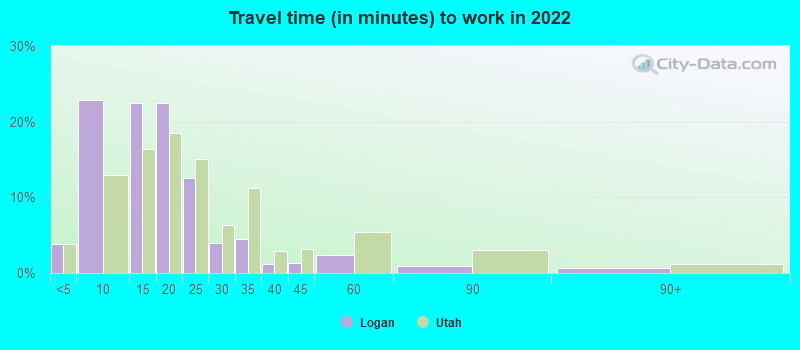
Travel time to work
Percentage of workers working in this county: 94.4%
Number of people working at home: 3,282 (10.1% of all workers)
Daytime population change due to commuting: +4,017 (+9.4%)
Workers who live and work in this city: 13,600 (62.8%)
Number of people working at home: 3,282 (10.1% of all workers)
Daytime population change due to commuting: +4,017 (+9.4%)
Workers who live and work in this city: 13,600 (62.8%)


Less than 5 minutes:
| Logan: | 3.9% (1,557) |
| Utah: | 3.9% (54,881) |
5 to 9 minutes:
| Logan: | 22.8% (9,225) |
| Utah: | 12.9% (181,846) |
10 to 14 minutes:
| Logan: | 22.5% (9,075) |
| Utah: | 16.4% (230,784) |
15 to 19 minutes:
| Logan: | 22.5% (9,100) |
| Utah: | 18.5% (260,237) |
20 to 24 minutes:
| Logan: | 12.5% (5,067) |
| Utah: | 15.0% (211,717) |
25 to 29 minutes:
| Logan: | 3.9% (1,578) |
| Utah: | 6.3% (89,127) |
30 to 34 minutes:
| Logan: | 4.5% (1,808) |
| Utah: | 11.2% (157,859) |
35 to 39 minutes:
| Logan: | 1.2% (469) |
| Utah: | 2.9% (40,646) |
40 to 44 minutes:
| Logan: | 1.3% (531) |
| Utah: | 3.2% (45,163) |
45 to 59 minutes:
| Logan: | 2.4% (963) |
| Utah: | 5.4% (76,466) |
60 to 89 minutes:
| Logan: | 0.9% (380) |
| Utah: | 3.1% (43,718) |
90 or more minutes:
| Logan: | 0.7% (276) |
| Utah: | 1.2% (17,404) |


Less than 5 minutes:
| Logan: | 7.0% (1,516) |
| Utah: | 4.2% (43,896) |
5 to 9 minutes:
| Logan: | 32.8% (7,102) |
| Utah: | 13.9% (143,317) |
10 to 14 minutes:
| Logan: | 28.5% (6,182) |
| Utah: | 16.9% (175,060) |
15 to 19 minutes:
| Logan: | 13.4% (2,895) |
| Utah: | 16.8% (173,076) |
20 to 24 minutes:
| Logan: | 4.8% (1,033) |
| Utah: | 14.6% (151,080) |
25 to 29 minutes:
| Logan: | 1.0% (218) |
| Utah: | 5.3% (54,800) |
30 to 34 minutes:
| Logan: | 3.2% (685) |
| Utah: | 10.8% (111,752) |
35 to 39 minutes:
| Logan: | 0.5% (107) |
| Utah: | 1.8% (18,540) |
40 to 44 minutes:
| Logan: | 0.7% (156) |
| Utah: | 2.3% (23,425) |
45 to 59 minutes:
| Logan: | 2.0% (438) |
| Utah: | 4.6% (47,093) |
60 to 89 minutes:
| Logan: | 1.7% (359) |
| Utah: | 3.0% (30,830) |
90 or more minutes:
| Logan: | 1.3% (288) |
| Utah: | 1.6% (16,654) |

Less than 5 minutes - Males:
| Logan: | 4.2% (964) |
| Utah: | 3.4% (27,499) |
5 to 9 minutes - Males:
| Logan: | 21.7% (4,954) |
| Utah: | 10.8% (86,479) |
10 to 14 minutes - Males:
| Logan: | 22.6% (5,158) |
| Utah: | 14.9% (118,960) |
15 to 19 minutes - Males:
| Logan: | 22.4% (5,103) |
| Utah: | 18.2% (145,668) |
20 to 24 minutes - Males:
| Logan: | 13.8% (3,142) |
| Utah: | 15.3% (122,379) |
25 to 29 minutes - Males:
| Logan: | 3.1% (708) |
| Utah: | 6.4% (51,286) |
30 to 34 minutes - Males:
| Logan: | 3.8% (863) |
| Utah: | 12.3% (98,589) |
35 to 39 minutes - Males:
| Logan: | 1.0% (238) |
| Utah: | 3.0% (24,278) |
40 to 44 minutes - Males:
| Logan: | 1.5% (333) |
| Utah: | 3.6% (28,616) |
45 to 59 minutes - Males:
| Logan: | 3.2% (719) |
| Utah: | 6.6% (52,847) |
60 to 89 minutes - Males:
| Logan: | 0.9% (205) |
| Utah: | 3.8% (30,647) |
90 or more minutes - Males:
| Logan: | 0.8% (190) |
| Utah: | 1.6% (13,102) |

Less than 5 minutes - Females:
| Logan: | 3.2% (569) |
| Utah: | 4.5% (27,382) |
5 to 9 minutes - Females:
| Logan: | 24.3% (4,270) |
| Utah: | 15.6% (95,367) |
10 to 14 minutes - Females:
| Logan: | 22.3% (3,916) |
| Utah: | 18.3% (111,824) |
15 to 19 minutes - Females:
| Logan: | 22.6% (3,978) |
| Utah: | 18.8% (114,569) |
20 to 24 minutes - Females:
| Logan: | 11.0% (1,926) |
| Utah: | 14.7% (89,338) |
25 to 29 minutes - Females:
| Logan: | 4.9% (863) |
| Utah: | 6.2% (37,841) |
30 to 34 minutes - Females:
| Logan: | 5.4% (957) |
| Utah: | 9.7% (59,270) |
35 to 39 minutes - Females:
| Logan: | 1.3% (232) |
| Utah: | 2.7% (16,368) |
40 to 44 minutes - Females:
| Logan: | 1.1% (199) |
| Utah: | 2.7% (16,547) |
45 to 59 minutes - Females:
| Logan: | 1.4% (240) |
| Utah: | 3.9% (23,619) |
60 to 89 minutes - Females:
| Logan: | 1.0% (178) |
| Utah: | 2.1% (13,071) |
90 or more minutes - Females:
| Logan: | 0.5% (88) |
| Utah: | 0.7% (4,302) |
Means of transportation to work
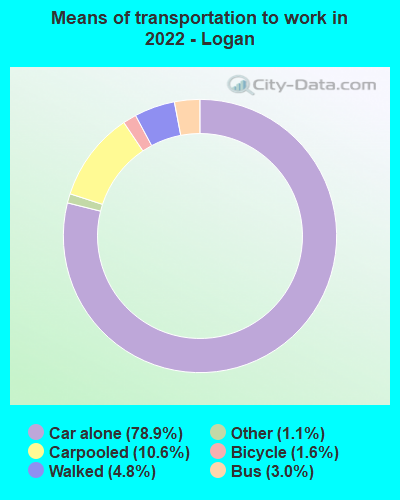
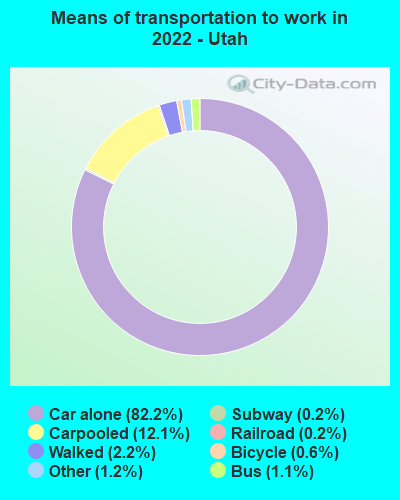
Drove car alone:
| Logan: | 78.9% (33,447) |
| Utah: | 82.2% (497,562) |
Carpooled:
| Logan: | 10.6% (4,515) |
| Utah: | 12.1% (77,098) |
Bus:
| Logan: | 3.0% (1,262) |
| Utah: | 1.1% (7,825) |
Bicycle:
| Logan: | 1.6% (680) |
| Utah: | 0.6% (2,212) |
Walked:
| Logan: | 4.8% (2,030) |
| Utah: | 2.2% (15,823) |
Other means:
| Logan: | 1.1% (460) |
| Utah: | 1.2% (6,223) |

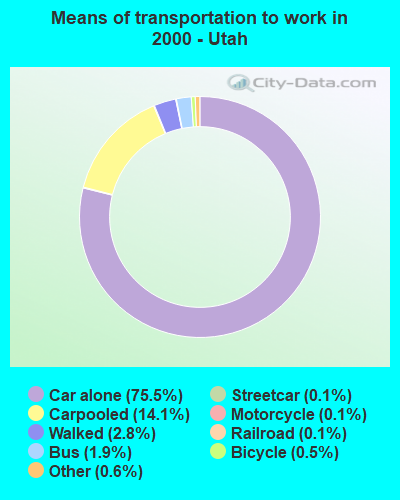
Drove car alone:
| Logan: | 70.3% (15,227) |
| Utah: | 75.5% (779,438) |
Carpooled:
| Logan: | 14.6% (3,165) |
| Utah: | 14.1% (145,950) |
Bus or trolley bus:
| Logan: | 2.8% (610) |
| Utah: | 1.9% (19,910) |
Motorcycle:
| Logan: | 0.3% (57) |
| Utah: | 0.1% (1,284) |
Bicycle:
| Logan: | 1.6% (350) |
| Utah: | 0.5% (5,267) |
Walked:
| Logan: | 7.0% (1,519) |
| Utah: | 2.8% (28,523) |
Other means:
| Logan: | 0.2% (51) |
| Utah: | 0.6% (5,862) |

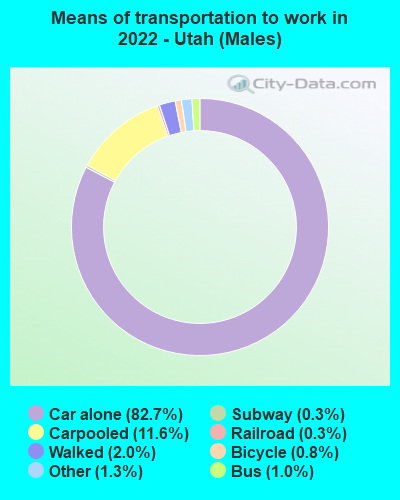
Drove car alone - Males:
| Logan: | 79.4% (18,771) |
| Utah: | 82.7% (497,562) |
Carpooled - Males:
| Logan: | 10.3% (2,427) |
| Utah: | 11.6% (77,098) |
Bus - Males:
| Logan: | 2.0% (471) |
| Utah: | 1.0% (7,825) |
Bicycle - Males:
| Logan: | 2.6% (620) |
| Utah: | 0.8% (2,212) |
Walked - Males:
| Logan: | 4.0% (944) |
| Utah: | 2.0% (15,823) |
Other means - Males:
| Logan: | 1.7% (397) |
| Utah: | 1.3% (6,223) |

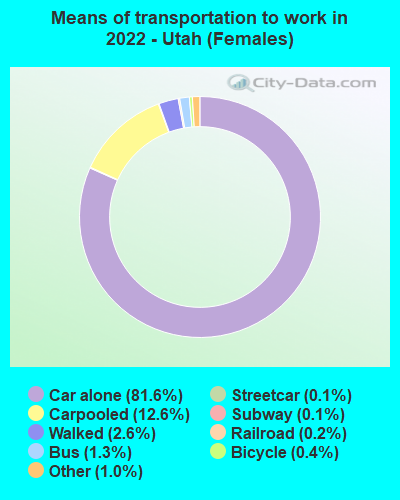
Drove car alone - Females:
| Logan: | 78.2% (14,676) |
| Utah: | 81.6% (497,562) |
Carpooled - Females:
| Logan: | 11.1% (2,083) |
| Utah: | 12.6% (77,098) |
Bus - Females:
| Logan: | 4.2% (781) |
| Utah: | 1.3% (7,825) |
Bicycle - Females:
| Logan: | 0.4% (70) |
| Utah: | 0.4% (2,212) |
Walked - Females:
| Logan: | 5.7% (1,077) |
| Utah: | 2.6% (15,823) |
Other means - Females:
| Logan: | 0.4% (69) |
| Utah: | 1.0% (6,223) |
Private vehicle occupancy

Drove alone:
| Logan: | 87.0% (20,178) |
| Utah: | 87.1% (1,155,419) |
In 2 person carpool:
| Logan: | 10.5% (2,436) |
| Utah: | 9.3% (123,426) |
In 3 person carpool:
| Logan: | 0.6% (150) |
| Utah: | 1.9% (25,612) |
In 4 person carpool:
| Logan: | 0.7% (160) |
| Utah: | 0.9% (12,017) |
In 5-6 person carpool:
| Logan: | 1.1% (247) |
| Utah: | 0.5% (6,917) |
In 7+ person carpool:
| Logan: | 0.1% (25) |
| Utah: | 0.2% (2,413) |

Drove alone:
| Logan: | 82.8% (15,227) |
| Utah: | 84.2% (779,438) |
In 2 person carpool:
| Logan: | 12.9% (2,374) |
| Utah: | 12.2% (112,575) |
In 3 person carpool:
| Logan: | 2.2% (407) |
| Utah: | 2.2% (19,966) |
In 4 person carpool:
| Logan: | 1.0% (177) |
| Utah: | 0.8% (7,439) |
In 5-6 person carpool:
| Logan: | 0.8% (154) |
| Utah: | 0.4% (3,682) |
In 7+ person carpool:
| Logan: | 0.3% (53) |
| Utah: | 0.2% (2,288) |
Class of workers
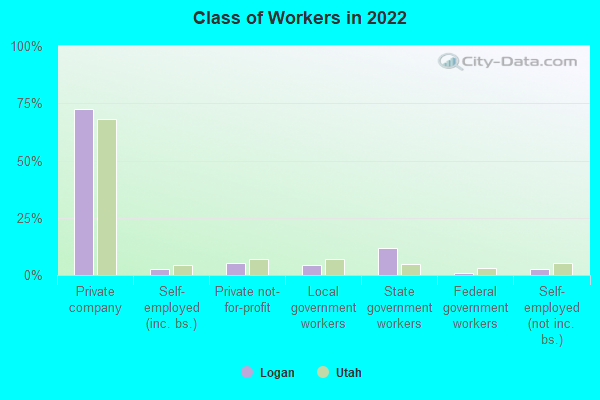
Employee of private company:
| Logan: | 72.6% (23,739) |
| Utah: | 68.0% (1,180,825) |
Self-employed in own incorporated business:
| Logan: | 2.5% (802) |
| Utah: | 4.5% (78,553) |
Private not-for-profit wage and salary workers:
| Logan: | 5.2% (1,689) |
| Utah: | 7.2% (124,989) |
Local government workers:
| Logan: | 4.3% (1,401) |
| Utah: | 7.1% (122,459) |
State government workers:
| Logan: | 11.7% (3,818) |
| Utah: | 5.0% (86,212) |
Federal government workers:
| Logan: | 1.0% (342) |
| Utah: | 2.9% (49,847) |
Self-employed workers in own not incorporated business:
| Logan: | 2.6% (859) |
| Utah: | 5.2% (89,932) |
Unpaid family workers:
| Logan: | 0.2% (60) |
| Utah: | 0.2% (3,037) |

Employee of private company:
| Logan: | 65.4% (14,477) |
| Utah: | 68.0% (709,966) |
Self-employed in own incorporated business:
| Logan: | 2.4% (541) |
| Utah: | 3.9% (40,428) |
Private not-for-profit wage and salary workers:
| Logan: | 6.1% (1,357) |
| Utah: | 6.3% (66,081) |
Local government workers:
| Logan: | 5.1% (1,135) |
| Utah: | 5.7% (59,805) |
State government workers:
| Logan: | 15.3% (3,378) |
| Utah: | 6.4% (66,879) |
Federal government workers:
| Logan: | 1.4% (300) |
| Utah: | 3.6% (37,312) |
Self-employed workers in own not incorporated business:
| Logan: | 4.1% (910) |
| Utah: | 5.8% (60,621) |
Unpaid family workers:
| Logan: | 0.2% (51) |
| Utah: | 0.3% (3,270) |

Employee of private company - Males:
| Logan: | 78.3% (13,589) |
| Utah: | 71.9% (694,651) |
Self-employed in own incorporated business - Males:
| Logan: | 3.8% (667) |
| Utah: | 5.5% (53,093) |
Private not-for-profit wage and salary workers - Males:
| Logan: | 3.1% (529) |
| Utah: | 5.5% (52,810) |
Local government workers - Males:
| Logan: | 2.4% (421) |
| Utah: | 4.6% (44,259) |
State government workers - Males:
| Logan: | 9.6% (1,663) |
| Utah: | 4.2% (40,155) |
Federal government workers - Males:
| Logan: | 0.9% (163) |
| Utah: | 3.2% (31,169) |
Self-employed workers in own not incorporated business - Males:
| Logan: | 1.8% (307) |
| Utah: | 5.1% (48,858) |
Unpaid family workers - Males:
| Logan: | 0.0% (9) |
| Utah: | 0.1% (1,356) |

Employee of private company - Females:
| Logan: | 66.1% (10,150) |
| Utah: | 63.2% (486,174) |
Self-employed in own incorporated business - Females:
| Logan: | 0.9% (135) |
| Utah: | 3.3% (25,460) |
Private not-for-profit wage and salary workers - Females:
| Logan: | 7.6% (1,160) |
| Utah: | 9.4% (72,179) |
Local government workers - Females:
| Logan: | 6.4% (979) |
| Utah: | 10.2% (78,200) |
State government workers - Females:
| Logan: | 14.0% (2,154) |
| Utah: | 6.0% (46,057) |
Federal government workers - Females:
| Logan: | 1.2% (179) |
| Utah: | 2.4% (18,678) |
Self-employed workers in own not incorporated business - Females:
| Logan: | 3.6% (552) |
| Utah: | 5.3% (41,074) |
Unpaid family workers - Females:
| Logan: | 0.3% (52) |
| Utah: | 0.2% (1,681) |