Work and Jobs in Manhattan, Kansas (KS) Detailed Stats
Occupations, Industries, Unemployment, Workers, Commute
Settings
X


Recent posts about work in Manhattan, Kansas on our local forum with over 2,400,000 registered users:
 | Manhattan Losing Jobs faster than Lawrence! (10 replies) |
| Tell me about Manhattan (19 replies) |
| Moving to Kansas-choices include Salina, Hutchinson, McPherson, Topeka, Lawrence, Wichita, Manhattan, and Garden City (7 replies) |
| Apartments in Manhattan, Kansas for working adults (3 replies) |
| Kansas Job Losses (390 replies) |
| Hays,KS/Ellis County- Low Unemployment story (4 replies) |
Latest news about work in Manhattan, KS collected exclusively by city-data.com from local newspapers, TV, and radio stations
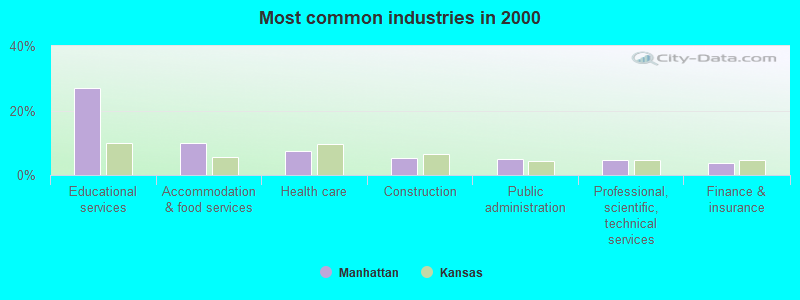
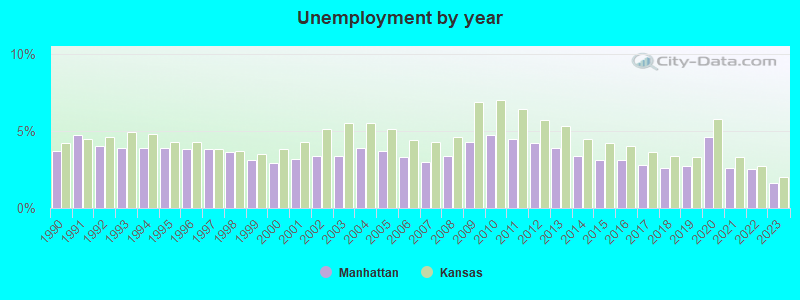
The unemployment rate in 2023 in Manhattan, KS was 1.6%, which was 25.0% less than the unemployment rate of 2.0% across the entire state of Kansas. Compared to the unemployment rate of 3.9% in 2013, this represents a decrease of 143.8%. The most common industries in Manhattan are: Educational services (27.1% of civilian employees), Accommodation & food services (9.8% of civilian employees), Health care (7.6% of civilian employees). 77.3% of workers work in Riley County and 11.5% of all workers work at home. 55.1% of workers are employees of private companies, which is 18.8% less than the rate of 65.5% across the entire state of Kansas.
Whole page based on the data from 2000 / 2022 when the population of Manhattan, Kansas was 44,831 / 53,536
Whole page based on the data from 2000 / 2022 when the population of Manhattan, Kansas was 44,831 / 53,536
Most common industries

Most common industries | |||
|---|---|---|---|
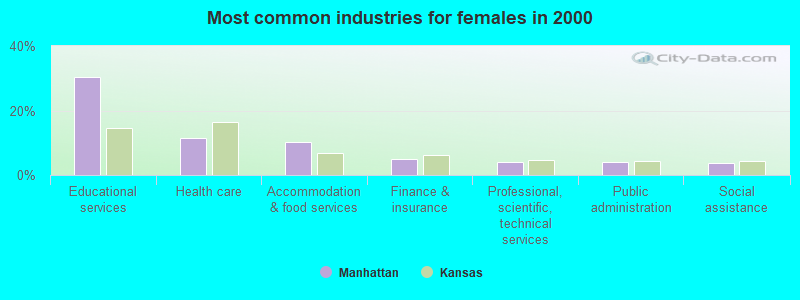
Industry | All | Males | Females |
| Educational services | 27.1% (6,425) | 24.1% (2,951) | 30.3% (3,474) |
| Accommodation and food services | 9.8% (2,336) | 9.4% (1,152) | 10.3% (1,184) |
| Health care | 7.6% (1,797) | 3.8% (463) | 11.6% (1,334) |
| Construction | 5.2% (1,242) | 9.4% (1,154) | 0.8% (88) |
| Public administration | 4.8% (1,142) | 5.6% (687) | 4.0% (455) |
| Professional, scientific, and technical services | 4.6% (1,081) | 4.9% (601) | 4.2% (480) |
| Finance and insurance | 3.9% (918) | 2.8% (341) | 5.0% (577) |
| Administrative and support and waste management services | 2.9% (690) | 3.9% (477) | 1.9% (213) |
| Food and beverage stores | 2.7% (637) | 2.9% (357) | 2.4% (280) |
| Department and other general merchandise stores | 2.6% (626) | 2.2% (269) | 3.1% (357) |
| Religious, grantmaking, civic, professional, and similar organizations | 2.3% (545) | 1.8% (224) | 2.8% (321) |
| Arts, entertainment, and recreation | 2.2% (515) | 2.2% (272) | 2.1% (243) |
| Social assistance | 1.9% (448) | 0.1% (18) | 3.7% (430) |
| Real estate and rental and leasing | 1.7% (409) | 1.7% (210) | 1.7% (199) |
| Personal and laundry services | 1.2% (287) | 0.5% (62) | 2.0% (225) |
| Agriculture, forestry, fishing and hunting | 1.2% (279) | 1.9% (238) | 0.4% (41) |
| Motor vehicle and parts dealers | 1.0% (244) | 1.6% (202) | 0.4% (42) |
| Broadcasting and telecommunications | 1.0% (240) | 1.5% (180) | 0.5% (60) |
| Clothing and accessories, including shoe, stores | 1.0% (239) | 0.8% (93) | 1.3% (146) |
| Book stores and news dealers | 0.9% (221) | 0.8% (99) | 1.1% (122) |
| Used merchandise, gift, novelty, and souvenir, and other miscellaneous stores | 0.9% (220) | 0.8% (92) | 1.1% (128) |
| Publishing, and motion picture and sound recording industries | 0.9% (216) | 0.7% (88) | 1.1% (128) |
| Repair and maintenance | 0.8% (189) | 1.4% (174) | 0.1% (15) |
| Building material and garden equipment and supplies dealers | 0.8% (188) | 1.3% (160) | 0.2% (28) |
| Printing and related support activities | 0.7% (174) | 0.9% (107) | 0.6% (67) |
| Sporting goods, camera, and hobby and toy stores | 0.7% (172) | 0.8% (97) | 0.7% (75) |
| Data processing, libraries, and other information services | 0.7% (157) | 0.5% (67) | 0.8% (90) |
| Other transportation, and support activities, and couriers | 0.5% (115) | 0.7% (91) | 0.2% (24) |
| Private households | 0.5% (108) | 0.1% (13) | 0.8% (95) |
| Radio, TV, and computer stores | 0.4% (102) | 0.7% (89) | 0.1% (13) |
| Food | 0.4% (101) | 0.5% (59) | 0.4% (42) |
| Music stores | 0.4% (98) | 0.6% (68) | 0.3% (30) |
| Utilities | 0.4% (88) | 0.5% (63) | 0.2% (25) |
| U. S. Postal service | 0.4% (88) | 0.6% (74) | 0.1% (14) |
| Furniture and home furnishings, and household appliance stores | 0.3% (83) | 0.4% (49) | 0.3% (34) |
| Other direct selling establishments | 0.3% (79) | 0.3% (41) | 0.3% (38) |
| Metal and metal products | 0.3% (76) | 0.5% (64) | 0.1% (12) |
| Plastics and rubber products | 0.3% (70) | 0.6% (70) | 0.0% (0) |
| Miscellaneous manufacturing | 0.3% (68) | 0.1% (8) | 0.5% (60) |
| Truck transportation | 0.3% (62) | 0.5% (57) | 0.0% (5) |
| Metals and minerals, except petroleum, merchant wholesalers | 0.3% (61) | 0.4% (53) | 0.1% (8) |
| Gasoline stations | 0.2% (58) | 0.2% (20) | 0.3% (38) |
| Office supplies and stationery stores | 0.2% (56) | 0.4% (49) | 0.1% (7) |
| Machinery | 0.2% (53) | 0.4% (48) | 0.0% (5) |
| Jewelry, luggage, and leather goods stores | 0.2% (50) | 0.2% (26) | 0.2% (24) |
| Health and personal care, except drug, stores | 0.2% (45) | 0.1% (15) | 0.3% (30) |
| Computer and electronic products | 0.2% (44) | 0.2% (29) | 0.1% (15) |
| Warehousing and storage | 0.2% (42) | 0.3% (34) | 0.1% (8) |
| Transportation equipment | 0.2% (40) | 0.3% (33) | 0.1% (7) |
| Nonmetallic mineral products | 0.2% (37) | 0.3% (37) | 0.0% (0) |
| Pharmacies and drug stores | 0.1% (35) | 0.1% (12) | 0.2% (23) |
| Professional and commercial equipment and supplies merchant wholesalers | 0.1% (35) | 0.3% (35) | 0.0% (0) |
| Motor vehicles, parts and supplies merchant wholesalers | 0.1% (34) | 0.3% (34) | 0.0% (0) |
| Groceries and related products merchant wholesalers | 0.1% (31) | 0.3% (31) | 0.0% (0) |
| Retail florists | 0.1% (29) | 0.0% (0) | 0.3% (29) |
| Electronic shopping and mail-order houses | 0.1% (29) | 0.1% (9) | 0.2% (20) |
| Miscellaneous nondurable goods merchant wholesalers | 0.1% (28) | 0.1% (12) | 0.1% (16) |
| Farm supplies merchant wholesalers | 0.1% (27) | 0.2% (20) | 0.1% (7) |
| Furniture and related product manufacturing | 0.1% (26) | 0.2% (26) | 0.0% (0) |
| Machinery, equipment, and supplies merchant wholesalers | 0.1% (23) | 0.1% (17) | 0.1% (6) |
| Electrical equipment, appliances, and components | 0.1% (20) | 0.2% (20) | 0.0% (0) |
| Mining, quarrying, and oil and gas extraction | 0.1% (19) | 0.2% (19) | 0.0% (0) |
| Alcoholic beverages merchant wholesalers | 0.1% (15) | 0.1% (15) | 0.0% (0) |
| Air transportation | 0.1% (13) | 0.1% (13) | 0.0% (0) |
Unemployment in Manhattan
- Unemployment by race in 2022
- Unemployment rate for White non-Hispanic residents
- 3.7%Males
- 2.1%Females
- Unemployment rate for Black residents
- 8.2%Males
- 10.7%Females
- Unemployment rate for American Indian and Alaska Native residents
- 0.5%Males
- Unemployment rate for Asian residents
- 1.8%Males
- 4.7%Females
- Unemployment rate for other race residents
- 3.4%Males
- Unemployment rate for two or more race residents
- 9.2%Males
- 4.9%Females
- Unemployment rate for Hispanic or Latino residents
- 3.9%Males
- 0.3%Females
- Unemployment by race in 2000
- Unemployment rate for White non-Hispanic residents
- 7.6%Males
- 6.5%Females
- Unemployment rate for Black residents
- 8.1%Males
- 14.0%Females
- Unemployment rate for American Indian and Alaska Native residents
- 22.5%Males
- 48.5%Females
- Unemployment rate for Asian residents
- 3.1%Males
- 11.5%Females
- Unemployment rate for other race residents
- 13.0%Males
- 21.2%Females
- Unemployment rate for two or more race residents
- 5.7%Males
- 5.7%Females
- Unemployment rate for Hispanic or Latino residents
- 5.4%Males
- 12.7%Females
Unemployment in 2023:
| Manhattan: | 1.6% |
| Kansas: | 2.0% |
Unemployment in 2022:
| Manhattan: | 2.5% |
| Kansas: | 2.7% |
Unemployment in 2021:
| Manhattan: | 2.6% |
| Kansas: | 3.3% |
Unemployment in 2020:
| Manhattan: | 4.6% |
| Kansas: | 5.8% |
Unemployment in 2019:
| Manhattan: | 2.7% |
| Kansas: | 3.3% |
Unemployment in 2018:
| Manhattan: | 2.6% |
| Kansas: | 3.4% |
Unemployment in 2017:
| Manhattan: | 2.8% |
| Kansas: | 3.6% |
Unemployment in 2016:
| Manhattan: | 3.1% |
| Kansas: | 4.0% |
Unemployment in 2015:
| Manhattan: | 3.1% |
| Kansas: | 4.2% |
Unemployment in 2014:
| Manhattan: | 3.4% |
| Kansas: | 4.5% |
Unemployment in 2013:
| Manhattan: | 3.9% |
| Kansas: | 5.3% |
Unemployment in 2012:
| Manhattan: | 4.2% |
| Kansas: | 5.7% |
Unemployment in 2011:
| Manhattan: | 4.5% |
| Kansas: | 6.4% |
Unemployment in 2010:
| Manhattan: | 4.7% |
| Kansas: | 7.0% |
Unemployment in 2009:
| Manhattan: | 4.3% |
| Kansas: | 6.9% |
Unemployment in 2008:
| Manhattan: | 3.4% |
| Kansas: | 4.6% |
Unemployment in 2007:
| Manhattan: | 3.0% |
| Kansas: | 4.3% |
Unemployment in 2006:
| Manhattan: | 3.3% |
| Kansas: | 4.4% |
Unemployment in 2005:
| Manhattan: | 3.7% |
| Kansas: | 5.1% |
Unemployment in 2004:
| Manhattan: | 3.9% |
| Kansas: | 5.5% |
Unemployment in 2003:
| Manhattan: | 3.4% |
| Kansas: | 5.5% |
Unemployment in 2002:
| Manhattan: | 3.4% |
| Kansas: | 5.1% |
Unemployment in 2001:
| Manhattan: | 3.2% |
| Kansas: | 4.3% |
Unemployment in 2000:
| Manhattan: | 2.9% |
| Kansas: | 3.8% |
Unemployment in 1999:
| Manhattan: | 3.1% |
| Kansas: | 3.5% |
Unemployment in 1998:
| Manhattan: | 3.6% |
| Kansas: | 3.7% |
Unemployment in 1997:
| Manhattan: | 3.8% |
| Kansas: | 3.8% |
Unemployment in 1996:
| Manhattan: | 3.8% |
| Kansas: | 4.3% |
Unemployment in 1995:
| Manhattan: | 3.9% |
| Kansas: | 4.3% |
Unemployment in 1994:
| Manhattan: | 3.9% |
| Kansas: | 4.8% |
Unemployment in 1993:
| Manhattan: | 3.9% |
| Kansas: | 4.9% |
Unemployment in 1992:
| Manhattan: | 4.0% |
| Kansas: | 4.6% |
Unemployment in 1991:
| Manhattan: | 4.7% |
| Kansas: | 4.5% |
Unemployment in 1990:
| Manhattan: | 3.7% |
| Kansas: | 4.2% |
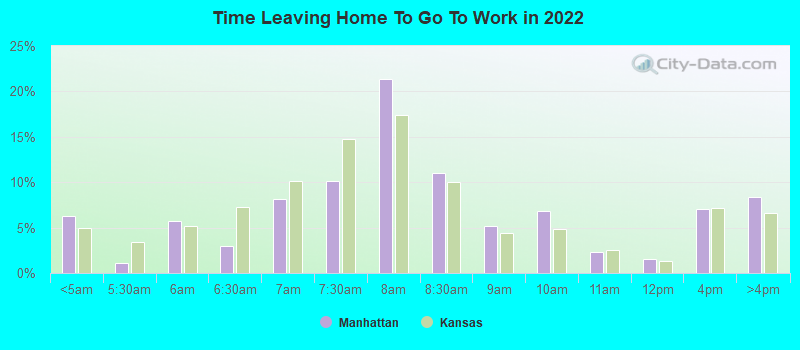
Time leaving home to go to work
12:00 a.m. to 4:59 a.m.:
| Manhattan: | 6.2% (1,586) |
| Kansas: | 5.0% (63,464) |
5:00 a.m. to 5:29 a.m.:
| Manhattan: | 1.1% (288) |
| Kansas: | 3.4% (43,978) |
5:30 a.m. to 5:59 a.m.:
| Manhattan: | 5.8% (1,471) |
| Kansas: | 5.1% (65,540) |
6:00 a.m. to 6:29 a.m.:
| Manhattan: | 3.0% (767) |
| Kansas: | 7.3% (93,495) |
6:30 a.m. to 6:59 a.m.:
| Manhattan: | 8.1% (2,067) |
| Kansas: | 10.2% (129,994) |
7:00 a.m. to 7:29 a.m.:
| Manhattan: | 10.1% (2,569) |
| Kansas: | 14.8% (188,435) |
7:30 a.m. to 7:59 a.m.:
| Manhattan: | 21.4% (5,440) |
| Kansas: | 17.4% (221,699) |
8:00 a.m. to 8:29 a.m.:
| Manhattan: | 11.0% (2,788) |
| Kansas: | 10.0% (127,374) |
8:30 a.m. to 8:59 a.m.:
| Manhattan: | 5.2% (1,312) |
| Kansas: | 4.4% (56,175) |
9:00 a.m. to 9:59 a.m.:
| Manhattan: | 6.8% (1,740) |
| Kansas: | 4.9% (62,230) |
10:00 a.m. to 10:59 a.m.:
| Manhattan: | 2.4% (600) |
| Kansas: | 2.5% (31,968) |
11:00 a.m. to 11:59 a.m.:
| Manhattan: | 1.5% (393) |
| Kansas: | 1.4% (17,384) |
12:00 p.m. to 3:59 p.m.:
| Manhattan: | 7.1% (1,804) |
| Kansas: | 7.1% (90,847) |
4:00 p.m. to 11:59 p.m.:
| Manhattan: | 8.3% (2,116) |
| Kansas: | 6.6% (83,997) |

<5am:
| Manhattan: | 1.3% (328) |
| Kansas: | 2.8% (37,001) |
5:30am:
| Manhattan: | 1.5% (369) |
| Kansas: | 2.2% (29,449) |
6am:
| Manhattan: | 3.5% (840) |
| Kansas: | 4.0% (52,725) |
6:30am:
| Manhattan: | 3.9% (960) |
| Kansas: | 7.1% (93,264) |
7am:
| Manhattan: | 6.3% (1,539) |
| Kansas: | 10.3% (135,647) |
7:30am:
| Manhattan: | 10.1% (2,456) |
| Kansas: | 15.1% (198,358) |
8am:
| Manhattan: | 19.4% (4,705) |
| Kansas: | 19.7% (258,625) |
8:30am:
| Manhattan: | 11.9% (2,903) |
| Kansas: | 9.8% (127,994) |
9am:
| Manhattan: | 5.3% (1,290) |
| Kansas: | 4.2% (54,906) |
10am:
| Manhattan: | 6.9% (1,669) |
| Kansas: | 4.3% (56,570) |
11am:
| Manhattan: | 3.2% (784) |
| Kansas: | 1.9% (24,928) |
12pm:
| Manhattan: | 1.9% (473) |
| Kansas: | 0.9% (12,131) |
4pm:
| Manhattan: | 10.6% (2,575) |
| Kansas: | 6.7% (88,226) |
>4pm:
| Manhattan: | 11.2% (2,721) |
| Kansas: | 6.8% (89,657) |

12:00 a.m. to 4:59 a.m. - Males:
| Manhattan: | 3.9% (516) |
| Kansas: | 6.4% (44,516) |
5:00 a.m. to 5:29 a.m. - Males:
| Manhattan: | 1.7% (229) |
| Kansas: | 4.2% (28,841) |
5:30 a.m. to 5:59 a.m. - Males:
| Manhattan: | 7.8% (1,039) |
| Kansas: | 6.5% (45,470) |
6:00 a.m. to 6:29 a.m. - Males:
| Manhattan: | 3.2% (430) |
| Kansas: | 8.8% (61,038) |
6:30 a.m. to 6:59 a.m. - Males:
| Manhattan: | 10.7% (1,434) |
| Kansas: | 11.2% (77,567) |
7:00 a.m. to 7:29 a.m. - Males:
| Manhattan: | 13.5% (1,809) |
| Kansas: | 14.2% (98,880) |
7:30 a.m. to 7:59 a.m. - Males:
| Manhattan: | 19.2% (2,578) |
| Kansas: | 15.0% (103,955) |
8:00 a.m. to 8:29 a.m. - Males:
| Manhattan: | 9.6% (1,289) |
| Kansas: | 9.4% (65,252) |
8:30 a.m. to 8:59 a.m. - Males:
| Manhattan: | 3.7% (500) |
| Kansas: | 3.7% (25,451) |
9:00 a.m. to 9:59 a.m. - Males:
| Manhattan: | 5.8% (776) |
| Kansas: | 4.1% (28,753) |
10:00 a.m. to 10:59 a.m. - Males:
| Manhattan: | 1.8% (238) |
| Kansas: | 2.0% (14,209) |
11:00 a.m. to 11:59 a.m. - Males:
| Manhattan: | 1.9% (258) |
| Kansas: | 1.2% (8,088) |
12:00 p.m. to 3:59 p.m. - Males:
| Manhattan: | 8.2% (1,092) |
| Kansas: | 7.0% (48,896) |
4:00 p.m. to 11:59 p.m. - Males:
| Manhattan: | 9.8% (1,315) |
| Kansas: | 6.3% (43,801) |

12:00 a.m. to 4:59 a.m. - Females:
| Manhattan: | 9.7% (1,173) |
| Kansas: | 3.3% (18,948) |
5:00 a.m. to 5:29 a.m. - Females:
| Manhattan: | 2.1% (247) |
| Kansas: | 2.6% (15,137) |
5:30 a.m. to 5:59 a.m. - Females:
| Manhattan: | 4.4% (533) |
| Kansas: | 3.4% (20,070) |
6:00 a.m. to 6:29 a.m. - Females:
| Manhattan: | 3.3% (402) |
| Kansas: | 5.6% (32,457) |
6:30 a.m. to 6:59 a.m. - Females:
| Manhattan: | 5.2% (621) |
| Kansas: | 9.0% (52,427) |
7:00 a.m. to 7:29 a.m. - Females:
| Manhattan: | 6.6% (795) |
| Kansas: | 15.4% (89,555) |
7:30 a.m. to 7:59 a.m. - Females:
| Manhattan: | 23.7% (2,860) |
| Kansas: | 20.2% (117,744) |
8:00 a.m. to 8:29 a.m. - Females:
| Manhattan: | 12.4% (1,498) |
| Kansas: | 10.7% (62,122) |
8:30 a.m. to 8:59 a.m. - Females:
| Manhattan: | 6.9% (833) |
| Kansas: | 5.3% (30,724) |
9:00 a.m. to 9:59 a.m. - Females:
| Manhattan: | 8.0% (961) |
| Kansas: | 5.8% (33,477) |
10:00 a.m. to 10:59 a.m. - Females:
| Manhattan: | 2.9% (353) |
| Kansas: | 3.1% (17,759) |
11:00 a.m. to 11:59 a.m. - Females:
| Manhattan: | 1.0% (121) |
| Kansas: | 1.6% (9,296) |
12:00 p.m. to 3:59 p.m. - Females:
| Manhattan: | 5.8% (701) |
| Kansas: | 7.2% (41,951) |
4:00 p.m. to 11:59 p.m. - Females:
| Manhattan: | 6.3% (758) |
| Kansas: | 6.9% (40,196) |
Travel time to work
Percentage of workers working in this county: 77.3%
Number of people working at home: 3,349 (11.5% of all workers)
Daytime population change due to commuting: +2,779 (+6.2%)
Workers who live and work in this city: 18,791 (77.3%)
Number of people working at home: 3,349 (11.5% of all workers)
Daytime population change due to commuting: +2,779 (+6.2%)
Workers who live and work in this city: 18,791 (77.3%)

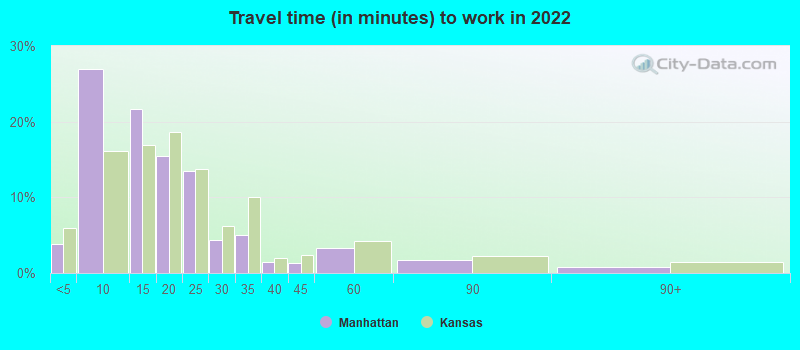

Less than 5 minutes:
| Manhattan: | 3.8% (1,186) |
| Kansas: | 5.9% (77,030) |
5 to 9 minutes:
| Manhattan: | 26.9% (8,329) |
| Kansas: | 16.2% (209,820) |
10 to 14 minutes:
| Manhattan: | 21.7% (6,715) |
| Kansas: | 16.9% (219,769) |
15 to 19 minutes:
| Manhattan: | 15.5% (4,797) |
| Kansas: | 18.7% (242,157) |
20 to 24 minutes:
| Manhattan: | 13.5% (4,165) |
| Kansas: | 13.7% (177,779) |
25 to 29 minutes:
| Manhattan: | 4.3% (1,335) |
| Kansas: | 6.2% (81,075) |
30 to 34 minutes:
| Manhattan: | 5.0% (1,553) |
| Kansas: | 10.0% (129,794) |
35 to 39 minutes:
| Manhattan: | 1.4% (431) |
| Kansas: | 2.0% (26,304) |
40 to 44 minutes:
| Manhattan: | 1.4% (427) |
| Kansas: | 2.4% (30,598) |
45 to 59 minutes:
| Manhattan: | 3.3% (1,023) |
| Kansas: | 4.2% (54,542) |
60 to 89 minutes:
| Manhattan: | 1.7% (536) |
| Kansas: | 2.3% (30,000) |
90 or more minutes:
| Manhattan: | 0.8% (262) |
| Kansas: | 1.5% (19,203) |


Less than 5 minutes:
| Manhattan: | 8.0% (1,951) |
| Kansas: | 6.1% (79,963) |
5 to 9 minutes:
| Manhattan: | 28.7% (6,968) |
| Kansas: | 16.8% (220,956) |
10 to 14 minutes:
| Manhattan: | 28.9% (7,038) |
| Kansas: | 18.6% (244,433) |
15 to 19 minutes:
| Manhattan: | 13.1% (3,195) |
| Kansas: | 16.9% (221,991) |
20 to 24 minutes:
| Manhattan: | 6.3% (1,536) |
| Kansas: | 13.5% (177,293) |
25 to 29 minutes:
| Manhattan: | 3.0% (737) |
| Kansas: | 4.9% (64,184) |
30 to 34 minutes:
| Manhattan: | 4.2% (1,017) |
| Kansas: | 9.0% (118,138) |
35 to 39 minutes:
| Manhattan: | 0.3% (71) |
| Kansas: | 1.6% (21,204) |
40 to 44 minutes:
| Manhattan: | 0.1% (25) |
| Kansas: | 1.7% (22,394) |
45 to 59 minutes:
| Manhattan: | 1.1% (257) |
| Kansas: | 3.4% (44,713) |
60 to 89 minutes:
| Manhattan: | 1.9% (470) |
| Kansas: | 2.0% (26,173) |
90 or more minutes:
| Manhattan: | 1.4% (347) |
| Kansas: | 1.4% (18,039) |

Less than 5 minutes - Males:
| Manhattan: | 4.5% (701) |
| Kansas: | 5.7% (40,477) |
5 to 9 minutes - Males:
| Manhattan: | 27.2% (4,275) |
| Kansas: | 14.8% (104,178) |
10 to 14 minutes - Males:
| Manhattan: | 22.4% (3,524) |
| Kansas: | 16.5% (116,315) |
15 to 19 minutes - Males:
| Manhattan: | 12.2% (1,915) |
| Kansas: | 18.8% (132,383) |
20 to 24 minutes - Males:
| Manhattan: | 14.7% (2,318) |
| Kansas: | 13.7% (96,260) |
25 to 29 minutes - Males:
| Manhattan: | 4.8% (755) |
| Kansas: | 6.2% (43,841) |
30 to 34 minutes - Males:
| Manhattan: | 5.3% (840) |
| Kansas: | 10.4% (73,213) |
35 to 39 minutes - Males:
| Manhattan: | 1.4% (223) |
| Kansas: | 2.1% (15,002) |
40 to 44 minutes - Males:
| Manhattan: | 0.7% (110) |
| Kansas: | 2.5% (17,822) |
45 to 59 minutes - Males:
| Manhattan: | 3.1% (485) |
| Kansas: | 4.6% (32,485) |
60 to 89 minutes - Males:
| Manhattan: | 2.7% (420) |
| Kansas: | 2.7% (18,879) |
90 or more minutes - Males:
| Manhattan: | 2.7% (429) |
| Kansas: | 1.9% (13,513) |

Less than 5 minutes - Females:
| Manhattan: | 3.1% (470) |
| Kansas: | 6.2% (36,553) |
5 to 9 minutes - Females:
| Manhattan: | 26.8% (4,076) |
| Kansas: | 17.8% (105,642) |
10 to 14 minutes - Females:
| Manhattan: | 21.0% (3,187) |
| Kansas: | 17.4% (103,454) |
15 to 19 minutes - Females:
| Manhattan: | 19.1% (2,898) |
| Kansas: | 18.5% (109,774) |
20 to 24 minutes - Females:
| Manhattan: | 12.1% (1,844) |
| Kansas: | 13.7% (81,519) |
25 to 29 minutes - Females:
| Manhattan: | 3.7% (570) |
| Kansas: | 6.3% (37,234) |
30 to 34 minutes - Females:
| Manhattan: | 4.7% (711) |
| Kansas: | 9.5% (56,581) |
35 to 39 minutes - Females:
| Manhattan: | 1.4% (210) |
| Kansas: | 1.9% (11,302) |
40 to 44 minutes - Females:
| Manhattan: | 2.9% (446) |
| Kansas: | 2.2% (12,776) |
45 to 59 minutes - Females:
| Manhattan: | 3.5% (539) |
| Kansas: | 3.7% (22,057) |
60 to 89 minutes - Females:
| Manhattan: | 0.8% (117) |
| Kansas: | 1.9% (11,121) |
90 or more minutes - Females:
| Manhattan: | 0.7% (105) |
| Kansas: | 1.0% (5,690) |
Means of transportation to work
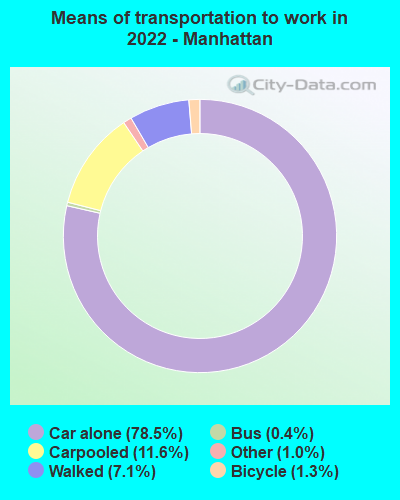
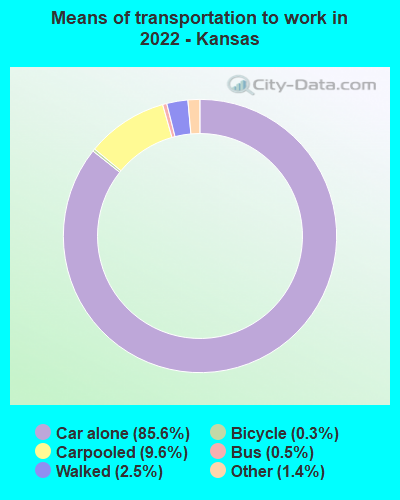
Drove car alone:
| Manhattan: | 78.5% (25,057) |
| Kansas: | 85.6% (506,388) |
Carpooled:
| Manhattan: | 11.6% (3,717) |
| Kansas: | 9.6% (61,019) |
Bus:
| Manhattan: | 0.4% (134) |
| Kansas: | 0.5% (3,531) |
Subway or elevated rail:
| Manhattan: | 0.0% (13) |
| Kansas: | 0.0% (81) |
Bicycle:
| Manhattan: | 1.3% (425) |
| Kansas: | 0.3% (1,401) |
Walked:
| Manhattan: | 7.1% (2,272) |
| Kansas: | 2.5% (12,980) |
Other means:
| Manhattan: | 1.0% (319) |
| Kansas: | 1.4% (8,088) |

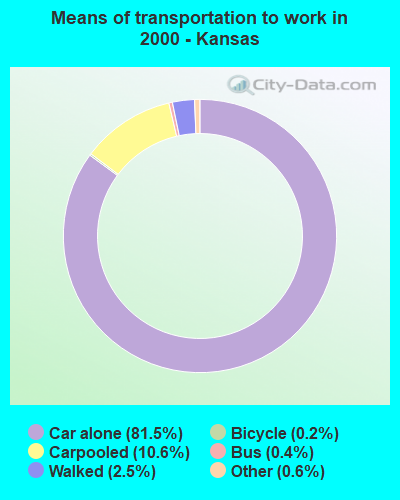
Drove car alone:
| Manhattan: | 75.2% (18,295) |
| Kansas: | 81.5% (1,068,501) |
Carpooled:
| Manhattan: | 8.6% (2,087) |
| Kansas: | 10.6% (139,348) |
Bus or trolley bus:
| Manhattan: | 0.1% (30) |
| Kansas: | 0.4% (5,269) |
Taxicab:
| Manhattan: | 0.1% (15) |
| Kansas: | 0.1% (797) |
Motorcycle:
| Manhattan: | 0.2% (39) |
| Kansas: | 0.1% (1,102) |
Bicycle:
| Manhattan: | 1.6% (381) |
| Kansas: | 0.2% (2,966) |
Walked:
| Manhattan: | 11.0% (2,684) |
| Kansas: | 2.5% (33,271) |
Other means:
| Manhattan: | 0.3% (81) |
| Kansas: | 0.6% (7,927) |


Drove car alone - Males:
| Manhattan: | 76.9% (12,463) |
| Kansas: | 85.8% (506,388) |
Carpooled - Males:
| Manhattan: | 11.0% (1,775) |
| Kansas: | 9.0% (61,019) |
Bus - Males:
| Manhattan: | 0.6% (97) |
| Kansas: | 0.4% (3,531) |
Subway or elevated rail - Males:
| Manhattan: | 0.1% (13) |
| Kansas: | 0.0% (81) |
Bicycle - Males:
| Manhattan: | 2.0% (320) |
| Kansas: | 0.4% (1,401) |
Walked - Males:
| Manhattan: | 8.2% (1,324) |
| Kansas: | 2.8% (12,980) |
Other means - Males:
| Manhattan: | 1.3% (206) |
| Kansas: | 1.4% (8,088) |

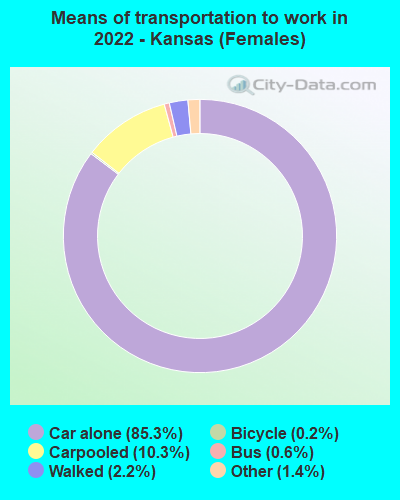
Drove car alone - Females:
| Manhattan: | 80.0% (12,590) |
| Kansas: | 85.3% (506,388) |
Carpooled - Females:
| Manhattan: | 12.3% (1,941) |
| Kansas: | 10.3% (61,019) |
Bus - Females:
| Manhattan: | 0.2% (37) |
| Kansas: | 0.6% (3,531) |
Bicycle - Females:
| Manhattan: | 0.7% (106) |
| Kansas: | 0.2% (1,401) |
Walked - Females:
| Manhattan: | 6.0% (949) |
| Kansas: | 2.2% (12,980) |
Other means - Females:
| Manhattan: | 0.7% (114) |
| Kansas: | 1.4% (8,088) |
Private vehicle occupancy

Drove alone:
| Manhattan: | 86.9% (20,222) |
| Kansas: | 90.1% (1,093,613) |
In 2 person carpool:
| Manhattan: | 9.5% (2,216) |
| Kansas: | 7.2% (86,855) |
In 3 person carpool:
| Manhattan: | 1.5% (356) |
| Kansas: | 1.7% (20,774) |
In 4 person carpool:
| Manhattan: | 1.5% (345) |
| Kansas: | 0.5% (6,378) |
In 5-6 person carpool:
| Manhattan: | 0.1% (33) |
| Kansas: | 0.4% (4,405) |
In 7+ person carpool:
| Manhattan: | 0.2% (46) |
| Kansas: | 0.2% (2,216) |

Drove alone:
| Manhattan: | 89.8% (18,295) |
| Kansas: | 88.5% (1,068,501) |
In 2 person carpool:
| Manhattan: | 8.0% (1,623) |
| Kansas: | 9.0% (109,278) |
In 3 person carpool:
| Manhattan: | 1.5% (308) |
| Kansas: | 1.6% (19,470) |
In 4 person carpool:
| Manhattan: | 0.3% (63) |
| Kansas: | 0.5% (6,138) |
In 5-6 person carpool:
| Manhattan: | 0.2% (42) |
| Kansas: | 0.2% (2,992) |
In 7+ person carpool:
| Manhattan: | 0.3% (51) |
| Kansas: | 0.1% (1,470) |
Class of workers
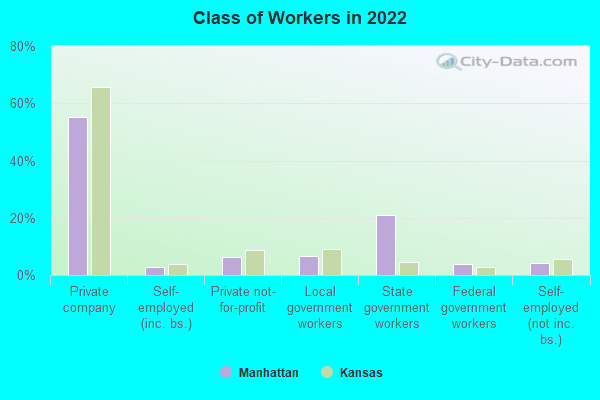
Employee of private company:
| Manhattan: | 55.1% (15,492) |
| Kansas: | 65.5% (954,573) |
Self-employed in own incorporated business:
| Manhattan: | 2.7% (765) |
| Kansas: | 3.7% (53,764) |
Private not-for-profit wage and salary workers:
| Manhattan: | 6.1% (1,718) |
| Kansas: | 8.6% (124,918) |
Local government workers:
| Manhattan: | 6.7% (1,883) |
| Kansas: | 8.9% (130,140) |
State government workers:
| Manhattan: | 21.0% (5,897) |
| Kansas: | 4.7% (68,405) |
Federal government workers:
| Manhattan: | 3.8% (1,061) |
| Kansas: | 2.6% (38,402) |
Self-employed workers in own not incorporated business:
| Manhattan: | 4.3% (1,217) |
| Kansas: | 5.7% (83,239) |
Unpaid family workers:
| Manhattan: | 0.2% (59) |
| Kansas: | 0.2% (3,061) |

Employee of private company:
| Manhattan: | 50.3% (11,928) |
| Kansas: | 65.6% (863,522) |
Self-employed in own incorporated business:
| Manhattan: | 1.6% (369) |
| Kansas: | 3.0% (39,856) |
Private not-for-profit wage and salary workers:
| Manhattan: | 7.6% (1,798) |
| Kansas: | 7.7% (101,602) |
Local government workers:
| Manhattan: | 6.4% (1,519) |
| Kansas: | 7.1% (93,985) |
State government workers:
| Manhattan: | 24.9% (5,898) |
| Kansas: | 5.7% (75,164) |
Federal government workers:
| Manhattan: | 4.4% (1,035) |
| Kansas: | 2.6% (34,749) |
Self-employed workers in own not incorporated business:
| Manhattan: | 4.7% (1,105) |
| Kansas: | 7.8% (102,378) |
Unpaid family workers:
| Manhattan: | 0.3% (74) |
| Kansas: | 0.4% (5,027) |

Employee of private company - Males:
| Manhattan: | 59.0% (8,499) |
| Kansas: | 70.4% (543,878) |
Self-employed in own incorporated business - Males:
| Manhattan: | 3.9% (568) |
| Kansas: | 4.7% (36,544) |
Private not-for-profit wage and salary workers - Males:
| Manhattan: | 3.9% (555) |
| Kansas: | 4.8% (36,937) |
Local government workers - Males:
| Manhattan: | 5.6% (801) |
| Kansas: | 6.6% (51,074) |
State government workers - Males:
| Manhattan: | 18.5% (2,663) |
| Kansas: | 3.8% (29,053) |
Federal government workers - Males:
| Manhattan: | 4.8% (697) |
| Kansas: | 2.8% (21,519) |
Self-employed workers in own not incorporated business - Males:
| Manhattan: | 4.1% (592) |
| Kansas: | 6.8% (52,202) |
Unpaid family workers - Males:
| Manhattan: | 0.1% (19) |
| Kansas: | 0.2% (1,678) |

Employee of private company - Females:
| Manhattan: | 51.1% (6,994) |
| Kansas: | 60.1% (410,695) |
Self-employed in own incorporated business - Females:
| Manhattan: | 1.4% (197) |
| Kansas: | 2.5% (17,220) |
Private not-for-profit wage and salary workers - Females:
| Manhattan: | 8.5% (1,163) |
| Kansas: | 12.9% (87,981) |
Local government workers - Females:
| Manhattan: | 7.9% (1,082) |
| Kansas: | 11.6% (79,066) |
State government workers - Females:
| Manhattan: | 23.6% (3,234) |
| Kansas: | 5.8% (39,352) |
Federal government workers - Females:
| Manhattan: | 2.7% (364) |
| Kansas: | 2.5% (16,883) |
Self-employed workers in own not incorporated business - Females:
| Manhattan: | 4.6% (625) |
| Kansas: | 4.5% (31,037) |
Unpaid family workers - Females:
| Manhattan: | 0.3% (40) |
| Kansas: | 0.2% (1,383) |