Work and Jobs in Manhattan, New York (NY) Detailed Stats
Occupations, Industries, Unemployment, Workers, Commute
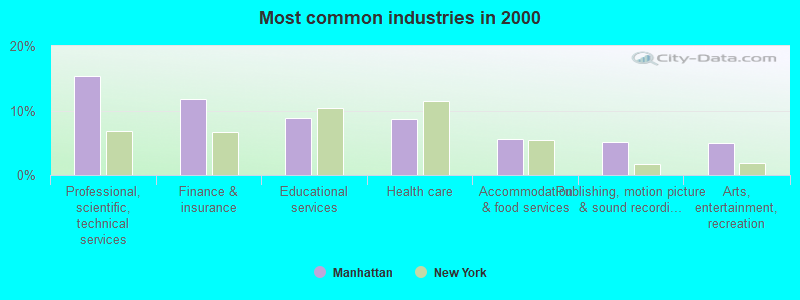
The most common industries in Manhattan are: Professional, scientific, technical services (15.4% of civilian employees), Finance & insurance (11.7% of civilian employees), Educational services (8.9% of civilian employees). 64.4% of workers are employees of private companies, which is about the same as the rate of 63.7% across the entire state of New York.
Most common industries
Most common industries | |||
|---|---|---|---|
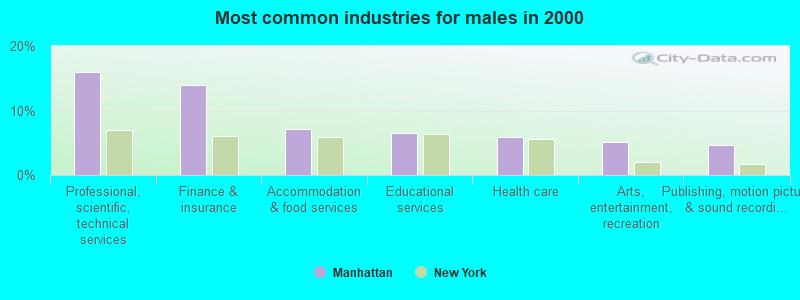
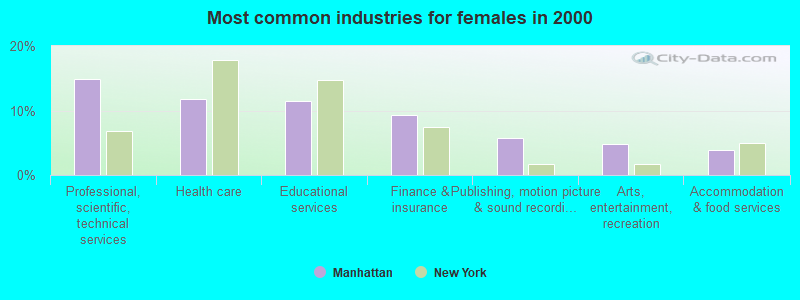
Industry | All | Males | Females |
| Professional, scientific, and technical services | 15.4% (118,800) | 16.0% (63,074) | 14.9% (55,726) |
| Finance and insurance | 11.7% (90,279) | 14.0% (55,328) | 9.3% (34,951) |
| Educational services | 8.9% (68,540) | 6.5% (25,534) | 11.5% (43,006) |
| Health care | 8.7% (67,383) | 5.9% (23,152) | 11.8% (44,231) |
| Accommodation and food services | 5.6% (42,921) | 7.2% (28,484) | 3.8% (14,437) |
| Publishing, and motion picture and sound recording industries | 5.2% (39,953) | 4.7% (18,620) | 5.7% (21,333) |
| Arts, entertainment, and recreation | 5.0% (38,407) | 5.1% (20,211) | 4.9% (18,196) |
| Real estate and rental and leasing | 3.2% (24,678) | 4.3% (16,802) | 2.1% (7,876) |
| Public administration | 3.2% (24,422) | 3.0% (11,754) | 3.4% (12,668) |
| Administrative and support and waste management services | 2.7% (20,928) | 2.8% (11,050) | 2.6% (9,878) |
| Religious, grantmaking, civic, professional, and similar organizations | 2.3% (18,004) | 1.7% (6,874) | 3.0% (11,130) |
| Broadcasting and telecommunications | 2.3% (17,575) | 2.1% (8,330) | 2.5% (9,245) |
| Social assistance | 2.1% (16,080) | 0.8% (3,072) | 3.5% (13,008) |
| Data processing, libraries, and other information services | 1.8% (14,197) | 2.0% (7,713) | 1.7% (6,484) |
| Construction | 1.7% (13,097) | 2.8% (11,259) | 0.5% (1,838) |
| Other transportation, and support activities, and couriers | 1.6% (12,019) | 2.5% (9,952) | 0.6% (2,067) |
| Apparel | 1.5% (11,667) | 0.8% (3,353) | 2.2% (8,314) |
| Personal and laundry services | 1.2% (9,468) | 1.2% (4,700) | 1.3% (4,768) |
| Clothing and accessories, including shoe, stores | 1.2% (9,390) | 0.8% (3,350) | 1.6% (6,040) |
| Food and beverage stores | 1.1% (8,144) | 1.4% (5,545) | 0.7% (2,599) |
| Miscellaneous manufacturing | 0.9% (7,103) | 0.9% (3,699) | 0.9% (3,404) |
| Used merchandise, gift, novelty, and souvenir, and other miscellaneous stores | 0.8% (6,187) | 0.7% (2,912) | 0.9% (3,275) |
| Apparel, fabrics, and notions merchant wholesalers | 0.8% (5,970) | 0.6% (2,547) | 0.9% (3,423) |
| Private households | 0.6% (4,880) | 0.1% (588) | 1.1% (4,292) |
| Chemicals | 0.6% (4,649) | 0.5% (1,991) | 0.7% (2,658) |
| Department and other general merchandise stores | 0.6% (4,640) | 0.4% (1,629) | 0.8% (3,011) |
| Other direct selling establishments | 0.6% (4,263) | 0.5% (2,097) | 0.6% (2,166) |
| Miscellaneous nondurable goods merchant wholesalers | 0.5% (3,540) | 0.6% (2,198) | 0.4% (1,342) |
| Repair and maintenance | 0.4% (3,396) | 0.7% (2,773) | 0.2% (623) |
| Radio, TV, and computer stores | 0.4% (3,177) | 0.6% (2,266) | 0.2% (911) |
| Miscellaneous durable goods merchant wholesalers | 0.4% (3,047) | 0.5% (1,795) | 0.3% (1,252) |
| Electronic shopping and mail-order houses | 0.4% (2,933) | 0.4% (1,592) | 0.4% (1,341) |
| Printing and related support activities | 0.4% (2,730) | 0.4% (1,732) | 0.3% (998) |
| Air transportation | 0.3% (2,635) | 0.3% (1,036) | 0.4% (1,599) |
| U. S. Postal service | 0.3% (2,549) | 0.4% (1,735) | 0.2% (814) |
| Textile mills and textile products | 0.3% (2,487) | 0.3% (1,044) | 0.4% (1,443) |
| Furniture and home furnishings, and household appliance stores | 0.3% (2,367) | 0.4% (1,404) | 0.3% (963) |
| Food | 0.3% (2,264) | 0.4% (1,508) | 0.2% (756) |
| Groceries and related products merchant wholesalers | 0.3% (2,032) | 0.4% (1,660) | 0.1% (372) |
| Computer and electronic products | 0.2% (1,915) | 0.3% (1,069) | 0.2% (846) |
| Jewelry, luggage, and leather goods stores | 0.2% (1,903) | 0.2% (764) | 0.3% (1,139) |
| Health and personal care, except drug, stores | 0.2% (1,818) | 0.2% (648) | 0.3% (1,170) |
| Truck transportation | 0.2% (1,749) | 0.4% (1,583) | 0.0% (166) |
| Book stores and news dealers | 0.2% (1,659) | 0.2% (919) | 0.2% (740) |
| Pharmacies and drug stores | 0.2% (1,609) | 0.2% (750) | 0.2% (859) |
| Music stores | 0.2% (1,259) | 0.2% (880) | 0.1% (379) |
| Professional and commercial equipment and supplies merchant wholesalers | 0.2% (1,230) | 0.2% (845) | 0.1% (385) |
| Sporting goods, camera, and hobby and toy stores | 0.1% (1,153) | 0.2% (778) | 0.1% (375) |
| Drugs, sundries, and chemical and allied products merchant wholesalers | 0.1% (1,147) | 0.1% (467) | 0.2% (680) |
| Utilities | 0.1% (1,115) | 0.2% (758) | 0.1% (357) |
| Building material and garden equipment and supplies dealers | 0.1% (1,039) | 0.2% (838) | 0.1% (201) |
| Metal and metal products | 0.1% (1,039) | 0.2% (886) | 0.0% (153) |
| Furniture and related product manufacturing | 0.1% (1,027) | 0.2% (809) | 0.1% (218) |
| Machinery | 0.1% (884) | 0.1% (578) | 0.1% (306) |
| Retail florists | 0.1% (772) | 0.1% (474) | 0.1% (298) |
| Motor vehicle and parts dealers | 0.1% (765) | 0.2% (675) | 0.0% (90) |
| Electrical and electronic goods merchant wholesalers | 0.1% (736) | 0.1% (568) | 0.0% (168) |
| Beverage and tobacco products | 0.1% (706) | 0.1% (468) | 0.1% (238) |
Unemployment in Manhattan
- Unemployment by race in 2000
- Unemployment rate for White non-Hispanic residents
- 4.1%Males
- 4.5%Females
- Unemployment rate for Black residents
- 18.5%Males
- 17.6%Females
- Unemployment rate for American Indian and Alaska Native residents
- 14.9%Males
- 17.0%Females
- Unemployment rate for Asian residents
- 7.4%Males
- 7.2%Females
- Unemployment rate for other race residents
- 15.0%Males
- 17.7%Females
- Unemployment rate for two or more race residents
- 11.0%Males
- 12.7%Females
- Unemployment rate for Hispanic or Latino residents
- 14.4%Males
- 16.3%Females
Time leaving home to go to work

<5am:
| Manhattan: | 1.2% (8,832) |
| New York: | 2.4% (194,562) |
5:30am:
| Manhattan: | 0.9% (6,497) |
| New York: | 2.1% (174,328) |
6am:
| Manhattan: | 1.0% (7,407) |
| New York: | 3.1% (253,826) |
6:30am:
| Manhattan: | 3.2% (24,280) |
| New York: | 7.0% (573,349) |
7am:
| Manhattan: | 3.8% (28,294) |
| New York: | 8.6% (706,982) |
7:30am:
| Manhattan: | 9.4% (70,856) |
| New York: | 14.0% (1,147,579) |
8am:
| Manhattan: | 11.5% (86,342) |
| New York: | 14.8% (1,213,706) |
8:30am:
| Manhattan: | 19.4% (145,744) |
| New York: | 13.9% (1,144,298) |
9am:
| Manhattan: | 14.7% (111,064) |
| New York: | 7.5% (614,475) |
10am:
| Manhattan: | 14.5% (109,247) |
| New York: | 7.2% (593,377) |
11am:
| Manhattan: | 4.5% (33,991) |
| New York: | 2.7% (224,011) |
12pm:
| Manhattan: | 1.5% (11,456) |
| New York: | 1.3% (105,049) |
4pm:
| Manhattan: | 4.5% (33,538) |
| New York: | 6.3% (517,309) |
>4pm:
| Manhattan: | 4.2% (31,713) |
| New York: | 6.1% (501,196) |
Travel time to work


Less than 5 minutes:
| Manhattan: | 1.5% (11,352) |
| New York: | 2.7% (219,036) |
5 to 9 minutes:
| Manhattan: | 4.7% (35,214) |
| New York: | 8.3% (680,270) |
10 to 14 minutes:
| Manhattan: | 7.6% (57,607) |
| New York: | 11.6% (956,590) |
15 to 19 minutes:
| Manhattan: | 11.4% (86,106) |
| New York: | 12.4% (1,020,084) |
20 to 24 minutes:
| Manhattan: | 14.7% (110,653) |
| New York: | 12.3% (1,013,757) |
25 to 29 minutes:
| Manhattan: | 6.1% (45,658) |
| New York: | 4.9% (399,384) |
30 to 34 minutes:
| Manhattan: | 20.0% (150,822) |
| New York: | 12.9% (1,058,688) |
35 to 39 minutes:
| Manhattan: | 3.3% (24,991) |
| New York: | 2.5% (203,722) |
40 to 44 minutes:
| Manhattan: | 5.5% (41,108) |
| New York: | 4.1% (340,311) |
45 to 59 minutes:
| Manhattan: | 10.5% (78,988) |
| New York: | 9.8% (806,556) |
60 to 89 minutes:
| Manhattan: | 6.2% (46,413) |
| New York: | 10.3% (848,185) |
90 or more minutes:
| Manhattan: | 2.7% (20,349) |
| New York: | 5.1% (417,464) |
Means of transportation to work


Drove car alone:
| Manhattan: | 7.6% (57,150) |
| New York: | 56.3% (4,620,178) |
Carpooled:
| Manhattan: | 3.4% (25,604) |
| New York: | 9.2% (756,918) |
Bus or trolley bus:
| Manhattan: | 10.1% (75,859) |
| New York: | 5.8% (475,389) |
Streetcar or trolley car:
| Manhattan: | 0.1% (1,001) |
| New York: | 0.1% (6,058) |
Subway or elevated:
| Manhattan: | 43.6% (328,246) |
| New York: | 14.8% (1,217,009) |
Railroad:
| Manhattan: | 1.1% (8,309) |
| New York: | 2.8% (228,215) |
Ferryboat:
| Manhattan: | 0.1% (411) |
| New York: | 0.1% (11,626) |
Taxicab:
| Manhattan: | 4.7% (35,187) |
| New York: | 0.8% (67,897) |
Motorcycle:
| Manhattan: | 0.1% (437) |
| New York: | 0.0% (3,625) |
Bicycle:
| Manhattan: | 0.9% (6,410) |
| New York: | 0.3% (25,036) |
Walked:
| Manhattan: | 21.9% (164,934) |
| New York: | 6.2% (511,721) |
Other means:
| Manhattan: | 0.8% (5,713) |
| New York: | 0.5% (40,375) |
Private vehicle occupancy

Drove alone:
| Manhattan: | 69.1% (57,150) |
| New York: | 85.9% (4,620,178) |
In 2 person carpool:
| Manhattan: | 18.2% (15,042) |
| New York: | 11.0% (590,255) |
In 3 person carpool:
| Manhattan: | 3.8% (3,143) |
| New York: | 1.8% (96,470) |
In 4 person carpool:
| Manhattan: | 2.1% (1,707) |
| New York: | 0.7% (36,112) |
In 5-6 person carpool:
| Manhattan: | 2.1% (1,773) |
| New York: | 0.3% (16,644) |
In 7+ person carpool:
| Manhattan: | 4.8% (3,939) |
| New York: | 0.3% (17,437) |
Class of workers
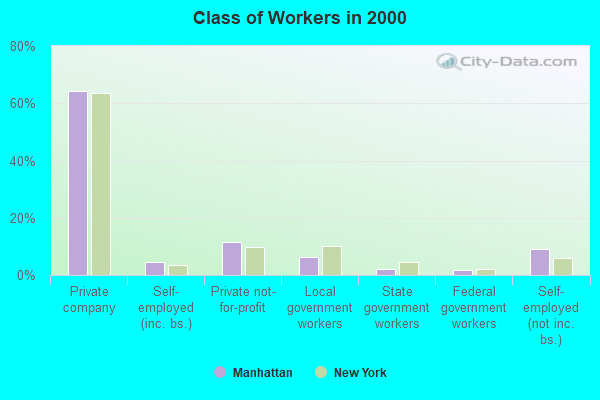
Employee of private company:
| Manhattan: | 64.4% (495,905) |
| New York: | 63.7% (5,340,134) |
Self-employed in own incorporated business:
| Manhattan: | 4.6% (35,236) |
| New York: | 3.4% (283,619) |
Private not-for-profit wage and salary workers:
| Manhattan: | 11.6% (89,691) |
| New York: | 9.7% (810,356) |
Local government workers:
| Manhattan: | 6.2% (47,808) |
| New York: | 10.2% (858,120) |
State government workers:
| Manhattan: | 2.0% (15,544) |
| New York: | 4.6% (383,673) |
Federal government workers:
| Manhattan: | 1.9% (14,721) |
| New York: | 2.2% (185,100) |
Self-employed workers in own not incorporated business:
| Manhattan: | 9.0% (69,517) |
| New York: | 6.0% (501,068) |
Unpaid family workers:
| Manhattan: | 0.2% (1,861) |
| New York: | 0.2% (20,918) |

Employee of private company - Males:
| Manhattan: | 66.8% (264,042) |
| New York: | 66.2% (2,902,064) |
Self-employed in own incorporated business - Males:
| Manhattan: | 6.1% (24,111) |
| New York: | 4.9% (215,651) |
Private not-for-profit wage and salary workers - Males:
| Manhattan: | 9.0% (35,423) |
| New York: | 6.3% (277,787) |
Local government workers - Males:
| Manhattan: | 4.6% (17,998) |
| New York: | 8.7% (380,426) |
State government workers - Males:
| Manhattan: | 1.7% (6,575) |
| New York: | 4.1% (181,784) |
Federal government workers - Males:
| Manhattan: | 1.9% (7,456) |
| New York: | 2.3% (102,647) |
Self-employed workers in own not incorporated business - Males:
| Manhattan: | 9.8% (38,682) |
| New York: | 7.1% (312,497) |
Unpaid family workers - Males:
| Manhattan: | 0.2% (877) |
| New York: | 0.2% (9,470) |

Employee of private company - Females:
| Manhattan: | 61.8% (231,863) |
| New York: | 60.9% (2,438,070) |
Self-employed in own incorporated business - Females:
| Manhattan: | 3.0% (11,125) |
| New York: | 1.7% (67,968) |
Private not-for-profit wage and salary workers - Females:
| Manhattan: | 14.5% (54,268) |
| New York: | 13.3% (532,569) |
Local government workers - Females:
| Manhattan: | 7.9% (29,810) |
| New York: | 11.9% (477,694) |
State government workers - Females:
| Manhattan: | 2.4% (8,969) |
| New York: | 5.0% (201,889) |
Federal government workers - Females:
| Manhattan: | 1.9% (7,265) |
| New York: | 2.1% (82,453) |
Self-employed workers in own not incorporated business - Females:
| Manhattan: | 8.2% (30,835) |
| New York: | 4.7% (188,571) |
Unpaid family workers - Females:
| Manhattan: | 0.3% (984) |
| New York: | 0.3% (11,448) |