Work and Jobs in Millcreek, Utah (UT) Detailed Stats
Occupations, Industries, Unemployment, Workers, Commute
Settings
X


Recent posts about work in Millcreek, Utah on our local forum with over 2,400,000 registered users:
 | Relocating for a job to SLC (5 replies) |
| New construction around $300k for SLC? Millcreek (3 replies) |
| Summer Travel to Salt Lake City (52 replies) |
| Gifted program and school transfer - moving to SLC (25 replies) |
| E Millcreek welcomes kletter1mann et al! (19 replies) |
| narrowing down areas- pros and cons! (4 replies) |
Latest news about work in Millcreek, UT collected exclusively by city-data.com from local newspapers, TV, and radio stations
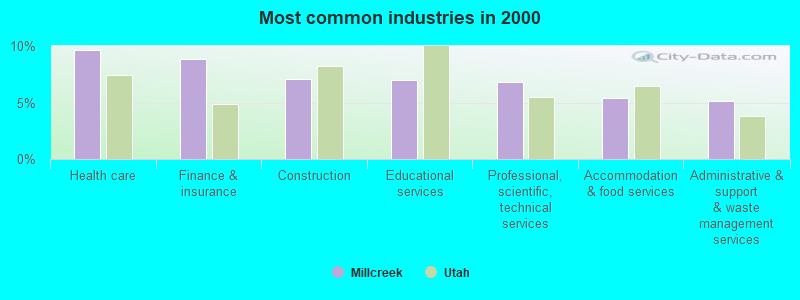
The most common industries in Millcreek are: Health care (9.6% of civilian employees), Finance & insurance (8.8% of civilian employees), Construction (7.1% of civilian employees). 94.3% of workers work in Salt Lake County and 17.5% of all workers work at home. 62.8% of workers are employees of private companies, which is 8.3% less than the rate of 68.0% across the entire state of Utah.
Whole page based on the data from 2000 / 2022 when the population of Millcreek, Utah was 30,377 / 63,822
Whole page based on the data from 2000 / 2022 when the population of Millcreek, Utah was 30,377 / 63,822
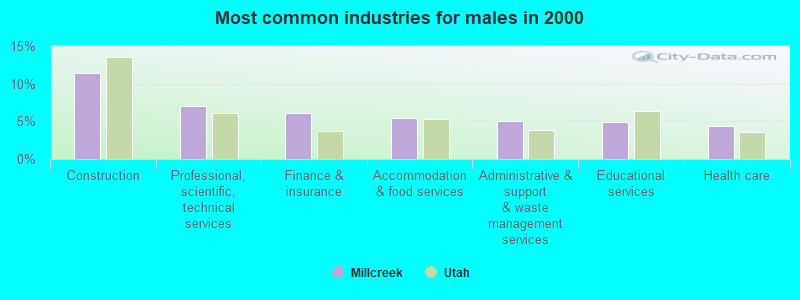
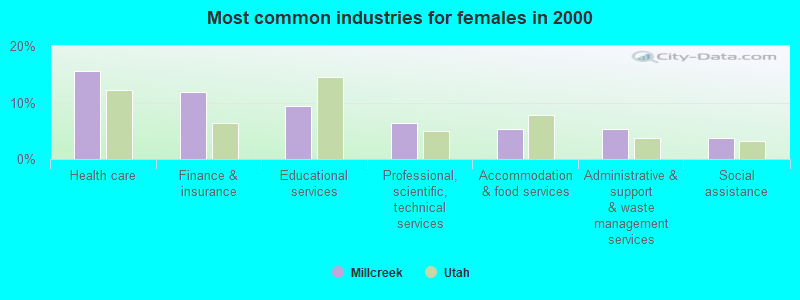
Most common industries
Most common industries | |||
|---|---|---|---|
Industry | All | Males | Females |
| Health care | 9.6% (1,477) | 4.4% (354) | 15.5% (1,123) |
| Finance and insurance | 8.8% (1,355) | 6.1% (493) | 11.9% (862) |
| Construction | 7.1% (1,089) | 11.4% (930) | 2.2% (159) |
| Educational services | 7.0% (1,079) | 4.9% (399) | 9.4% (680) |
| Professional, scientific, and technical services | 6.8% (1,044) | 7.1% (577) | 6.4% (467) |
| Accommodation and food services | 5.4% (831) | 5.4% (442) | 5.4% (389) |
| Administrative and support and waste management services | 5.2% (795) | 5.1% (413) | 5.3% (382) |
| Public administration | 3.4% (518) | 3.4% (280) | 3.3% (238) |
| Miscellaneous manufacturing | 3.3% (501) | 2.9% (233) | 3.7% (268) |
| Food and beverage stores | 2.8% (425) | 2.5% (205) | 3.0% (220) |
| Real estate and rental and leasing | 2.6% (407) | 2.5% (203) | 2.8% (204) |
| Personal and laundry services | 2.2% (344) | 2.0% (160) | 2.5% (184) |
| Social assistance | 2.1% (324) | 0.7% (56) | 3.7% (268) |
| Broadcasting and telecommunications | 2.0% (312) | 2.1% (168) | 2.0% (144) |
| Repair and maintenance | 1.7% (268) | 2.9% (236) | 0.4% (32) |
| Computer and electronic products | 1.4% (220) | 2.3% (191) | 0.4% (29) |
| Motor vehicle and parts dealers | 1.4% (208) | 2.2% (182) | 0.4% (26) |
| Department and other general merchandise stores | 1.3% (199) | 1.3% (108) | 1.3% (91) |
| Other transportation, and support activities, and couriers | 1.2% (179) | 1.7% (138) | 0.6% (41) |
| Religious, grantmaking, civic, professional, and similar organizations | 1.2% (178) | 0.7% (54) | 1.7% (124) |
| Radio, TV, and computer stores | 1.1% (163) | 1.6% (132) | 0.4% (31) |
| Arts, entertainment, and recreation | 1.0% (161) | 1.0% (79) | 1.1% (82) |
| Groceries and related products merchant wholesalers | 1.0% (157) | 1.1% (91) | 0.9% (66) |
| Printing and related support activities | 1.0% (156) | 1.3% (107) | 0.7% (49) |
| Publishing, and motion picture and sound recording industries | 1.0% (154) | 1.1% (89) | 0.9% (65) |
| Metal and metal products | 1.0% (149) | 1.7% (140) | 0.1% (9) |
| Building material and garden equipment and supplies dealers | 0.9% (137) | 1.5% (123) | 0.2% (14) |
| Furniture and related product manufacturing | 0.8% (130) | 1.4% (116) | 0.2% (14) |
| Furniture and home furnishings, and household appliance stores | 0.8% (120) | 0.9% (74) | 0.6% (46) |
| Machinery, equipment, and supplies merchant wholesalers | 0.8% (118) | 0.7% (59) | 0.8% (59) |
| Clothing and accessories, including shoe, stores | 0.7% (107) | 0.2% (16) | 1.3% (91) |
| Data processing, libraries, and other information services | 0.7% (102) | 0.8% (65) | 0.5% (37) |
| Truck transportation | 0.6% (99) | 0.8% (68) | 0.4% (31) |
| Transportation equipment | 0.6% (95) | 0.8% (68) | 0.4% (27) |
| Air transportation | 0.6% (88) | 0.6% (52) | 0.5% (36) |
| Jewelry, luggage, and leather goods stores | 0.5% (82) | 0.5% (42) | 0.6% (40) |
| Used merchandise, gift, novelty, and souvenir, and other miscellaneous stores | 0.5% (76) | 0.5% (43) | 0.5% (33) |
| Utilities | 0.5% (72) | 0.8% (66) | 0.1% (6) |
| U. S. Postal service | 0.5% (71) | 0.7% (60) | 0.2% (11) |
| Miscellaneous nondurable goods merchant wholesalers | 0.5% (70) | 0.6% (47) | 0.3% (23) |
| Private households | 0.5% (70) | 0.0% (0) | 1.0% (70) |
| Food | 0.4% (69) | 0.5% (41) | 0.4% (28) |
| Electrical and electronic goods merchant wholesalers | 0.4% (68) | 0.7% (59) | 0.1% (9) |
| Plastics and rubber products | 0.4% (67) | 0.5% (44) | 0.3% (23) |
| Pharmacies and drug stores | 0.4% (61) | 0.3% (25) | 0.5% (36) |
| Office supplies and stationery stores | 0.4% (60) | 0.3% (21) | 0.5% (39) |
| Machinery | 0.4% (55) | 0.7% (55) | 0.0% (0) |
| Other direct selling establishments | 0.3% (53) | 0.1% (10) | 0.6% (43) |
| Chemicals | 0.3% (49) | 0.4% (29) | 0.3% (20) |
| Warehousing and storage | 0.3% (49) | 0.5% (37) | 0.2% (12) |
| Professional and commercial equipment and supplies merchant wholesalers | 0.3% (47) | 0.6% (47) | 0.0% (0) |
| Motor vehicles, parts and supplies merchant wholesalers | 0.3% (44) | 0.5% (38) | 0.1% (6) |
| Gasoline stations | 0.3% (43) | 0.4% (36) | 0.1% (7) |
| Health and personal care, except drug, stores | 0.3% (40) | 0.3% (24) | 0.2% (16) |
| Book stores and news dealers | 0.3% (39) | 0.3% (24) | 0.2% (15) |
| Nonmetallic mineral products | 0.2% (38) | 0.5% (38) | 0.0% (0) |
| Agriculture, forestry, fishing and hunting | 0.2% (38) | 0.4% (32) | 0.1% (6) |
| Retail florists | 0.2% (35) | 0.1% (8) | 0.4% (27) |
| Electronic shopping and mail-order houses | 0.2% (34) | 0.1% (11) | 0.3% (23) |
| Paper | 0.2% (33) | 0.3% (25) | 0.1% (8) |
| Music stores | 0.2% (31) | 0.0% (0) | 0.4% (31) |
| Furniture and home furnishing merchant wholesalers | 0.2% (31) | 0.2% (19) | 0.2% (12) |
| Textile mills and textile products | 0.2% (27) | 0.2% (13) | 0.2% (14) |
| Lumber and other construction materials merchant wholesalers | 0.2% (26) | 0.2% (15) | 0.2% (11) |
| Mining, quarrying, and oil and gas extraction | 0.2% (25) | 0.2% (17) | 0.1% (8) |
| Management of companies and enterprises | 0.1% (19) | 0.2% (19) | 0.0% (0) |
| Petroleum and coal products | 0.1% (19) | 0.1% (11) | 0.1% (8) |
| Beverage and tobacco products | 0.1% (19) | 0.1% (11) | 0.1% (8) |
| Apparel | 0.1% (19) | 0.0% (0) | 0.3% (19) |
| Sporting goods, camera, and hobby and toy stores | 0.1% (19) | 0.2% (19) | 0.0% (0) |
| Miscellaneous durable goods merchant wholesalers | 0.1% (18) | 0.0% (0) | 0.2% (18) |
| Hardware, plumbing and heating equipment, and supplies merchant wholesalers | 0.1% (16) | 0.2% (16) | 0.0% (0) |
| Fuel dealers | 0.1% (10) | 0.1% (10) | 0.0% (0) |
| Drugs, sundries, and chemical and allied products merchant wholesalers | 0.1% (9) | 0.1% (9) | 0.0% (0) |
Unemployment in Millcreek
- Unemployment by race in 2022
- Unemployment rate for White non-Hispanic residents
- 1.6%Males
- 3.2%Females
- Unemployment rate for Black residents
- 3.5%Males
- 0.2%Females
- Unemployment rate for American Indian and Alaska Native residents
- 2.1%Females
- Unemployment rate for Asian residents
- 1.2%Females
- Unemployment rate for other race residents
- 4.0%Males
- 1.8%Females
- Unemployment rate for two or more race residents
- 16.5%Males
- 1.2%Females
- Unemployment rate for Hispanic or Latino residents
- 4.1%Males
- 1.7%Females
- Unemployment by race in 2000
- Unemployment rate for White non-Hispanic residents
- 3.7%Males
- 4.5%Females
- Unemployment rate for American Indian and Alaska Native residents
- 11.8%Males
- 7.6%Females
- Unemployment rate for Asian residents
- 4.5%Males
- 4.8%Females
- Unemployment rate for other race residents
- 12.7%Males
- 15.4%Females
- Unemployment rate for two or more race residents
- 10.4%Males
- 8.4%Females
- Unemployment rate for Hispanic or Latino residents
- 16.9%Males
- 12.3%Females
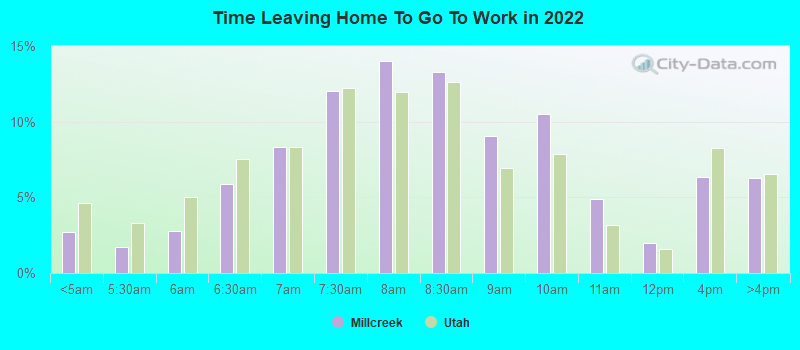
Time leaving home to go to work
12:00 a.m. to 4:59 a.m.:
| Millcreek: | 2.7% (738) |
| Utah: | 4.6% (65,402) |
5:00 a.m. to 5:29 a.m.:
| Millcreek: | 1.7% (474) |
| Utah: | 3.3% (46,230) |
5:30 a.m. to 5:59 a.m.:
| Millcreek: | 2.8% (757) |
| Utah: | 5.0% (70,703) |
6:00 a.m. to 6:29 a.m.:
| Millcreek: | 5.9% (1,602) |
| Utah: | 7.5% (106,014) |
6:30 a.m. to 6:59 a.m.:
| Millcreek: | 8.3% (2,258) |
| Utah: | 8.3% (116,899) |
7:00 a.m. to 7:29 a.m.:
| Millcreek: | 12.0% (3,253) |
| Utah: | 12.2% (171,911) |
7:30 a.m. to 7:59 a.m.:
| Millcreek: | 14.0% (3,803) |
| Utah: | 12.0% (168,559) |
8:00 a.m. to 8:29 a.m.:
| Millcreek: | 13.3% (3,602) |
| Utah: | 12.6% (177,854) |
8:30 a.m. to 8:59 a.m.:
| Millcreek: | 9.0% (2,453) |
| Utah: | 7.0% (98,031) |
9:00 a.m. to 9:59 a.m.:
| Millcreek: | 10.5% (2,850) |
| Utah: | 7.9% (110,519) |
10:00 a.m. to 10:59 a.m.:
| Millcreek: | 4.9% (1,329) |
| Utah: | 3.2% (45,072) |
11:00 a.m. to 11:59 a.m.:
| Millcreek: | 2.0% (533) |
| Utah: | 1.6% (22,413) |
12:00 p.m. to 3:59 p.m.:
| Millcreek: | 6.3% (1,715) |
| Utah: | 8.2% (115,811) |
4:00 p.m. to 11:59 p.m.:
| Millcreek: | 6.3% (1,707) |
| Utah: | 6.5% (91,789) |

<5am:
| Millcreek: | 1.7% (264) |
| Utah: | 3.4% (34,668) |
5:30am:
| Millcreek: | 2.4% (360) |
| Utah: | 2.6% (27,208) |
6am:
| Millcreek: | 3.8% (574) |
| Utah: | 4.9% (50,890) |
6:30am:
| Millcreek: | 4.7% (709) |
| Utah: | 6.9% (71,407) |
7am:
| Millcreek: | 12.2% (1,855) |
| Utah: | 9.6% (99,512) |
7:30am:
| Millcreek: | 11.9% (1,798) |
| Utah: | 12.2% (126,423) |
8am:
| Millcreek: | 15.9% (2,413) |
| Utah: | 14.5% (149,517) |
8:30am:
| Millcreek: | 12.1% (1,840) |
| Utah: | 10.4% (107,893) |
9am:
| Millcreek: | 6.8% (1,026) |
| Utah: | 5.7% (59,261) |
10am:
| Millcreek: | 8.4% (1,268) |
| Utah: | 5.8% (59,537) |
11am:
| Millcreek: | 2.7% (413) |
| Utah: | 2.6% (26,709) |
12pm:
| Millcreek: | 1.9% (287) |
| Utah: | 1.4% (14,712) |
4pm:
| Millcreek: | 7.1% (1,074) |
| Utah: | 8.5% (87,296) |
>4pm:
| Millcreek: | 5.7% (859) |
| Utah: | 7.2% (74,490) |

12:00 a.m. to 4:59 a.m. - Males:
| Millcreek: | 3.4% (509) |
| Utah: | 5.5% (44,081) |
5:00 a.m. to 5:29 a.m. - Males:
| Millcreek: | 2.4% (364) |
| Utah: | 3.9% (31,245) |
5:30 a.m. to 5:59 a.m. - Males:
| Millcreek: | 3.3% (499) |
| Utah: | 6.3% (50,369) |
6:00 a.m. to 6:29 a.m. - Males:
| Millcreek: | 7.1% (1,070) |
| Utah: | 9.3% (74,366) |
6:30 a.m. to 6:59 a.m. - Males:
| Millcreek: | 9.3% (1,405) |
| Utah: | 9.4% (75,243) |
7:00 a.m. to 7:29 a.m. - Males:
| Millcreek: | 11.9% (1,795) |
| Utah: | 12.2% (97,752) |
7:30 a.m. to 7:59 a.m. - Males:
| Millcreek: | 13.4% (2,018) |
| Utah: | 10.8% (86,306) |
8:00 a.m. to 8:29 a.m. - Males:
| Millcreek: | 11.3% (1,697) |
| Utah: | 11.9% (95,202) |
8:30 a.m. to 8:59 a.m. - Males:
| Millcreek: | 8.2% (1,232) |
| Utah: | 5.7% (45,602) |
9:00 a.m. to 9:59 a.m. - Males:
| Millcreek: | 8.0% (1,202) |
| Utah: | 6.7% (53,428) |
10:00 a.m. to 10:59 a.m. - Males:
| Millcreek: | 5.0% (747) |
| Utah: | 2.7% (21,311) |
11:00 a.m. to 11:59 a.m. - Males:
| Millcreek: | 2.0% (308) |
| Utah: | 1.4% (10,948) |
12:00 p.m. to 3:59 p.m. - Males:
| Millcreek: | 7.6% (1,144) |
| Utah: | 8.0% (63,596) |
4:00 p.m. to 11:59 p.m. - Males:
| Millcreek: | 6.6% (993) |
| Utah: | 6.2% (49,619) |

12:00 a.m. to 4:59 a.m. - Females:
| Millcreek: | 1.9% (229) |
| Utah: | 3.5% (21,321) |
5:00 a.m. to 5:29 a.m. - Females:
| Millcreek: | 0.9% (105) |
| Utah: | 2.5% (14,985) |
5:30 a.m. to 5:59 a.m. - Females:
| Millcreek: | 2.1% (254) |
| Utah: | 3.3% (20,334) |
6:00 a.m. to 6:29 a.m. - Females:
| Millcreek: | 4.4% (531) |
| Utah: | 5.2% (31,648) |
6:30 a.m. to 6:59 a.m. - Females:
| Millcreek: | 7.1% (854) |
| Utah: | 6.8% (41,656) |
7:00 a.m. to 7:29 a.m. - Females:
| Millcreek: | 12.1% (1,458) |
| Utah: | 12.2% (74,159) |
7:30 a.m. to 7:59 a.m. - Females:
| Millcreek: | 14.8% (1,785) |
| Utah: | 13.5% (82,253) |
8:00 a.m. to 8:29 a.m. - Females:
| Millcreek: | 15.9% (1,921) |
| Utah: | 13.6% (82,652) |
8:30 a.m. to 8:59 a.m. - Females:
| Millcreek: | 10.1% (1,220) |
| Utah: | 8.6% (52,429) |
9:00 a.m. to 9:59 a.m. - Females:
| Millcreek: | 13.4% (1,624) |
| Utah: | 9.4% (57,091) |
10:00 a.m. to 10:59 a.m. - Females:
| Millcreek: | 4.8% (583) |
| Utah: | 3.9% (23,761) |
11:00 a.m. to 11:59 a.m. - Females:
| Millcreek: | 1.9% (232) |
| Utah: | 1.9% (11,465) |
12:00 p.m. to 3:59 p.m. - Females:
| Millcreek: | 4.9% (587) |
| Utah: | 8.6% (52,215) |
4:00 p.m. to 11:59 p.m. - Females:
| Millcreek: | 5.9% (717) |
| Utah: | 6.9% (42,170) |
Travel time to work
Percentage of workers working in this county: 94.3%
Number of people working at home: 6,000 (17.5% of all workers)
Daytime population change due to commuting: +938 (+3.1%)
Workers who live and work in this place: 1,672 (11.0%)
Number of people working at home: 6,000 (17.5% of all workers)
Daytime population change due to commuting: +938 (+3.1%)
Workers who live and work in this place: 1,672 (11.0%)

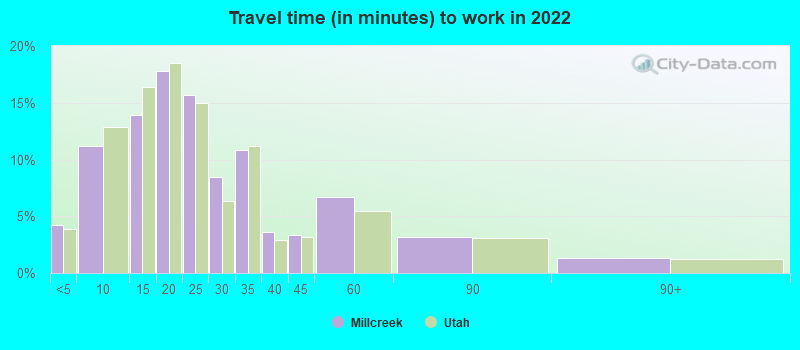

Less than 5 minutes:
| Millcreek: | 4.2% (844) |
| Utah: | 3.9% (54,881) |
5 to 9 minutes:
| Millcreek: | 11.2% (2,231) |
| Utah: | 12.9% (181,846) |
10 to 14 minutes:
| Millcreek: | 13.9% (2,772) |
| Utah: | 16.4% (230,784) |
15 to 19 minutes:
| Millcreek: | 17.8% (3,552) |
| Utah: | 18.5% (260,237) |
20 to 24 minutes:
| Millcreek: | 15.7% (3,134) |
| Utah: | 15.0% (211,717) |
25 to 29 minutes:
| Millcreek: | 8.4% (1,683) |
| Utah: | 6.3% (89,127) |
30 to 34 minutes:
| Millcreek: | 10.9% (2,167) |
| Utah: | 11.2% (157,859) |
35 to 39 minutes:
| Millcreek: | 3.6% (723) |
| Utah: | 2.9% (40,646) |
40 to 44 minutes:
| Millcreek: | 3.3% (668) |
| Utah: | 3.2% (45,163) |
45 to 59 minutes:
| Millcreek: | 6.7% (1,330) |
| Utah: | 5.4% (76,466) |
60 to 89 minutes:
| Millcreek: | 3.2% (641) |
| Utah: | 3.1% (43,718) |
90 or more minutes:
| Millcreek: | 1.3% (260) |
| Utah: | 1.2% (17,404) |


Less than 5 minutes:
| Millcreek: | 2.8% (431) |
| Utah: | 4.2% (43,896) |
5 to 9 minutes:
| Millcreek: | 8.7% (1,325) |
| Utah: | 13.9% (143,317) |
10 to 14 minutes:
| Millcreek: | 15.9% (2,409) |
| Utah: | 16.9% (175,060) |
15 to 19 minutes:
| Millcreek: | 19.6% (2,977) |
| Utah: | 16.8% (173,076) |
20 to 24 minutes:
| Millcreek: | 21.7% (3,294) |
| Utah: | 14.6% (151,080) |
25 to 29 minutes:
| Millcreek: | 6.1% (919) |
| Utah: | 5.3% (54,800) |
30 to 34 minutes:
| Millcreek: | 12.6% (1,910) |
| Utah: | 10.8% (111,752) |
35 to 39 minutes:
| Millcreek: | 1.1% (172) |
| Utah: | 1.8% (18,540) |
40 to 44 minutes:
| Millcreek: | 1.9% (291) |
| Utah: | 2.3% (23,425) |
45 to 59 minutes:
| Millcreek: | 2.6% (401) |
| Utah: | 4.6% (47,093) |
60 to 89 minutes:
| Millcreek: | 2.6% (400) |
| Utah: | 3.0% (30,830) |
90 or more minutes:
| Millcreek: | 1.4% (211) |
| Utah: | 1.6% (16,654) |

Less than 5 minutes - Males:
| Millcreek: | 4.0% (407) |
| Utah: | 3.4% (27,499) |
5 to 9 minutes - Males:
| Millcreek: | 11.5% (1,153) |
| Utah: | 10.8% (86,479) |
10 to 14 minutes - Males:
| Millcreek: | 12.9% (1,303) |
| Utah: | 14.9% (118,960) |
15 to 19 minutes - Males:
| Millcreek: | 17.5% (1,762) |
| Utah: | 18.2% (145,668) |
20 to 24 minutes - Males:
| Millcreek: | 18.1% (1,824) |
| Utah: | 15.3% (122,379) |
25 to 29 minutes - Males:
| Millcreek: | 8.0% (808) |
| Utah: | 6.4% (51,286) |
30 to 34 minutes - Males:
| Millcreek: | 9.4% (942) |
| Utah: | 12.3% (98,589) |
35 to 39 minutes - Males:
| Millcreek: | 2.4% (241) |
| Utah: | 3.0% (24,278) |
40 to 44 minutes - Males:
| Millcreek: | 3.2% (321) |
| Utah: | 3.6% (28,616) |
45 to 59 minutes - Males:
| Millcreek: | 8.4% (847) |
| Utah: | 6.6% (52,847) |
60 to 89 minutes - Males:
| Millcreek: | 3.2% (321) |
| Utah: | 3.8% (30,647) |
90 or more minutes - Males:
| Millcreek: | 1.7% (167) |
| Utah: | 1.6% (13,102) |

Less than 5 minutes - Females:
| Millcreek: | 4.4% (435) |
| Utah: | 4.5% (27,382) |
5 to 9 minutes - Females:
| Millcreek: | 11.0% (1,080) |
| Utah: | 15.6% (95,367) |
10 to 14 minutes - Females:
| Millcreek: | 14.8% (1,464) |
| Utah: | 18.3% (111,824) |
15 to 19 minutes - Females:
| Millcreek: | 18.2% (1,799) |
| Utah: | 18.8% (114,569) |
20 to 24 minutes - Females:
| Millcreek: | 13.2% (1,307) |
| Utah: | 14.7% (89,338) |
25 to 29 minutes - Females:
| Millcreek: | 9.0% (886) |
| Utah: | 6.2% (37,841) |
30 to 34 minutes - Females:
| Millcreek: | 12.1% (1,194) |
| Utah: | 9.7% (59,270) |
35 to 39 minutes - Females:
| Millcreek: | 5.6% (548) |
| Utah: | 2.7% (16,368) |
40 to 44 minutes - Females:
| Millcreek: | 3.5% (342) |
| Utah: | 2.7% (16,547) |
45 to 59 minutes - Females:
| Millcreek: | 4.9% (481) |
| Utah: | 3.9% (23,619) |
60 to 89 minutes - Females:
| Millcreek: | 3.4% (331) |
| Utah: | 2.1% (13,071) |
90 or more minutes - Females:
| Millcreek: | 1.0% (94) |
| Utah: | 0.7% (4,302) |
Means of transportation to work
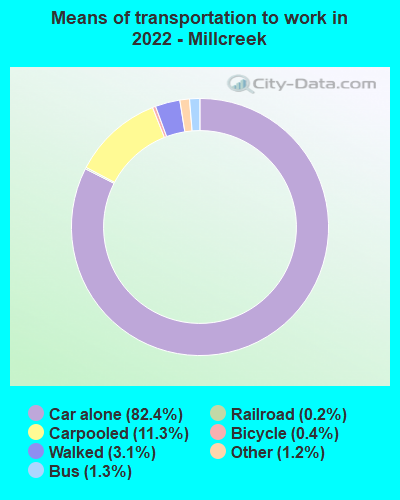
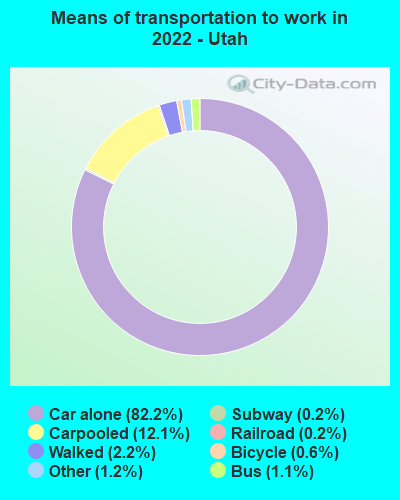
Drove car alone:
| Millcreek: | 82.4% (17,130) |
| Utah: | 82.2% (497,562) |
Carpooled:
| Millcreek: | 11.3% (2,352) |
| Utah: | 12.1% (77,098) |
Bus:
| Millcreek: | 1.3% (268) |
| Utah: | 1.1% (7,825) |
Long-distance train or commuter rail:
| Millcreek: | 0.1% (18) |
| Utah: | 0.2% (815) |
Light rail, streetcar or trolley:
| Millcreek: | 0.2% (52) |
| Utah: | 0.2% (1,172) |
Bicycle:
| Millcreek: | 0.4% (84) |
| Utah: | 0.6% (2,212) |
Walked:
| Millcreek: | 3.1% (644) |
| Utah: | 2.2% (15,823) |
Other means:
| Millcreek: | 1.2% (250) |
| Utah: | 1.2% (6,223) |

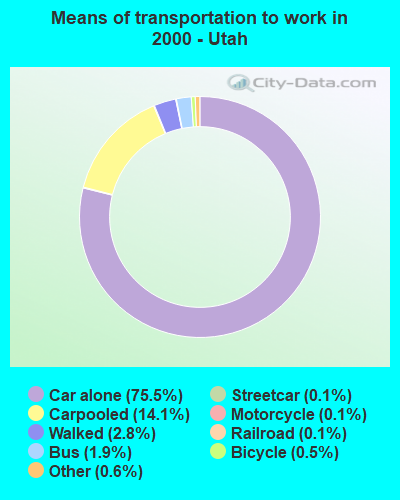
Drove car alone:
| Millcreek: | 76.9% (11,652) |
| Utah: | 75.5% (779,438) |
Carpooled:
| Millcreek: | 13.0% (1,964) |
| Utah: | 14.1% (145,950) |
Bus or trolley bus:
| Millcreek: | 3.4% (517) |
| Utah: | 1.9% (19,910) |
Streetcar or trolley car:
| Millcreek: | 0.2% (26) |
| Utah: | 0.1% (1,077) |
Subway or elevated:
| Millcreek: | 0.4% (55) |
| Utah: | 0.1% (588) |
Railroad:
| Millcreek: | 0.2% (31) |
| Utah: | 0.1% (1,363) |
Motorcycle:
| Millcreek: | 0.1% (22) |
| Utah: | 0.1% (1,284) |
Bicycle:
| Millcreek: | 0.3% (53) |
| Utah: | 0.5% (5,267) |
Walked:
| Millcreek: | 2.5% (377) |
| Utah: | 2.8% (28,523) |
Other means:
| Millcreek: | 0.3% (43) |
| Utah: | 0.6% (5,862) |

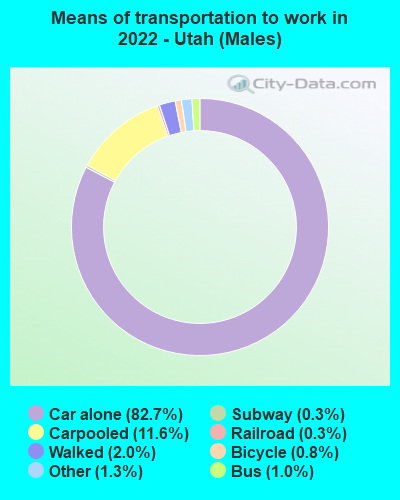
Drove car alone - Males:
| Millcreek: | 82.6% (8,593) |
| Utah: | 82.7% (497,562) |
Carpooled - Males:
| Millcreek: | 9.9% (1,025) |
| Utah: | 11.6% (77,098) |
Bus - Males:
| Millcreek: | 1.5% (160) |
| Utah: | 1.0% (7,825) |
Long-distance train or commuter rail - Males:
| Millcreek: | 0.1% (7) |
| Utah: | 0.3% (815) |
Light rail, streetcar or trolley - Males:
| Millcreek: | 0.5% (52) |
| Utah: | 0.3% (1,172) |
Bicycle - Males:
| Millcreek: | 0.2% (24) |
| Utah: | 0.8% (2,212) |
Walked - Males:
| Millcreek: | 4.0% (413) |
| Utah: | 2.0% (15,823) |
Other means - Males:
| Millcreek: | 1.3% (132) |
| Utah: | 1.3% (6,223) |

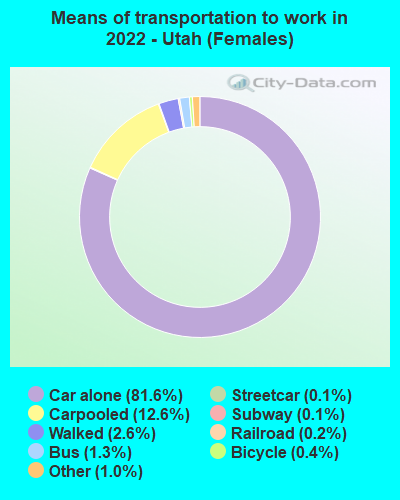
Drove car alone - Females:
| Millcreek: | 82.1% (8,554) |
| Utah: | 81.6% (497,562) |
Carpooled - Females:
| Millcreek: | 12.8% (1,331) |
| Utah: | 12.6% (77,098) |
Bus - Females:
| Millcreek: | 1.0% (108) |
| Utah: | 1.3% (7,825) |
Long-distance train or commuter rail - Females:
| Millcreek: | 0.1% (11) |
| Utah: | 0.1% (815) |
Bicycle - Females:
| Millcreek: | 0.6% (61) |
| Utah: | 0.4% (2,212) |
Walked - Females:
| Millcreek: | 2.2% (230) |
| Utah: | 2.6% (15,823) |
Other means - Females:
| Millcreek: | 1.1% (118) |
| Utah: | 1.0% (6,223) |
Private vehicle occupancy

Drove alone:
| Millcreek: | 88.6% (22,358) |
| Utah: | 87.1% (1,155,419) |
In 2 person carpool:
| Millcreek: | 7.8% (1,970) |
| Utah: | 9.3% (123,426) |
In 3 person carpool:
| Millcreek: | 1.3% (320) |
| Utah: | 1.9% (25,612) |
In 4 person carpool:
| Millcreek: | 1.3% (320) |
| Utah: | 0.9% (12,017) |
In 5-6 person carpool:
| Millcreek: | 0.6% (155) |
| Utah: | 0.5% (6,917) |
In 7+ person carpool:
| Millcreek: | 0.3% (69) |
| Utah: | 0.2% (2,413) |

Drove alone:
| Millcreek: | 85.6% (11,652) |
| Utah: | 84.2% (779,438) |
In 2 person carpool:
| Millcreek: | 12.9% (1,751) |
| Utah: | 12.2% (112,575) |
In 3 person carpool:
| Millcreek: | 1.2% (157) |
| Utah: | 2.2% (19,966) |
In 4 person carpool:
| Millcreek: | 0.3% (36) |
| Utah: | 0.8% (7,439) |
In 5-6 person carpool:
| Millcreek: | 0.1% (20) |
| Utah: | 0.4% (3,682) |
Class of workers
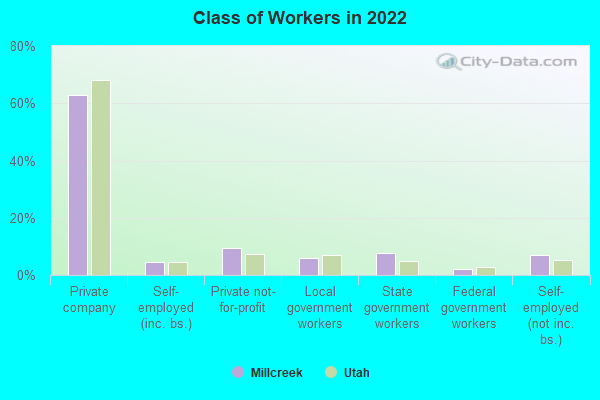
Employee of private company:
| Millcreek: | 62.8% (22,087) |
| Utah: | 68.0% (1,180,825) |
Self-employed in own incorporated business:
| Millcreek: | 4.6% (1,617) |
| Utah: | 4.5% (78,553) |
Private not-for-profit wage and salary workers:
| Millcreek: | 9.6% (3,373) |
| Utah: | 7.2% (124,989) |
Local government workers:
| Millcreek: | 6.0% (2,100) |
| Utah: | 7.1% (122,459) |
State government workers:
| Millcreek: | 7.7% (2,712) |
| Utah: | 5.0% (86,212) |
Federal government workers:
| Millcreek: | 2.1% (743) |
| Utah: | 2.9% (49,847) |
Self-employed workers in own not incorporated business:
| Millcreek: | 6.9% (2,425) |
| Utah: | 5.2% (89,932) |
Unpaid family workers:
| Millcreek: | 0.3% (93) |
| Utah: | 0.2% (3,037) |

Employee of private company:
| Millcreek: | 74.3% (11,426) |
| Utah: | 68.0% (709,966) |
Self-employed in own incorporated business:
| Millcreek: | 2.8% (438) |
| Utah: | 3.9% (40,428) |
Private not-for-profit wage and salary workers:
| Millcreek: | 6.5% (1,001) |
| Utah: | 6.3% (66,081) |
Local government workers:
| Millcreek: | 3.5% (540) |
| Utah: | 5.7% (59,805) |
State government workers:
| Millcreek: | 6.6% (1,022) |
| Utah: | 6.4% (66,879) |
Federal government workers:
| Millcreek: | 1.0% (159) |
| Utah: | 3.6% (37,312) |
Self-employed workers in own not incorporated business:
| Millcreek: | 5.2% (797) |
| Utah: | 5.8% (60,621) |

Employee of private company - Males:
| Millcreek: | 65.1% (12,496) |
| Utah: | 71.9% (694,651) |
Self-employed in own incorporated business - Males:
| Millcreek: | 6.4% (1,220) |
| Utah: | 5.5% (53,093) |
Private not-for-profit wage and salary workers - Males:
| Millcreek: | 7.9% (1,514) |
| Utah: | 5.5% (52,810) |
Local government workers - Males:
| Millcreek: | 4.6% (889) |
| Utah: | 4.6% (44,259) |
State government workers - Males:
| Millcreek: | 5.5% (1,061) |
| Utah: | 4.2% (40,155) |
Federal government workers - Males:
| Millcreek: | 2.7% (516) |
| Utah: | 3.2% (31,169) |
Self-employed workers in own not incorporated business - Males:
| Millcreek: | 7.7% (1,482) |
| Utah: | 5.1% (48,858) |
Unpaid family workers - Males:
| Millcreek: | 0.1% (18) |
| Utah: | 0.1% (1,356) |

Employee of private company - Females:
| Millcreek: | 60.1% (9,591) |
| Utah: | 63.2% (486,174) |
Self-employed in own incorporated business - Females:
| Millcreek: | 2.5% (397) |
| Utah: | 3.3% (25,460) |
Private not-for-profit wage and salary workers - Females:
| Millcreek: | 11.7% (1,859) |
| Utah: | 9.4% (72,179) |
Local government workers - Females:
| Millcreek: | 7.6% (1,211) |
| Utah: | 10.2% (78,200) |
State government workers - Females:
| Millcreek: | 10.3% (1,650) |
| Utah: | 6.0% (46,057) |
Federal government workers - Females:
| Millcreek: | 1.4% (227) |
| Utah: | 2.4% (18,678) |
Self-employed workers in own not incorporated business - Females:
| Millcreek: | 5.9% (942) |
| Utah: | 5.3% (41,074) |
Unpaid family workers - Females:
| Millcreek: | 0.5% (76) |
| Utah: | 0.2% (1,681) |