Work and Jobs in New Braunfels, Texas (TX) Detailed Stats
Occupations, Industries, Unemployment, Workers, Commute
Settings
X


Recent posts about work in New Braunfels, Texas on our local forum with over 2,400,000 registered users:
 | Texas loses jobs in August, but unemployment rate falls to 4.1% (13 replies) |
| Day laborer for landscaping work (5 replies) |
| Looking for a retirement home in New Braunfels area (30 replies) |
| Unemployment Claims by County as of 5/4/20 (14 replies) |
| Texas Carpentry wages? (11 replies) |
| thoughts about New Braunfels? (31 replies) |
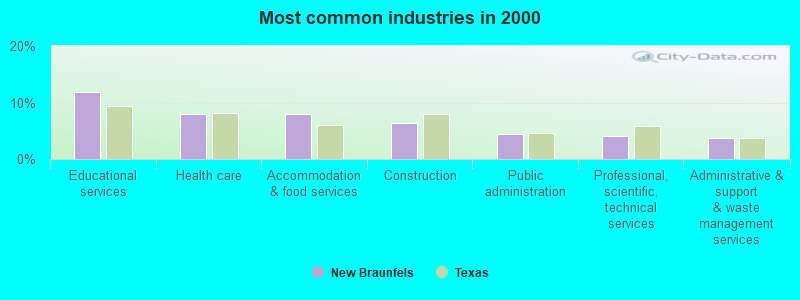
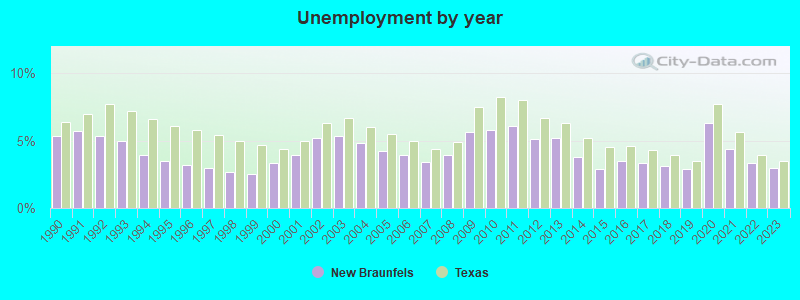
The unemployment rate in 2023 in New Braunfels, TX was 3.0%, which was 16.7% less than the unemployment rate of 3.5% across the entire state of Texas. Compared to the unemployment rate of 5.2% in 2013, this represents a decrease of 73.3%. The most common industries in New Braunfels are: Educational services (11.8% of civilian employees), Health care (7.9% of civilian employees), Accommodation & food services (7.9% of civilian employees). 59.2% of workers work in Comal County and 11.4% of all workers work at home. 70.0% of workers are employees of private companies, which is about the same as the rate of 69.6% across the entire state of Texas.
Whole page based on the data from 2000 / 2022 when the population of New Braunfels, Texas was 36,494 / 98,643
Whole page based on the data from 2000 / 2022 when the population of New Braunfels, Texas was 36,494 / 98,643
Most common industries
Most common industries | |||
|---|---|---|---|
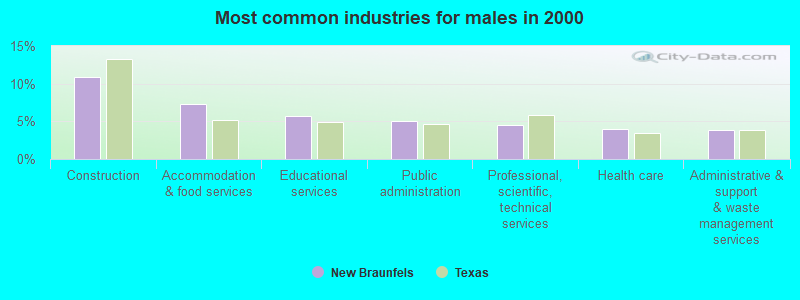
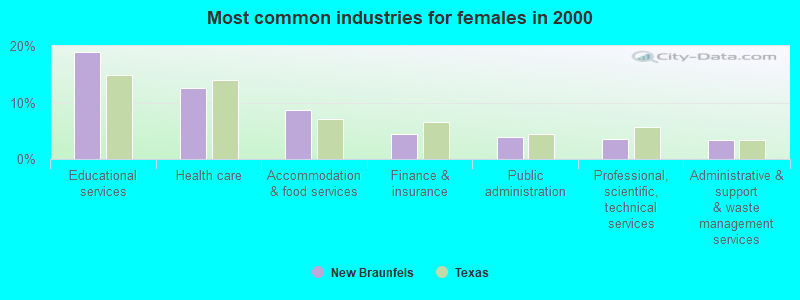
Industry | All | Males | Females |
| Educational services | 11.8% (2,003) | 5.7% (526) | 19.0% (1,477) |
| Health care | 7.9% (1,343) | 4.0% (364) | 12.6% (979) |
| Accommodation and food services | 7.9% (1,341) | 7.2% (665) | 8.7% (676) |
| Construction | 6.3% (1,072) | 10.8% (995) | 1.0% (77) |
| Public administration | 4.5% (763) | 5.0% (463) | 3.9% (300) |
| Professional, scientific, and technical services | 4.1% (698) | 4.6% (419) | 3.6% (279) |
| Administrative and support and waste management services | 3.6% (616) | 3.9% (355) | 3.4% (261) |
| Metal and metal products | 2.9% (497) | 3.8% (348) | 1.9% (149) |
| Finance and insurance | 2.9% (493) | 1.7% (153) | 4.4% (340) |
| Department and other general merchandise stores | 2.8% (474) | 2.5% (225) | 3.2% (249) |
| Real estate and rental and leasing | 2.7% (454) | 2.2% (203) | 3.2% (251) |
| Motor vehicle and parts dealers | 2.3% (390) | 3.7% (339) | 0.7% (51) |
| Arts, entertainment, and recreation | 2.0% (341) | 2.1% (191) | 1.9% (150) |
| Nonmetallic mineral products | 1.9% (315) | 2.8% (261) | 0.7% (54) |
| Food and beverage stores | 1.8% (310) | 1.9% (172) | 1.8% (138) |
| Personal and laundry services | 1.5% (255) | 0.9% (82) | 2.2% (173) |
| Truck transportation | 1.5% (249) | 2.6% (235) | 0.2% (14) |
| Social assistance | 1.5% (248) | 0.2% (22) | 2.9% (226) |
| Broadcasting and telecommunications | 1.4% (237) | 2.0% (179) | 0.7% (58) |
| Textile mills and textile products | 1.4% (231) | 1.4% (132) | 1.3% (99) |
| Repair and maintenance | 1.3% (222) | 2.2% (202) | 0.3% (20) |
| Computer and electronic products | 1.3% (220) | 1.0% (94) | 1.6% (126) |
| Miscellaneous manufacturing | 1.3% (217) | 1.6% (149) | 0.9% (68) |
| Transportation equipment | 1.2% (200) | 1.3% (118) | 1.1% (82) |
| Printing and related support activities | 1.1% (181) | 0.7% (61) | 1.5% (120) |
| Plastics and rubber products | 1.1% (181) | 1.4% (128) | 0.7% (53) |
| Furniture and home furnishings, and household appliance stores | 1.1% (181) | 1.1% (98) | 1.1% (83) |
| Building material and garden equipment and supplies dealers | 1.0% (178) | 1.3% (121) | 0.7% (57) |
| Used merchandise, gift, novelty, and souvenir, and other miscellaneous stores | 1.0% (176) | 0.8% (74) | 1.3% (102) |
| Religious, grantmaking, civic, professional, and similar organizations | 1.0% (173) | 1.2% (110) | 0.8% (63) |
| Other direct selling establishments | 1.0% (167) | 0.7% (64) | 1.3% (103) |
| Utilities | 0.9% (145) | 1.4% (124) | 0.3% (21) |
| Other transportation, and support activities, and couriers | 0.8% (143) | 1.3% (116) | 0.3% (27) |
| Publishing, and motion picture and sound recording industries | 0.8% (136) | 0.9% (84) | 0.7% (52) |
| Food | 0.8% (133) | 1.4% (124) | 0.1% (9) |
| Clothing and accessories, including shoe, stores | 0.7% (123) | 0.2% (22) | 1.3% (101) |
| Agriculture, forestry, fishing and hunting | 0.7% (112) | 1.0% (95) | 0.2% (17) |
| Mining, quarrying, and oil and gas extraction | 0.6% (107) | 1.1% (98) | 0.1% (9) |
| Pharmacies and drug stores | 0.6% (103) | 0.7% (62) | 0.5% (41) |
| Machinery | 0.6% (100) | 0.6% (54) | 0.6% (46) |
| Groceries and related products merchant wholesalers | 0.6% (100) | 1.0% (92) | 0.1% (8) |
| Wood products | 0.5% (92) | 0.8% (70) | 0.3% (22) |
| U. S. Postal service | 0.5% (90) | 0.6% (58) | 0.4% (32) |
| Electrical equipment, appliances, and components | 0.5% (84) | 0.7% (62) | 0.3% (22) |
| Private households | 0.5% (77) | 0.1% (10) | 0.9% (67) |
| Sporting goods, camera, and hobby and toy stores | 0.4% (65) | 0.4% (34) | 0.4% (31) |
| Radio, TV, and computer stores | 0.4% (65) | 0.4% (36) | 0.4% (29) |
| Machinery, equipment, and supplies merchant wholesalers | 0.3% (52) | 0.3% (30) | 0.3% (22) |
| Lumber and other construction materials merchant wholesalers | 0.3% (50) | 0.4% (34) | 0.2% (16) |
| Miscellaneous durable goods merchant wholesalers | 0.3% (49) | 0.3% (29) | 0.3% (20) |
| Jewelry, luggage, and leather goods stores | 0.3% (48) | 0.3% (32) | 0.2% (16) |
| Warehousing and storage | 0.3% (47) | 0.1% (10) | 0.5% (37) |
| Data processing, libraries, and other information services | 0.3% (43) | 0.0% (0) | 0.6% (43) |
| Miscellaneous nondurable goods merchant wholesalers | 0.3% (43) | 0.2% (19) | 0.3% (24) |
| Rail transportation | 0.2% (41) | 0.4% (41) | 0.0% (0) |
| Furniture and related product manufacturing | 0.2% (40) | 0.3% (29) | 0.1% (11) |
| Apparel | 0.2% (39) | 0.0% (0) | 0.5% (39) |
| Leather and allied products | 0.2% (39) | 0.2% (18) | 0.3% (21) |
| Motor vehicles, parts and supplies merchant wholesalers | 0.2% (37) | 0.3% (30) | 0.1% (7) |
| Electrical and electronic goods merchant wholesalers | 0.2% (35) | 0.4% (35) | 0.0% (0) |
| Petroleum and petroleum products merchant wholesalers | 0.2% (32) | 0.2% (22) | 0.1% (10) |
| Gasoline stations | 0.2% (30) | 0.2% (22) | 0.1% (8) |
| Health and personal care, except drug, stores | 0.1% (24) | 0.1% (6) | 0.2% (18) |
| Sewing, needlework, and piece goods stores | 0.1% (23) | 0.1% (6) | 0.2% (17) |
| Electronic shopping and mail-order houses | 0.1% (23) | 0.1% (13) | 0.1% (10) |
| Hardware, plumbing and heating equipment, and supplies merchant wholesalers | 0.1% (20) | 0.1% (13) | 0.1% (7) |
| Professional and commercial equipment and supplies merchant wholesalers | 0.1% (19) | 0.2% (19) | 0.0% (0) |
| Office supplies and stationery stores | 0.1% (19) | 0.1% (9) | 0.1% (10) |
| Retail florists | 0.1% (19) | 0.2% (19) | 0.0% (0) |
| Air transportation | 0.1% (18) | 0.1% (11) | 0.1% (7) |
| Alcoholic beverages merchant wholesalers | 0.1% (14) | 0.2% (14) | 0.0% (0) |
Unemployment in New Braunfels
- Unemployment by race in 2022
- Unemployment rate for White non-Hispanic residents
- 0.9%Males
- 8.4%Females
- Unemployment rate for Black residents
- 3.4%Males
- Unemployment rate for American Indian and Alaska Native residents
- 38.9%Females
- Unemployment rate for Asian residents
- 1.4%Females
- Unemployment rate for other race residents
- 1.5%Males
- 3.7%Females
- Unemployment rate for two or more race residents
- 3.4%Males
- 1.5%Females
- Unemployment rate for Hispanic or Latino residents
- 1.8%Males
- 1.0%Females
- Unemployment by race in 2000
- Unemployment rate for White non-Hispanic residents
- 1.8%Males
- 4.2%Females
- Unemployment rate for Black residents
- 22.2%Males
- Unemployment rate for Asian residents
- 8.8%Males
- Unemployment rate for other race residents
- 4.6%Males
- 10.4%Females
- Unemployment rate for Hispanic or Latino residents
- 3.3%Males
- 7.5%Females
Unemployment in 2023:
| New Braunfels: | 3.0% |
| Texas: | 3.5% |
Unemployment in 2022:
| New Braunfels: | 3.3% |
| Texas: | 3.9% |
Unemployment in 2021:
| New Braunfels: | 4.4% |
| Texas: | 5.6% |
Unemployment in 2020:
| New Braunfels: | 6.3% |
| Texas: | 7.7% |
Unemployment in 2019:
| New Braunfels: | 2.9% |
| Texas: | 3.5% |
Unemployment in 2018:
| New Braunfels: | 3.1% |
| Texas: | 3.9% |
Unemployment in 2017:
| New Braunfels: | 3.3% |
| Texas: | 4.3% |
Unemployment in 2016:
| New Braunfels: | 3.5% |
| Texas: | 4.6% |
Unemployment in 2015:
| New Braunfels: | 2.9% |
| Texas: | 4.5% |
Unemployment in 2014:
| New Braunfels: | 3.8% |
| Texas: | 5.2% |
Unemployment in 2013:
| New Braunfels: | 5.2% |
| Texas: | 6.3% |
Unemployment in 2012:
| New Braunfels: | 5.1% |
| Texas: | 6.7% |
Unemployment in 2011:
| New Braunfels: | 6.1% |
| Texas: | 8.0% |
Unemployment in 2010:
| New Braunfels: | 5.8% |
| Texas: | 8.2% |
Unemployment in 2009:
| New Braunfels: | 5.6% |
| Texas: | 7.5% |
Unemployment in 2008:
| New Braunfels: | 3.9% |
| Texas: | 4.9% |
Unemployment in 2007:
| New Braunfels: | 3.4% |
| Texas: | 4.4% |
Unemployment in 2006:
| New Braunfels: | 3.9% |
| Texas: | 5.0% |
Unemployment in 2005:
| New Braunfels: | 4.2% |
| Texas: | 5.5% |
Unemployment in 2004:
| New Braunfels: | 4.8% |
| Texas: | 6.0% |
Unemployment in 2003:
| New Braunfels: | 5.3% |
| Texas: | 6.7% |
Unemployment in 2002:
| New Braunfels: | 5.2% |
| Texas: | 6.3% |
Unemployment in 2001:
| New Braunfels: | 3.9% |
| Texas: | 5.0% |
Unemployment in 2000:
| New Braunfels: | 3.3% |
| Texas: | 4.4% |
Unemployment in 1999:
| New Braunfels: | 2.5% |
| Texas: | 4.7% |
Unemployment in 1998:
| New Braunfels: | 2.7% |
| Texas: | 5.0% |
Unemployment in 1997:
| New Braunfels: | 3.0% |
| Texas: | 5.4% |
Unemployment in 1996:
| New Braunfels: | 3.2% |
| Texas: | 5.8% |
Unemployment in 1995:
| New Braunfels: | 3.5% |
| Texas: | 6.1% |
Unemployment in 1994:
| New Braunfels: | 3.9% |
| Texas: | 6.6% |
Unemployment in 1993:
| New Braunfels: | 5.0% |
| Texas: | 7.2% |
Unemployment in 1992:
| New Braunfels: | 5.3% |
| Texas: | 7.7% |
Unemployment in 1991:
| New Braunfels: | 5.7% |
| Texas: | 7.0% |
Unemployment in 1990:
| New Braunfels: | 5.3% |
| Texas: | 6.4% |
Time leaving home to go to work
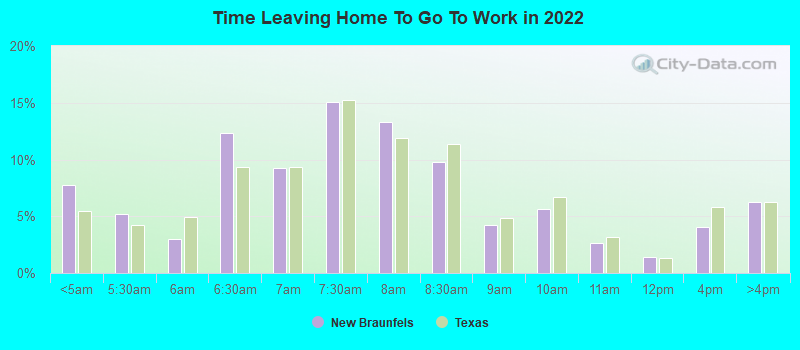
12:00 a.m. to 4:59 a.m.:
| New Braunfels: | 7.8% (3,423) |
| Texas: | 5.5% (678,264) |
5:00 a.m. to 5:29 a.m.:
| New Braunfels: | 5.2% (2,299) |
| Texas: | 4.3% (525,841) |
5:30 a.m. to 5:59 a.m.:
| New Braunfels: | 3.0% (1,321) |
| Texas: | 4.9% (603,953) |
6:00 a.m. to 6:29 a.m.:
| New Braunfels: | 12.4% (5,448) |
| Texas: | 9.4% (1,155,020) |
6:30 a.m. to 6:59 a.m.:
| New Braunfels: | 9.3% (4,080) |
| Texas: | 9.3% (1,152,822) |
7:00 a.m. to 7:29 a.m.:
| New Braunfels: | 15.0% (6,629) |
| Texas: | 15.3% (1,885,477) |
7:30 a.m. to 7:59 a.m.:
| New Braunfels: | 13.3% (5,852) |
| Texas: | 11.9% (1,469,628) |
8:00 a.m. to 8:29 a.m.:
| New Braunfels: | 9.8% (4,296) |
| Texas: | 11.3% (1,400,175) |
8:30 a.m. to 8:59 a.m.:
| New Braunfels: | 4.2% (1,864) |
| Texas: | 4.9% (599,574) |
9:00 a.m. to 9:59 a.m.:
| New Braunfels: | 5.7% (2,495) |
| Texas: | 6.7% (829,367) |
10:00 a.m. to 10:59 a.m.:
| New Braunfels: | 2.7% (1,177) |
| Texas: | 3.2% (390,354) |
11:00 a.m. to 11:59 a.m.:
| New Braunfels: | 1.4% (602) |
| Texas: | 1.3% (162,330) |
12:00 p.m. to 3:59 p.m.:
| New Braunfels: | 4.1% (1,799) |
| Texas: | 5.8% (720,594) |
4:00 p.m. to 11:59 p.m.:
| New Braunfels: | 6.3% (2,763) |
| Texas: | 6.3% (777,072) |

<5am:
| New Braunfels: | 2.8% (469) |
| Texas: | 3.1% (281,361) |
5:30am:
| New Braunfels: | 2.8% (472) |
| Texas: | 2.9% (262,060) |
6am:
| New Braunfels: | 3.2% (538) |
| Texas: | 4.4% (403,423) |
6:30am:
| New Braunfels: | 6.6% (1,106) |
| Texas: | 8.8% (808,876) |
7am:
| New Braunfels: | 11.6% (1,944) |
| Texas: | 10.7% (976,557) |
7:30am:
| New Braunfels: | 15.7% (2,625) |
| Texas: | 16.4% (1,500,904) |
8am:
| New Braunfels: | 19.0% (3,180) |
| Texas: | 16.8% (1,536,308) |
8:30am:
| New Braunfels: | 10.7% (1,784) |
| Texas: | 10.0% (913,601) |
9am:
| New Braunfels: | 4.6% (760) |
| Texas: | 4.4% (398,656) |
10am:
| New Braunfels: | 5.4% (894) |
| Texas: | 5.2% (472,592) |
11am:
| New Braunfels: | 2.1% (354) |
| Texas: | 2.2% (197,844) |
12pm:
| New Braunfels: | 0.6% (107) |
| Texas: | 0.9% (86,997) |
4pm:
| New Braunfels: | 5.3% (880) |
| Texas: | 5.5% (503,565) |
>4pm:
| New Braunfels: | 6.6% (1,101) |
| Texas: | 6.1% (563,107) |

12:00 a.m. to 4:59 a.m. - Males:
| New Braunfels: | 10.4% (2,523) |
| Texas: | 7.0% (477,284) |
5:00 a.m. to 5:29 a.m. - Males:
| New Braunfels: | 5.8% (1,419) |
| Texas: | 5.8% (394,876) |
5:30 a.m. to 5:59 a.m. - Males:
| New Braunfels: | 3.6% (870) |
| Texas: | 5.9% (402,788) |
6:00 a.m. to 6:29 a.m. - Males:
| New Braunfels: | 16.0% (3,896) |
| Texas: | 10.9% (751,118) |
6:30 a.m. to 6:59 a.m. - Males:
| New Braunfels: | 6.0% (1,456) |
| Texas: | 9.5% (652,306) |
7:00 a.m. to 7:29 a.m. - Males:
| New Braunfels: | 13.8% (3,344) |
| Texas: | 14.1% (970,598) |
7:30 a.m. to 7:59 a.m. - Males:
| New Braunfels: | 11.3% (2,747) |
| Texas: | 10.2% (696,429) |
8:00 a.m. to 8:29 a.m. - Males:
| New Braunfels: | 9.7% (2,361) |
| Texas: | 10.6% (729,041) |
8:30 a.m. to 8:59 a.m. - Males:
| New Braunfels: | 1.9% (451) |
| Texas: | 4.1% (281,762) |
9:00 a.m. to 9:59 a.m. - Males:
| New Braunfels: | 5.0% (1,226) |
| Texas: | 5.8% (401,071) |
10:00 a.m. to 10:59 a.m. - Males:
| New Braunfels: | 3.5% (862) |
| Texas: | 2.7% (186,469) |
11:00 a.m. to 11:59 a.m. - Males:
| New Braunfels: | 1.1% (278) |
| Texas: | 1.2% (82,242) |
12:00 p.m. to 3:59 p.m. - Males:
| New Braunfels: | 4.0% (967) |
| Texas: | 5.8% (397,795) |
4:00 p.m. to 11:59 p.m. - Males:
| New Braunfels: | 7.8% (1,888) |
| Texas: | 6.4% (435,950) |

12:00 a.m. to 4:59 a.m. - Females:
| New Braunfels: | 4.6% (900) |
| Texas: | 3.7% (200,980) |
5:00 a.m. to 5:29 a.m. - Females:
| New Braunfels: | 4.5% (880) |
| Texas: | 2.4% (130,965) |
5:30 a.m. to 5:59 a.m. - Females:
| New Braunfels: | 2.3% (451) |
| Texas: | 3.7% (201,165) |
6:00 a.m. to 6:29 a.m. - Females:
| New Braunfels: | 7.9% (1,552) |
| Texas: | 7.4% (403,902) |
6:30 a.m. to 6:59 a.m. - Females:
| New Braunfels: | 13.3% (2,624) |
| Texas: | 9.1% (500,516) |
7:00 a.m. to 7:29 a.m. - Females:
| New Braunfels: | 16.6% (3,285) |
| Texas: | 16.7% (914,879) |
7:30 a.m. to 7:59 a.m. - Females:
| New Braunfels: | 15.7% (3,105) |
| Texas: | 14.1% (773,199) |
8:00 a.m. to 8:29 a.m. - Females:
| New Braunfels: | 9.8% (1,935) |
| Texas: | 12.2% (671,134) |
8:30 a.m. to 8:59 a.m. - Females:
| New Braunfels: | 7.2% (1,413) |
| Texas: | 5.8% (317,812) |
9:00 a.m. to 9:59 a.m. - Females:
| New Braunfels: | 6.4% (1,269) |
| Texas: | 7.8% (428,296) |
10:00 a.m. to 10:59 a.m. - Females:
| New Braunfels: | 1.6% (315) |
| Texas: | 3.7% (203,885) |
11:00 a.m. to 11:59 a.m. - Females:
| New Braunfels: | 1.6% (324) |
| Texas: | 1.5% (80,088) |
12:00 p.m. to 3:59 p.m. - Females:
| New Braunfels: | 4.2% (832) |
| Texas: | 5.9% (322,799) |
4:00 p.m. to 11:59 p.m. - Females:
| New Braunfels: | 4.4% (875) |
| Texas: | 6.2% (341,122) |
Travel time to work
Percentage of workers working in this county: 59.2%
Number of people working at home: 5,588 (11.4% of all workers)
Daytime population change due to commuting: +5,700 (+15.6%)
Workers who live and work in this city: 10,124 (60.6%)
Number of people working at home: 5,588 (11.4% of all workers)
Daytime population change due to commuting: +5,700 (+15.6%)
Workers who live and work in this city: 10,124 (60.6%)

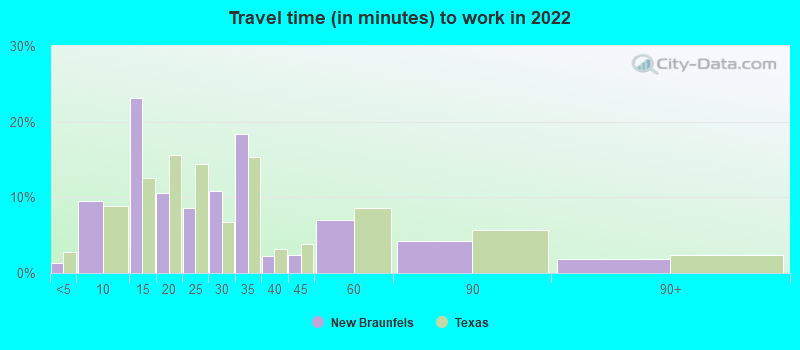

Less than 5 minutes:
| New Braunfels: | 1.4% (636) |
| Texas: | 2.8% (350,462) |
5 to 9 minutes:
| New Braunfels: | 9.5% (4,353) |
| Texas: | 8.8% (1,087,762) |
10 to 14 minutes:
| New Braunfels: | 23.1% (10,609) |
| Texas: | 12.6% (1,550,271) |
15 to 19 minutes:
| New Braunfels: | 10.6% (4,856) |
| Texas: | 15.6% (1,918,353) |
20 to 24 minutes:
| New Braunfels: | 8.6% (3,937) |
| Texas: | 14.4% (1,772,079) |
25 to 29 minutes:
| New Braunfels: | 10.8% (4,963) |
| Texas: | 6.7% (827,833) |
30 to 34 minutes:
| New Braunfels: | 18.4% (8,469) |
| Texas: | 15.3% (1,887,878) |
35 to 39 minutes:
| New Braunfels: | 2.2% (1,034) |
| Texas: | 3.2% (394,170) |
40 to 44 minutes:
| New Braunfels: | 2.4% (1,121) |
| Texas: | 3.9% (476,118) |
45 to 59 minutes:
| New Braunfels: | 7.0% (3,235) |
| Texas: | 8.6% (1,058,376) |
60 to 89 minutes:
| New Braunfels: | 4.2% (1,945) |
| Texas: | 5.7% (706,002) |
90 or more minutes:
| New Braunfels: | 1.8% (836) |
| Texas: | 2.4% (299,884) |


Less than 5 minutes:
| New Braunfels: | 3.9% (655) |
| Texas: | 3.0% (277,642) |
5 to 9 minutes:
| New Braunfels: | 16.4% (2,742) |
| Texas: | 10.3% (942,891) |
10 to 14 minutes:
| New Braunfels: | 21.6% (3,612) |
| Texas: | 14.4% (1,317,555) |
15 to 19 minutes:
| New Braunfels: | 15.2% (2,533) |
| Texas: | 16.0% (1,467,945) |
20 to 24 minutes:
| New Braunfels: | 9.0% (1,497) |
| Texas: | 13.9% (1,276,781) |
25 to 29 minutes:
| New Braunfels: | 5.2% (860) |
| Texas: | 5.3% (482,838) |
30 to 34 minutes:
| New Braunfels: | 10.1% (1,682) |
| Texas: | 14.3% (1,309,699) |
35 to 39 minutes:
| New Braunfels: | 2.5% (425) |
| Texas: | 2.4% (219,873) |
40 to 44 minutes:
| New Braunfels: | 2.6% (431) |
| Texas: | 3.1% (280,916) |
45 to 59 minutes:
| New Braunfels: | 5.6% (932) |
| Texas: | 7.6% (692,006) |
60 to 89 minutes:
| New Braunfels: | 2.7% (459) |
| Texas: | 4.6% (418,905) |
90 or more minutes:
| New Braunfels: | 2.3% (386) |
| Texas: | 2.4% (218,800) |

Less than 5 minutes - Males:
| New Braunfels: | 0.4% (104) |
| Texas: | 2.7% (181,937) |
5 to 9 minutes - Males:
| New Braunfels: | 8.7% (2,023) |
| Texas: | 7.6% (522,166) |
10 to 14 minutes - Males:
| New Braunfels: | 18.9% (4,382) |
| Texas: | 11.5% (785,572) |
15 to 19 minutes - Males:
| New Braunfels: | 9.4% (2,186) |
| Texas: | 14.6% (1,001,179) |
20 to 24 minutes - Males:
| New Braunfels: | 7.5% (1,745) |
| Texas: | 13.9% (950,043) |
25 to 29 minutes - Males:
| New Braunfels: | 12.6% (2,922) |
| Texas: | 6.7% (457,259) |
30 to 34 minutes - Males:
| New Braunfels: | 22.8% (5,282) |
| Texas: | 16.2% (1,110,357) |
35 to 39 minutes - Males:
| New Braunfels: | 2.9% (681) |
| Texas: | 3.3% (223,512) |
40 to 44 minutes - Males:
| New Braunfels: | 3.4% (794) |
| Texas: | 4.2% (289,434) |
45 to 59 minutes - Males:
| New Braunfels: | 7.1% (1,645) |
| Texas: | 9.3% (639,122) |
60 to 89 minutes - Males:
| New Braunfels: | 3.8% (873) |
| Texas: | 6.8% (467,154) |
90 or more minutes - Males:
| New Braunfels: | 2.4% (567) |
| Texas: | 3.1% (211,313) |

Less than 5 minutes - Females:
| New Braunfels: | 2.3% (532) |
| Texas: | 3.1% (168,525) |
5 to 9 minutes - Females:
| New Braunfels: | 10.2% (2,330) |
| Texas: | 10.3% (565,596) |
10 to 14 minutes - Females:
| New Braunfels: | 27.3% (6,227) |
| Texas: | 13.9% (764,699) |
15 to 19 minutes - Females:
| New Braunfels: | 11.7% (2,670) |
| Texas: | 16.7% (917,174) |
20 to 24 minutes - Females:
| New Braunfels: | 9.6% (2,192) |
| Texas: | 15.0% (822,036) |
25 to 29 minutes - Females:
| New Braunfels: | 9.0% (2,041) |
| Texas: | 6.7% (370,574) |
30 to 34 minutes - Females:
| New Braunfels: | 14.0% (3,187) |
| Texas: | 14.2% (777,521) |
35 to 39 minutes - Females:
| New Braunfels: | 1.5% (353) |
| Texas: | 3.1% (170,658) |
40 to 44 minutes - Females:
| New Braunfels: | 1.4% (327) |
| Texas: | 3.4% (186,684) |
45 to 59 minutes - Females:
| New Braunfels: | 7.0% (1,590) |
| Texas: | 7.6% (419,254) |
60 to 89 minutes - Females:
| New Braunfels: | 4.7% (1,072) |
| Texas: | 4.4% (238,848) |
90 or more minutes - Females:
| New Braunfels: | 1.2% (269) |
| Texas: | 1.6% (88,571) |
Means of transportation to work
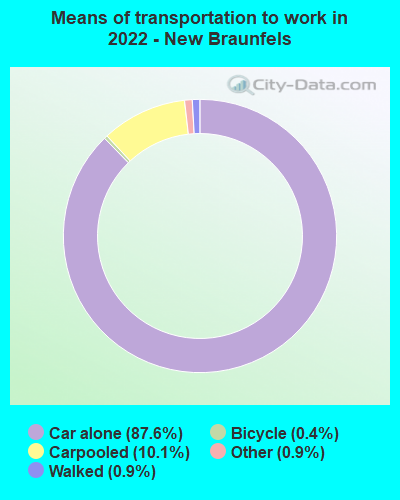

Drove car alone:
| New Braunfels: | 87.6% (39,944) |
| Texas: | 83.3% (4,557,023) |
Carpooled:
| New Braunfels: | 10.1% (4,590) |
| Texas: | 11.7% (674,818) |
Bus:
| New Braunfels: | 0.1% (31) |
| Texas: | 0.9% (50,435) |
Ferryboat:
| New Braunfels: | 0.1% (31) |
| Texas: | 0.0% (456) |
Bicycle:
| New Braunfels: | 0.4% (170) |
| Texas: | 0.2% (7,954) |
Walked:
| New Braunfels: | 0.9% (428) |
| Texas: | 1.7% (99,911) |
Other means:
| New Braunfels: | 0.9% (406) |
| Texas: | 2.0% (95,481) |


Drove car alone:
| New Braunfels: | 81.1% (13,538) |
| Texas: | 77.7% (7,115,590) |
Carpooled:
| New Braunfels: | 13.0% (2,173) |
| Texas: | 14.5% (1,326,012) |
Bus or trolley bus:
| New Braunfels: | 0.1% (16) |
| Texas: | 1.7% (157,014) |
Motorcycle:
| New Braunfels: | 0.2% (30) |
| Texas: | 0.1% (12,068) |
Bicycle:
| New Braunfels: | 0.0% (7) |
| Texas: | 0.2% (21,551) |
Walked:
| New Braunfels: | 1.7% (290) |
| Texas: | 1.9% (173,670) |
Other means:
| New Braunfels: | 1.0% (160) |
| Texas: | 0.9% (86,692) |


Drove car alone - Males:
| New Braunfels: | 87.6% (20,366) |
| Texas: | 83.6% (4,557,023) |
Carpooled - Males:
| New Braunfels: | 9.9% (2,308) |
| Texas: | 11.2% (674,818) |
Bus - Males:
| New Braunfels: | 0.0% (1) |
| Texas: | 0.8% (50,435) |
Bicycle - Males:
| New Braunfels: | 0.7% (169) |
| Texas: | 0.3% (7,954) |
Walked - Males:
| New Braunfels: | 1.1% (250) |
| Texas: | 1.7% (99,911) |
Other means - Males:
| New Braunfels: | 0.7% (157) |
| Texas: | 2.2% (95,481) |


Drove car alone - Females:
| New Braunfels: | 87.6% (19,593) |
| Texas: | 83.0% (4,557,023) |
Carpooled - Females:
| New Braunfels: | 10.2% (2,284) |
| Texas: | 12.3% (674,818) |
Bus - Females:
| New Braunfels: | 0.1% (31) |
| Texas: | 0.9% (50,435) |
Ferryboat - Females:
| New Braunfels: | 0.1% (32) |
| Texas: | 0.0% (456) |
Walked - Females:
| New Braunfels: | 0.8% (178) |
| Texas: | 1.8% (99,911) |
Other means - Females:
| New Braunfels: | 1.1% (250) |
| Texas: | 1.7% (95,481) |
Private vehicle occupancy

Drove alone:
| New Braunfels: | 89.2% (35,982) |
| Texas: | 87.6% (10,283,021) |
In 2 person carpool:
| New Braunfels: | 6.2% (2,488) |
| Texas: | 9.0% (1,052,595) |
In 3 person carpool:
| New Braunfels: | 3.4% (1,380) |
| Texas: | 2.1% (244,139) |
In 4 person carpool:
| New Braunfels: | 0.5% (206) |
| Texas: | 0.8% (92,732) |
In 5-6 person carpool:
| New Braunfels: | 0.5% (217) |
| Texas: | 0.4% (44,947) |
In 7+ person carpool:
| New Braunfels: | 0.1% (41) |
| Texas: | 0.1% (16,725) |

Drove alone:
| New Braunfels: | 86.2% (13,538) |
| Texas: | 84.3% (7,115,590) |
In 2 person carpool:
| New Braunfels: | 10.1% (1,590) |
| Texas: | 11.6% (982,994) |
In 3 person carpool:
| New Braunfels: | 2.4% (373) |
| Texas: | 2.4% (201,602) |
In 4 person carpool:
| New Braunfels: | 0.6% (96) |
| Texas: | 1.0% (83,518) |
In 5-6 person carpool:
| New Braunfels: | 0.5% (82) |
| Texas: | 0.5% (40,662) |
In 7+ person carpool:
| New Braunfels: | 0.2% (32) |
| Texas: | 0.2% (17,236) |
Class of workers
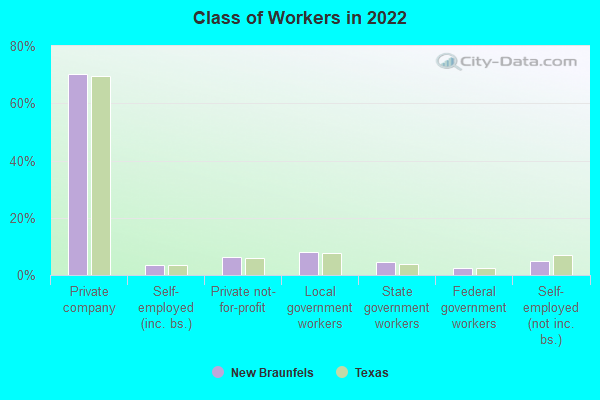
Employee of private company:
| New Braunfels: | 70.0% (36,679) |
| Texas: | 69.6% (10,139,666) |
Self-employed in own incorporated business:
| New Braunfels: | 3.4% (1,763) |
| Texas: | 3.5% (516,446) |
Private not-for-profit wage and salary workers:
| New Braunfels: | 6.4% (3,367) |
| Texas: | 6.0% (870,454) |
Local government workers:
| New Braunfels: | 7.9% (4,128) |
| Texas: | 7.6% (1,109,799) |
State government workers:
| New Braunfels: | 4.7% (2,443) |
| Texas: | 3.8% (558,618) |
Federal government workers:
| New Braunfels: | 2.6% (1,347) |
| Texas: | 2.5% (357,298) |
Self-employed workers in own not incorporated business:
| New Braunfels: | 5.0% (2,637) |
| Texas: | 6.8% (998,270) |

Employee of private company:
| New Braunfels: | 65.9% (11,173) |
| Texas: | 69.6% (6,425,274) |
Self-employed in own incorporated business:
| New Braunfels: | 3.6% (619) |
| Texas: | 2.7% (250,864) |
Private not-for-profit wage and salary workers:
| New Braunfels: | 7.4% (1,253) |
| Texas: | 5.7% (526,631) |
Local government workers:
| New Braunfels: | 7.8% (1,319) |
| Texas: | 6.6% (608,479) |
State government workers:
| New Braunfels: | 4.8% (816) |
| Texas: | 5.4% (501,082) |
Federal government workers:
| New Braunfels: | 2.4% (410) |
| Texas: | 2.6% (237,177) |
Self-employed workers in own not incorporated business:
| New Braunfels: | 7.8% (1,320) |
| Texas: | 7.1% (653,527) |
Unpaid family workers:
| New Braunfels: | 0.3% (49) |
| Texas: | 0.3% (31,338) |

Employee of private company - Males:
| New Braunfels: | 67.9% (19,526) |
| Texas: | 73.1% (5,788,450) |
Self-employed in own incorporated business - Males:
| New Braunfels: | 5.3% (1,527) |
| Texas: | 4.2% (332,655) |
Private not-for-profit wage and salary workers - Males:
| New Braunfels: | 6.9% (1,987) |
| Texas: | 4.1% (323,476) |
Local government workers - Males:
| New Braunfels: | 5.3% (1,538) |
| Texas: | 5.1% (405,467) |
State government workers - Males:
| New Braunfels: | 6.6% (1,911) |
| Texas: | 3.0% (236,706) |
Federal government workers - Males:
| New Braunfels: | 3.9% (1,114) |
| Texas: | 2.7% (211,629) |
Self-employed workers in own not incorporated business - Males:
| New Braunfels: | 4.0% (1,161) |
| Texas: | 7.7% (609,246) |

Employee of private company - Females:
| New Braunfels: | 72.7% (17,153) |
| Texas: | 65.4% (4,351,216) |
Self-employed in own incorporated business - Females:
| New Braunfels: | 1.0% (236) |
| Texas: | 2.8% (183,791) |
Private not-for-profit wage and salary workers - Females:
| New Braunfels: | 5.8% (1,380) |
| Texas: | 8.2% (546,978) |
Local government workers - Females:
| New Braunfels: | 11.0% (2,590) |
| Texas: | 10.6% (704,332) |
State government workers - Females:
| New Braunfels: | 2.3% (532) |
| Texas: | 4.8% (321,912) |
Federal government workers - Females:
| New Braunfels: | 1.0% (233) |
| Texas: | 2.2% (145,669) |
Self-employed workers in own not incorporated business - Females:
| New Braunfels: | 6.3% (1,476) |
| Texas: | 5.8% (389,024) |