Work and Jobs in New York, New York (NY) Detailed Stats
Occupations, Industries, Unemployment, Workers, Commute
Settings
X


Recent posts about work in New York, New York on our local forum with over 2,400,000 registered users:

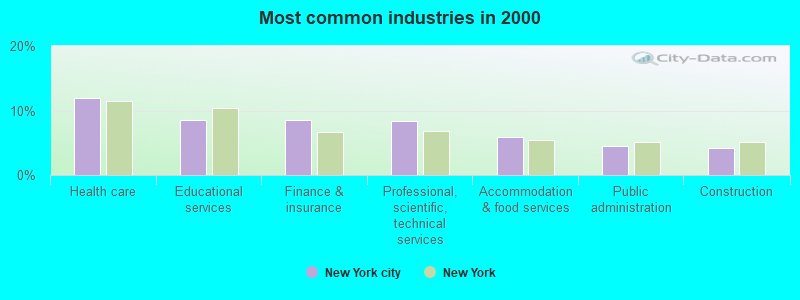
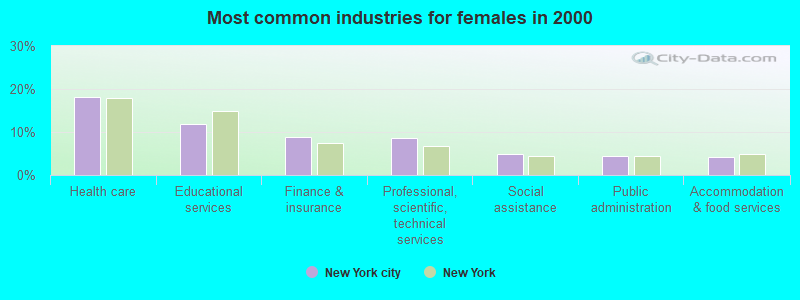
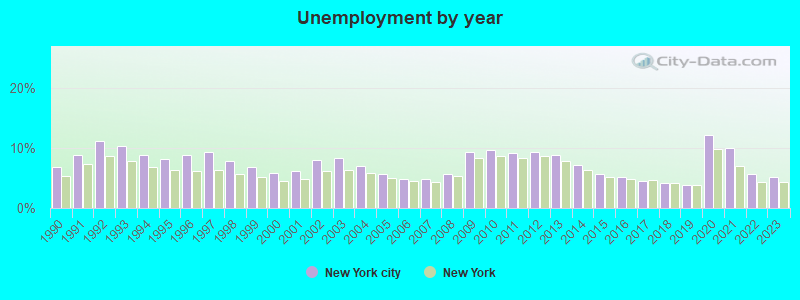
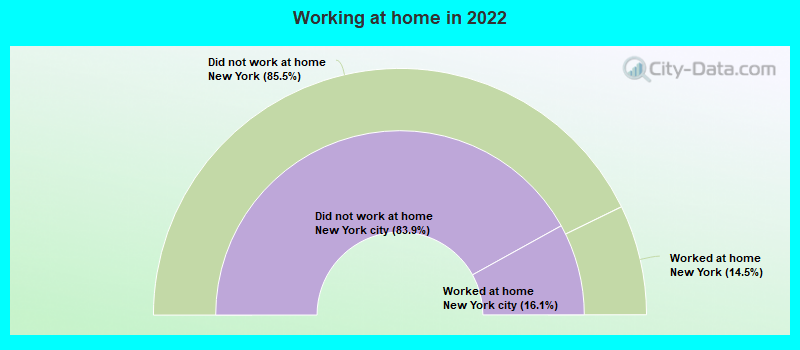
The unemployment rate in 2023 in New York, NY was 5.1%, which was 13.7% greater than the unemployment rate of 4.4% across the entire state of New York. Compared to the unemployment rate of 8.8% in 2013, this represents a decrease of 72.5%. According to 2022 data, the most common industries in New York are: Health care (14.2% of civilian employees), Professional, scientific, technical services (10.7% of civilian employees), Educational services (9.7% of civilian employees). 62.4% of workers work in New York County and 16.1% of all workers work at home. 64.4% of workers are employees of private companies, which is 3.6% greater than the rate of 62.2% across the entire state of New York.
Whole page based on the data from 2000 / 2022 when the population of New York, New York was 8,008,278 / 8,335,897
Whole page based on the data from 2000 / 2022 when the population of New York, New York was 8,008,278 / 8,335,897
Most common industries

Most common industries | Most common industries | |||||
|---|---|---|---|---|---|---|
Industry | All | Males | Females | All | Males | Females |
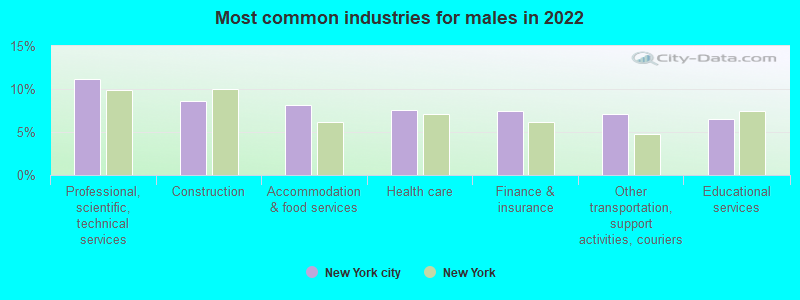
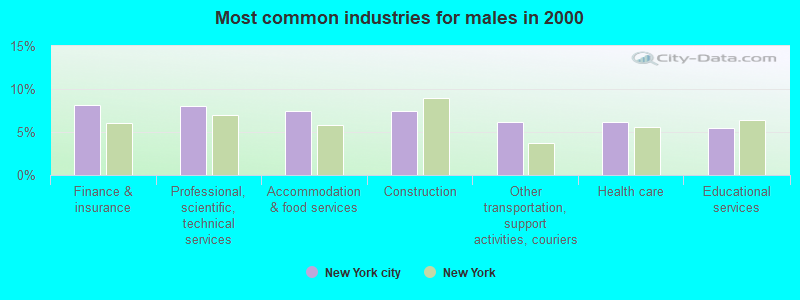
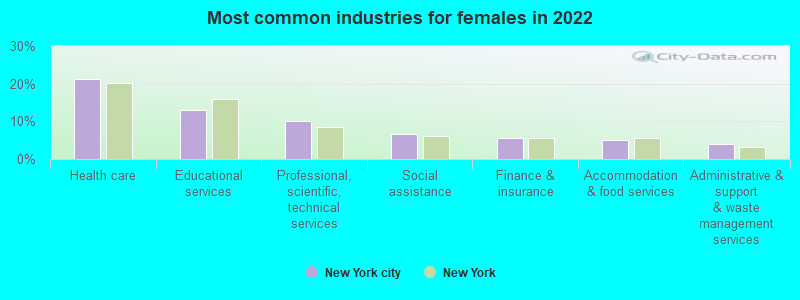
| Health care | 14.2% (573,996) | 7.5% (154,321) | 21.1% (419,675) | 11.9% (391,494) | 6.2% (105,633) | 18.1% (285,861) |
| Professional, scientific, and technical services | 10.7% (431,312) | 11.2% (229,844) | 10.1% (201,468) | 8.3% (271,963) | 8.1% (137,295) | 8.5% (134,668) |
| Educational services | 9.7% (391,919) | 6.5% (133,997) | 13.0% (257,922) | 8.6% (281,074) | 5.4% (92,266) | 12.0% (188,808) |
| Accommodation and food services | 6.6% (266,597) | 8.1% (166,731) | 5.0% (99,866) | 5.9% (192,944) | 7.5% (127,052) | 4.2% (65,892) |
| Finance and insurance | 6.5% (264,650) | 7.4% (152,754) | 5.6% (111,896) | 8.5% (277,110) | 8.2% (139,073) | 8.7% (138,037) |
| Construction | 4.8% (194,970) | 8.7% (177,998) | 0.9% (16,972) | 4.3% (139,385) | 7.4% (126,533) | 0.8% (12,852) |
| Other transportation, and support activities, and couriers | 4.4% (178,990) | 7.1% (146,336) | 1.6% (32,654) | 3.9% (128,846) | 6.2% (105,698) | 1.5% (23,148) |
| Social assistance | 4.2% (169,942) | 1.7% (35,603) | 6.8% (134,339) | 2.8% (93,337) | 0.9% (15,841) | 4.9% (77,496) |
| Administrative and support and waste management services | 4.2% (167,936) | 4.4% (89,871) | 3.9% (78,065) | 3.6% (117,982) | 4.1% (69,034) | 3.1% (48,948) |
| Public administration | 3.9% (156,404) | 4.1% (84,934) | 3.6% (71,470) | 4.5% (146,807) | 4.6% (78,760) | 4.3% (68,047) |
| Arts, entertainment, and recreation | 2.8% (111,507) | 3.1% (63,999) | 2.4% (47,508) | 2.4% (79,266) | 2.6% (43,371) | 2.3% (35,895) |
| Real estate and rental and leasing | 2.7% (108,678) | 3.4% (70,964) | 1.9% (37,714) | 2.9% (95,699) | 3.9% (65,511) | 1.9% (30,188) |
| Food and beverage stores | 2.2% (88,887) | 2.7% (56,227) | 1.6% (32,660) | 2.0% (64,825) | 2.6% (44,162) | 1.3% (20,663) |
| Religious, grantmaking, civic, professional, and similar organizations | 2.0% (82,865) | 1.5% (31,112) | 2.6% (51,753) | 2.0% (65,544) | 1.5% (26,335) | 2.5% (39,209) |
| Publishing, and motion picture and sound recording industries | 2.0% (79,736) | 2.0% (41,082) | 1.9% (38,654) | 2.5% (81,663) | 2.3% (39,867) | 2.6% (41,796) |
| Personal and laundry services | 1.8% (72,695) | 1.4% (28,964) | 2.2% (43,731) | 1.7% (57,270) | 1.6% (27,395) | 1.9% (29,875) |
| Broadcasting and telecommunications | 1.5% (62,217) | 1.8% (37,421) | 1.2% (24,796) | 1.9% (61,347) | 2.1% (34,991) | 1.7% (26,356) |
| Clothing and accessories, including shoe, stores | 1.2% (49,507) | 0.7% (15,382) | 1.7% (34,125) | 1.2% (39,628) | 0.9% (15,846) | 1.5% (23,782) |
| Department and other general merchandise stores | 0.9% (35,913) | 0.7% (14,798) | 1.1% (21,115) | 1.0% (31,509) | 0.7% (12,279) | 1.2% (19,230) |
| Private households | 0.8% (32,022) | 0.1% (1,980) | 1.5% (30,042) | 0.9% (29,227) | 0.1% (1,949) | 1.7% (27,278) |
| Electronic shopping and mail-order houses | 0.7% (29,097) | 0.9% (17,781) | 0.6% (11,316) | 0.2% (7,476) | 0.2% (4,017) | 0.2% (3,459) |
| U. S. Postal service | 0.6% (25,406) | 0.8% (16,390) | 0.5% (9,016) | 0.9% (28,032) | 1.1% (18,482) | 0.6% (9,550) |
| Repair and maintenance | 0.6% (24,546) | 1.0% (21,507) | 0.2% (3,039) | 1.1% (35,294) | 1.9% (31,586) | 0.2% (3,708) |
| Truck transportation | 0.6% (24,500) | 1.1% (22,426) | 0.1% (2,074) | 0.5% (15,143) | 0.8% (13,818) | 0.1% (1,325) |
| Data processing, libraries, and other information services | 0.6% (23,729) | 0.6% (13,152) | 0.5% (10,577) | 0.9% (30,584) | 0.9% (15,980) | 0.9% (14,604) |
| Used merchandise, gift, novelty, and souvenir, and other miscellaneous stores | 0.6% (23,073) | 0.5% (10,592) | 0.6% (12,481) | 0.5% (16,869) | 0.5% (8,336) | 0.5% (8,533) |
| Miscellaneous manufacturing | 0.5% (21,637) | 0.6% (13,316) | 0.4% (8,321) | 1.3% (43,229) | 1.4% (24,570) | 1.2% (18,659) |
| Food | 0.5% (20,951) | 0.6% (12,849) | 0.4% (8,102) | 0.6% (18,494) | 0.8% (13,118) | 0.3% (5,376) |
| Other direct selling establishments | 0.5% (20,933) | 0.5% (10,818) | 0.5% (10,115) | 0.7% (22,205) | 0.7% (12,549) | 0.6% (9,656) |
| Pharmacies and drug stores | 0.5% (18,305) | 0.4% (7,516) | 0.5% (10,789) | 0.5% (15,672) | 0.4% (7,025) | 0.5% (8,647) |
| Air transportation | 0.4% (17,781) | 0.5% (9,958) | 0.4% (7,823) | 0.5% (17,877) | 0.6% (9,872) | 0.5% (8,005) |
| Health and personal care, except drug, stores | 0.4% (16,779) | 0.2% (4,153) | 0.6% (12,626) | 0.2% (8,043) | 0.2% (2,942) | 0.3% (5,101) |
| Groceries and related products merchant wholesalers | 0.4% (16,665) | 0.7% (13,704) | 0.1% (2,961) | 0.5% (17,582) | 0.9% (14,469) | 0.2% (3,113) |
| Chemicals | 0.3% (14,042) | 0.3% (6,095) | 0.4% (7,947) | 0.4% (14,117) | 0.4% (6,981) | 0.5% (7,136) |
| Building material and garden equipment and supplies dealers | 0.3% (13,721) | 0.5% (9,915) | 0.2% (3,806) | 0.3% (11,058) | 0.5% (8,396) | 0.2% (2,662) |
| Utilities | 0.3% (13,301) | 0.5% (9,853) | 0.2% (3,448) | 0.4% (13,228) | 0.6% (10,348) | 0.2% (2,880) |
| Radio, TV, and computer stores | 0.3% (13,299) | 0.3% (6,563) | 0.3% (6,736) | 0.4% (14,529) | 0.6% (10,467) | 0.3% (4,062) |
| Jewelry, luggage, and leather goods stores | 0.3% (13,100) | 0.3% (5,640) | 0.4% (7,460) | 0.3% (9,181) | 0.3% (4,531) | 0.3% (4,650) |
| Furniture and home furnishings, and household appliance stores | 0.3% (13,085) | 0.4% (8,793) | 0.2% (4,292) | 0.4% (12,754) | 0.5% (8,203) | 0.3% (4,551) |
| Warehousing and storage | 0.3% (11,980) | 0.5% (10,100) | 0.1% (1,880) | 0.1% (2,654) | 0.1% (2,071) | 0.0% (583) |
| Motor vehicle and parts dealers | 0.3% (11,671) | 0.4% (9,097) | 0.1% (2,574) | 0.3% (10,977) | 0.5% (9,106) | 0.1% (1,871) |
| Apparel | 0.2% (9,398) | 0.1% (2,899) | 0.3% (6,499) | 1.6% (53,145) | 0.9% (15,293) | 2.4% (37,852) |
| Miscellaneous nondurable goods merchant wholesalers | 0.2% (8,575) | 0.3% (5,510) | 0.2% (3,065) | 0.5% (17,212) | 0.7% (11,544) | 0.4% (5,668) |
| Apparel, fabrics, and notions merchant wholesalers | 0.2% (8,393) | 0.1% (2,856) | 0.3% (5,537) | 0.5% (16,544) | 0.4% (7,297) | 0.6% (9,247) |
| Rail transportation | 0.2% (7,429) | 0.2% (4,513) | 0.1% (2,916) | 0.1% (4,303) | 0.2% (3,467) | 0.1% (836) |
| Printing and related support activities | 0.2% (6,877) | 0.2% (4,559) | 0.1% (2,318) | 0.5% (16,414) | 0.7% (11,795) | 0.3% (4,619) |
| Metal and metal products | 0.2% (6,154) | 0.2% (4,593) | 0.1% (1,561) | 0.3% (10,544) | 0.5% (8,401) | 0.1% (2,143) |
| Beverage and tobacco products | 0.1% (5,567) | 0.1% (2,939) | 0.1% (2,628) | 0.1% (3,348) | 0.1% (2,371) | 0.1% (977) |
| Computer and electronic products | 0.1% (5,491) | 0.2% (4,132) | 0.1% (1,359) | 0.3% (11,340) | 0.4% (7,545) | 0.2% (3,795) |
| Transportation equipment | 0.1% (4,533) | 0.2% (3,662) | 0.0% (871) | 0.1% (3,645) | 0.2% (2,887) | 0.0% (758) |
| Management of companies and enterprises | 0.1% (4,210) | 0.1% (2,659) | 0.1% (1,551) | 0.0% (1,011) | 0.0% (523) | 0.0% (488) |
| Drugs, sundries, and chemical and allied products merchant wholesalers | 0.1% (4,059) | 0.1% (1,965) | 0.1% (2,094) | 0.1% (4,564) | 0.1% (2,278) | 0.1% (2,286) |
| Sporting goods, camera, and hobby and toy stores | 0.1% (3,800) | 0.1% (2,274) | 0.1% (1,526) | 0.2% (6,612) | 0.2% (3,963) | 0.2% (2,649) |
| Miscellaneous durable goods merchant wholesalers | 0.1% (3,741) | 0.1% (1,552) | 0.1% (2,189) | 0.4% (12,553) | 0.4% (6,673) | 0.4% (5,880) |
| Alcoholic beverages merchant wholesalers | 0.1% (3,734) | 0.1% (2,240) | 0.1% (1,494) | 0.1% (2,854) | 0.1% (2,127) | 0.0% (727) |
| Professional and commercial equipment and supplies merchant wholesalers | 0.1% (3,696) | 0.1% (2,753) | 0.0% (943) | 0.2% (7,025) | 0.3% (4,818) | 0.1% (2,207) |
| Book stores and news dealers | 0.1% (3,660) | 0.1% (1,054) | 0.1% (2,606) | 0.2% (5,907) | 0.2% (3,289) | 0.2% (2,618) |
| Machinery | 0.1% (3,479) | 0.1% (2,432) | 0.1% (1,047) | 0.2% (6,581) | 0.3% (5,153) | 0.1% (1,428) |
| Furniture and related product manufacturing | 0.1% (3,404) | 0.1% (3,019) | 0.0% (385) | 0.2% (6,436) | 0.3% (5,304) | 0.1% (1,132) |
| Machinery, equipment, and supplies merchant wholesalers | 0.1% (3,121) | 0.1% (1,767) | 0.1% (1,354) | 0.1% (3,828) | 0.2% (2,570) | 0.1% (1,258) |
| Electrical and electronic goods merchant wholesalers | 0.1% (3,053) | 0.1% (2,537) | 0.0% (516) | 0.1% (4,802) | 0.2% (3,574) | 0.1% (1,228) |
| Gasoline stations | 0.1% (2,668) | 0.1% (2,396) | 0.0% (272) | 0.1% (4,204) | 0.2% (3,588) | 0.0% (616) |
| Textile mills and textile products | 0.1% (2,476) | 0.1% (1,181) | 0.1% (1,295) | 0.3% (10,748) | 0.3% (4,348) | 0.4% (6,400) |
| Electrical equipment, appliances, and components | 0.1% (2,147) | 0.1% (1,164) | 0.0% (983) | 0.1% (3,600) | 0.1% (2,192) | 0.1% (1,408) |
| Plastics and rubber products | 0.0% (1,861) | 0.0% (763) | 0.1% (1,098) | 0.1% (3,709) | 0.1% (2,319) | 0.1% (1,390) |
| Nonmetallic mineral products | 0.0% (1,653) | 0.1% (1,432) | 0.0% (221) | 0.1% (2,821) | 0.1% (2,019) | 0.1% (802) |
| Retail florists | 0.0% (1,527) | 0.0% (704) | 0.0% (823) | 0.1% (3,471) | 0.1% (2,092) | 0.1% (1,379) |
| Office supplies and stationery stores | 0.0% (1,308) | 0.0% (702) | 0.0% (606) | 0.1% (3,752) | 0.1% (2,275) | 0.1% (1,477) |
| Paper | 0.0% (751) | 0.0% (547) | 0.0% (204) | 0.1% (4,799) | 0.2% (3,087) | 0.1% (1,712) |
| Music stores | 0.0% (244) | 0.0% (185) | 0.0% (59) | 0.1% (4,609) | 0.2% (3,281) | 0.1% (1,328) |
Unemployment in New York
- Unemployment by race in 2022
- Unemployment rate for White non-Hispanic residents
- 4.4%Males
- 4.1%Females
- Unemployment rate for Black residents
- 11.2%Males
- 8.9%Females
- Unemployment rate for American Indian and Alaska Native residents
- 8.3%Males
- 9.2%Females
- Unemployment rate for Asian residents
- 5.1%Males
- 4.2%Females
- Unemployment rate for other race residents
- 6.9%Males
- 7.7%Females
- Unemployment rate for two or more race residents
- 6.4%Males
- 7.6%Females
- Unemployment rate for Hispanic or Latino residents
- 6.6%Males
- 8.0%Females
- Unemployment by race in 2000
- Unemployment rate for White non-Hispanic residents
- 5.3%Males
- 5.3%Females
- Unemployment rate for Black residents
- 15.1%Males
- 13.4%Females
- Unemployment rate for American Indian and Alaska Native residents
- 15.6%Males
- 17.7%Females
- Unemployment rate for Asian residents
- 6.0%Males
- 6.9%Females
- Unemployment rate for other race residents
- 12.3%Males
- 17.1%Females
- Unemployment rate for two or more race residents
- 10.2%Males
- 12.4%Females
- Unemployment rate for Hispanic or Latino residents
- 12.1%Males
- 15.7%Females
Unemployment in 2023:
| New York: | 5.1% |
| New York: | 4.4% |
Unemployment in 2022:
| New York: | 5.7% |
| New York: | 4.3% |
Unemployment in 2021:
| New York: | 10.0% |
| New York: | 7.0% |
Unemployment in 2020:
| New York: | 12.2% |
| New York: | 9.8% |
Unemployment in 2019:
| New York: | 3.9% |
| New York: | 3.9% |
Unemployment in 2018:
| New York: | 4.1% |
| New York: | 4.1% |
Unemployment in 2017:
| New York: | 4.5% |
| New York: | 4.6% |
Unemployment in 2016:
| New York: | 5.1% |
| New York: | 4.9% |
Unemployment in 2015:
| New York: | 5.6% |
| New York: | 5.2% |
Unemployment in 2014:
| New York: | 7.1% |
| New York: | 6.3% |
Unemployment in 2013:
| New York: | 8.8% |
| New York: | 7.8% |
Unemployment in 2012:
| New York: | 9.4% |
| New York: | 8.6% |
Unemployment in 2011:
| New York: | 9.1% |
| New York: | 8.3% |
Unemployment in 2010:
| New York: | 9.6% |
| New York: | 8.7% |
Unemployment in 2009:
| New York: | 9.3% |
| New York: | 8.4% |
Unemployment in 2008:
| New York: | 5.6% |
| New York: | 5.4% |
Unemployment in 2007:
| New York: | 4.9% |
| New York: | 4.4% |
Unemployment in 2006:
| New York: | 4.9% |
| New York: | 4.5% |
Unemployment in 2005:
| New York: | 5.7% |
| New York: | 5.0% |
Unemployment in 2004:
| New York: | 7.0% |
| New York: | 5.8% |
Unemployment in 2003:
| New York: | 8.3% |
| New York: | 6.4% |
Unemployment in 2002:
| New York: | 8.0% |
| New York: | 6.2% |
Unemployment in 2001:
| New York: | 6.1% |
| New York: | 4.9% |
Unemployment in 2000:
| New York: | 5.8% |
| New York: | 4.5% |
Unemployment in 1999:
| New York: | 6.8% |
| New York: | 5.2% |
Unemployment in 1998:
| New York: | 7.9% |
| New York: | 5.6% |
Unemployment in 1997:
| New York: | 9.3% |
| New York: | 6.4% |
Unemployment in 1996:
| New York: | 8.8% |
| New York: | 6.2% |
Unemployment in 1995:
| New York: | 8.2% |
| New York: | 6.3% |
Unemployment in 1994:
| New York: | 8.8% |
| New York: | 6.9% |
Unemployment in 1993:
| New York: | 10.4% |
| New York: | 7.9% |
Unemployment in 1992:
| New York: | 11.1% |
| New York: | 8.7% |
Unemployment in 1991:
| New York: | 8.8% |
| New York: | 7.3% |
Unemployment in 1990:
| New York: | 6.8% |
| New York: | 5.3% |
Time leaving home to go to work
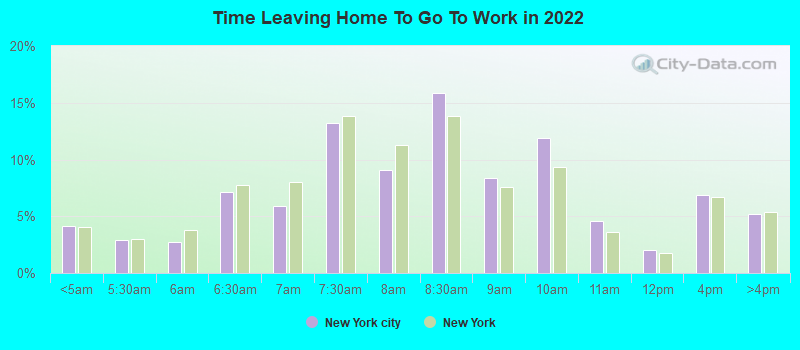
12:00 a.m. to 4:59 a.m.:
| New York: | 4.2% (138,398) |
| New York: | 4.0% (324,269) |
5:00 a.m. to 5:29 a.m.:
| New York: | 2.9% (96,696) |
| New York: | 3.0% (244,203) |
5:30 a.m. to 5:59 a.m.:
| New York: | 2.7% (90,904) |
| New York: | 3.8% (306,441) |
6:00 a.m. to 6:29 a.m.:
| New York: | 7.2% (236,695) |
| New York: | 7.8% (625,523) |
6:30 a.m. to 6:59 a.m.:
| New York: | 5.9% (196,065) |
| New York: | 8.0% (641,168) |
7:00 a.m. to 7:29 a.m.:
| New York: | 13.2% (437,940) |
| New York: | 13.8% (1,113,086) |
7:30 a.m. to 7:59 a.m.:
| New York: | 9.0% (299,420) |
| New York: | 11.3% (908,026) |
8:00 a.m. to 8:29 a.m.:
| New York: | 15.9% (525,606) |
| New York: | 13.8% (1,113,103) |
8:30 a.m. to 8:59 a.m.:
| New York: | 8.4% (277,770) |
| New York: | 7.6% (611,626) |
9:00 a.m. to 9:59 a.m.:
| New York: | 11.9% (395,086) |
| New York: | 9.3% (751,365) |
10:00 a.m. to 10:59 a.m.:
| New York: | 4.6% (150,987) |
| New York: | 3.6% (288,284) |
11:00 a.m. to 11:59 a.m.:
| New York: | 2.0% (66,118) |
| New York: | 1.8% (142,295) |
12:00 p.m. to 3:59 p.m.:
| New York: | 6.8% (226,042) |
| New York: | 6.7% (538,932) |
4:00 p.m. to 11:59 p.m.:
| New York: | 5.2% (172,167) |
| New York: | 5.4% (432,010) |
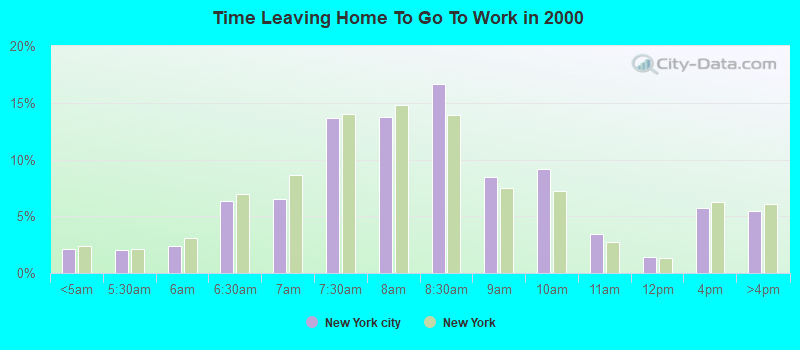
<5am:
| New York: | 2.1% (68,208) |
| New York: | 2.4% (194,562) |
5:30am:
| New York: | 2.0% (64,264) |
| New York: | 2.1% (174,328) |
6am:
| New York: | 2.4% (75,224) |
| New York: | 3.1% (253,826) |
6:30am:
| New York: | 6.3% (202,050) |
| New York: | 7.0% (573,349) |
7am:
| New York: | 6.5% (209,071) |
| New York: | 8.6% (706,982) |
7:30am:
| New York: | 13.7% (436,294) |
| New York: | 14.0% (1,147,579) |
8am:
| New York: | 13.7% (438,505) |
| New York: | 14.8% (1,213,706) |
8:30am:
| New York: | 16.6% (530,791) |
| New York: | 13.9% (1,144,298) |
9am:
| New York: | 8.4% (269,626) |
| New York: | 7.5% (614,475) |
10am:
| New York: | 9.1% (291,983) |
| New York: | 7.2% (593,377) |
11am:
| New York: | 3.4% (109,362) |
| New York: | 2.7% (224,011) |
12pm:
| New York: | 1.4% (45,683) |
| New York: | 1.3% (105,049) |
4pm:
| New York: | 5.8% (183,986) |
| New York: | 6.3% (517,309) |
>4pm:
| New York: | 5.5% (174,872) |
| New York: | 6.1% (501,196) |
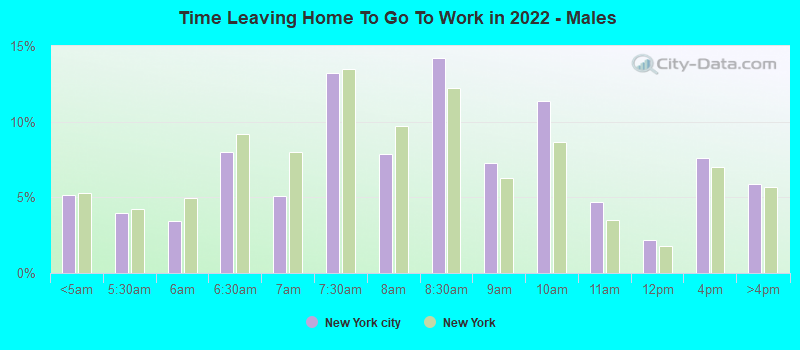
12:00 a.m. to 4:59 a.m. - Males:
| New York: | 5.2% (88,885) |
| New York: | 5.3% (221,747) |
5:00 a.m. to 5:29 a.m. - Males:
| New York: | 4.0% (68,129) |
| New York: | 4.3% (179,128) |
5:30 a.m. to 5:59 a.m. - Males:
| New York: | 3.5% (59,266) |
| New York: | 5.0% (208,932) |
6:00 a.m. to 6:29 a.m. - Males:
| New York: | 8.0% (137,219) |
| New York: | 9.2% (385,998) |
6:30 a.m. to 6:59 a.m. - Males:
| New York: | 5.1% (87,145) |
| New York: | 8.0% (337,755) |
7:00 a.m. to 7:29 a.m. - Males:
| New York: | 13.2% (226,947) |
| New York: | 13.5% (566,438) |
7:30 a.m. to 7:59 a.m. - Males:
| New York: | 7.9% (134,614) |
| New York: | 9.7% (409,686) |
8:00 a.m. to 8:29 a.m. - Males:
| New York: | 14.2% (243,235) |
| New York: | 12.3% (515,665) |
8:30 a.m. to 8:59 a.m. - Males:
| New York: | 7.3% (124,742) |
| New York: | 6.3% (263,407) |
9:00 a.m. to 9:59 a.m. - Males:
| New York: | 11.4% (195,294) |
| New York: | 8.6% (363,060) |
10:00 a.m. to 10:59 a.m. - Males:
| New York: | 4.7% (80,212) |
| New York: | 3.5% (147,669) |
11:00 a.m. to 11:59 a.m. - Males:
| New York: | 2.2% (36,899) |
| New York: | 1.8% (74,935) |
12:00 p.m. to 3:59 p.m. - Males:
| New York: | 7.6% (130,789) |
| New York: | 7.0% (294,293) |
4:00 p.m. to 11:59 p.m. - Males:
| New York: | 5.9% (101,360) |
| New York: | 5.7% (240,166) |
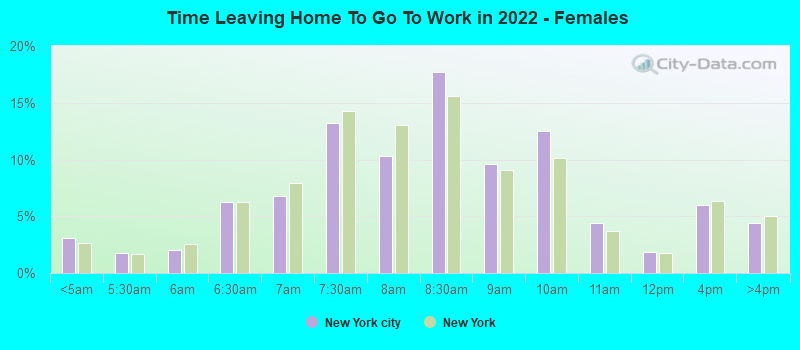
12:00 a.m. to 4:59 a.m. - Females:
| New York: | 3.1% (49,513) |
| New York: | 2.7% (102,522) |
5:00 a.m. to 5:29 a.m. - Females:
| New York: | 1.8% (28,567) |
| New York: | 1.7% (65,075) |
5:30 a.m. to 5:59 a.m. - Females:
| New York: | 2.0% (31,638) |
| New York: | 2.5% (97,509) |
6:00 a.m. to 6:29 a.m. - Females:
| New York: | 6.2% (99,476) |
| New York: | 6.3% (239,525) |
6:30 a.m. to 6:59 a.m. - Females:
| New York: | 6.8% (108,920) |
| New York: | 7.9% (303,413) |
7:00 a.m. to 7:29 a.m. - Females:
| New York: | 13.2% (210,993) |
| New York: | 14.3% (546,648) |
7:30 a.m. to 7:59 a.m. - Females:
| New York: | 10.3% (164,806) |
| New York: | 13.0% (498,340) |
8:00 a.m. to 8:29 a.m. - Females:
| New York: | 17.7% (282,371) |
| New York: | 15.6% (597,438) |
8:30 a.m. to 8:59 a.m. - Females:
| New York: | 9.6% (153,028) |
| New York: | 9.1% (348,219) |
9:00 a.m. to 9:59 a.m. - Females:
| New York: | 12.5% (199,792) |
| New York: | 10.1% (388,305) |
10:00 a.m. to 10:59 a.m. - Females:
| New York: | 4.4% (70,775) |
| New York: | 3.7% (140,615) |
11:00 a.m. to 11:59 a.m. - Females:
| New York: | 1.8% (29,219) |
| New York: | 1.8% (67,360) |
12:00 p.m. to 3:59 p.m. - Females:
| New York: | 6.0% (95,253) |
| New York: | 6.4% (244,639) |
4:00 p.m. to 11:59 p.m. - Females:
| New York: | 4.4% (70,807) |
| New York: | 5.0% (191,844) |
Travel time to work
Percentage of workers working in this county: 62.4%
Number of people working at home: 634,778 (16.1% of all workers)
Daytime population change due to commuting: +563,060 (+7.0%)
Workers who live and work in this city: 2,922,206 (91.5%)
Number of people working at home: 634,778 (16.1% of all workers)
Daytime population change due to commuting: +563,060 (+7.0%)
Workers who live and work in this city: 2,922,206 (91.5%)
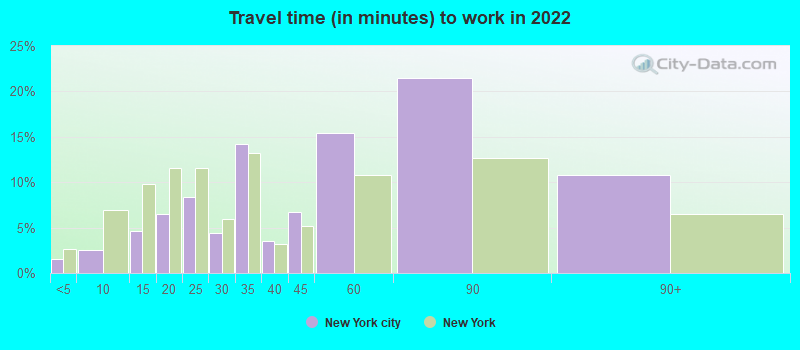
Less than 5 minutes:
| New York: | 1.6% (63,011) |
| New York: | 2.7% (225,210) |
5 to 9 minutes:
| New York: | 2.5% (98,986) |
| New York: | 6.9% (584,338) |
10 to 14 minutes:
| New York: | 4.6% (181,537) |
| New York: | 9.8% (825,925) |
15 to 19 minutes:
| New York: | 6.5% (258,898) |
| New York: | 11.6% (975,938) |
20 to 24 minutes:
| New York: | 8.3% (329,428) |
| New York: | 11.6% (972,845) |
25 to 29 minutes:
| New York: | 4.4% (174,887) |
| New York: | 5.9% (497,572) |
30 to 34 minutes:
| New York: | 14.2% (564,399) |
| New York: | 13.2% (1,107,734) |
35 to 39 minutes:
| New York: | 3.5% (137,997) |
| New York: | 3.2% (267,604) |
40 to 44 minutes:
| New York: | 6.7% (266,262) |
| New York: | 5.2% (435,501) |
45 to 59 minutes:
| New York: | 15.4% (608,771) |
| New York: | 10.8% (904,759) |
60 to 89 minutes:
| New York: | 21.4% (848,866) |
| New York: | 12.7% (1,068,486) |
90 or more minutes:
| New York: | 10.8% (428,457) |
| New York: | 6.4% (542,041) |

Less than 5 minutes:
| New York: | 1.2% (36,907) |
| New York: | 2.7% (219,036) |
5 to 9 minutes:
| New York: | 3.7% (117,493) |
| New York: | 8.3% (680,270) |
10 to 14 minutes:
| New York: | 6.4% (205,727) |
| New York: | 11.6% (956,590) |
15 to 19 minutes:
| New York: | 8.5% (272,534) |
| New York: | 12.4% (1,020,084) |
20 to 24 minutes:
| New York: | 9.9% (316,245) |
| New York: | 12.3% (1,013,757) |
25 to 29 minutes:
| New York: | 3.8% (121,927) |
| New York: | 4.9% (399,384) |
30 to 34 minutes:
| New York: | 16.2% (517,367) |
| New York: | 12.9% (1,058,688) |
35 to 39 minutes:
| New York: | 2.7% (86,101) |
| New York: | 2.5% (203,722) |
40 to 44 minutes:
| New York: | 5.7% (181,563) |
| New York: | 4.1% (340,311) |
45 to 59 minutes:
| New York: | 15.2% (485,781) |
| New York: | 9.8% (806,556) |
60 to 89 minutes:
| New York: | 16.8% (535,411) |
| New York: | 10.3% (848,185) |
90 or more minutes:
| New York: | 7.0% (222,863) |
| New York: | 5.1% (417,464) |
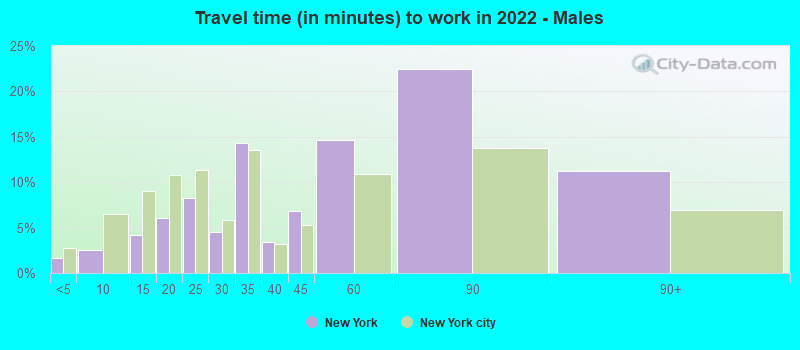
Less than 5 minutes - Males:
| New York: | 1.6% (34,760) |
| New York: | 2.7% (121,454) |
5 to 9 minutes - Males:
| New York: | 2.6% (53,770) |
| New York: | 6.5% (286,493) |
10 to 14 minutes - Males:
| New York: | 4.1% (87,403) |
| New York: | 9.0% (399,036) |
15 to 19 minutes - Males:
| New York: | 6.1% (127,828) |
| New York: | 10.8% (479,544) |
20 to 24 minutes - Males:
| New York: | 8.2% (173,451) |
| New York: | 11.4% (503,832) |
25 to 29 minutes - Males:
| New York: | 4.6% (96,016) |
| New York: | 5.9% (259,244) |
30 to 34 minutes - Males:
| New York: | 14.3% (302,184) |
| New York: | 13.5% (598,211) |
35 to 39 minutes - Males:
| New York: | 3.4% (70,825) |
| New York: | 3.2% (141,729) |
40 to 44 minutes - Males:
| New York: | 6.8% (142,794) |
| New York: | 5.3% (235,705) |
45 to 59 minutes - Males:
| New York: | 14.6% (308,262) |
| New York: | 10.9% (482,109) |
60 to 89 minutes - Males:
| New York: | 22.5% (473,837) |
| New York: | 13.8% (608,656) |
90 or more minutes - Males:
| New York: | 11.2% (236,439) |
| New York: | 7.0% (309,037) |
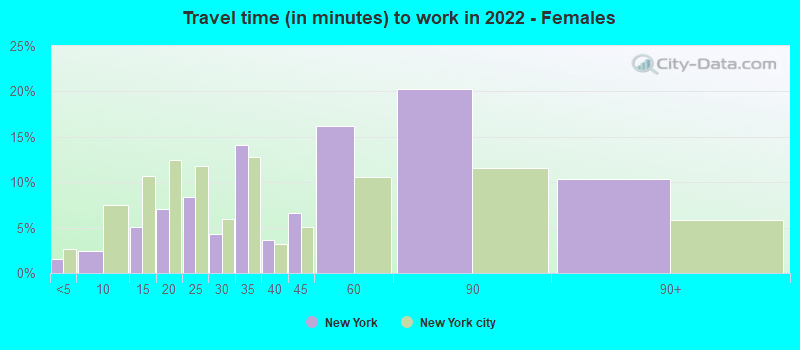
Less than 5 minutes - Females:
| New York: | 1.5% (28,251) |
| New York: | 2.6% (103,756) |
5 to 9 minutes - Females:
| New York: | 2.4% (45,216) |
| New York: | 7.5% (297,845) |
10 to 14 minutes - Females:
| New York: | 5.1% (94,134) |
| New York: | 10.7% (426,889) |
15 to 19 minutes - Females:
| New York: | 7.1% (131,070) |
| New York: | 12.5% (496,394) |
20 to 24 minutes - Females:
| New York: | 8.4% (155,977) |
| New York: | 11.8% (469,013) |
25 to 29 minutes - Females:
| New York: | 4.3% (78,871) |
| New York: | 6.0% (238,328) |
30 to 34 minutes - Females:
| New York: | 14.1% (262,215) |
| New York: | 12.8% (509,523) |
35 to 39 minutes - Females:
| New York: | 3.6% (67,172) |
| New York: | 3.2% (125,875) |
40 to 44 minutes - Females:
| New York: | 6.7% (123,468) |
| New York: | 5.0% (199,796) |
45 to 59 minutes - Females:
| New York: | 16.2% (300,509) |
| New York: | 10.6% (422,650) |
60 to 89 minutes - Females:
| New York: | 20.2% (375,029) |
| New York: | 11.5% (459,830) |
90 or more minutes - Females:
| New York: | 10.4% (192,018) |
| New York: | 5.9% (233,004) |
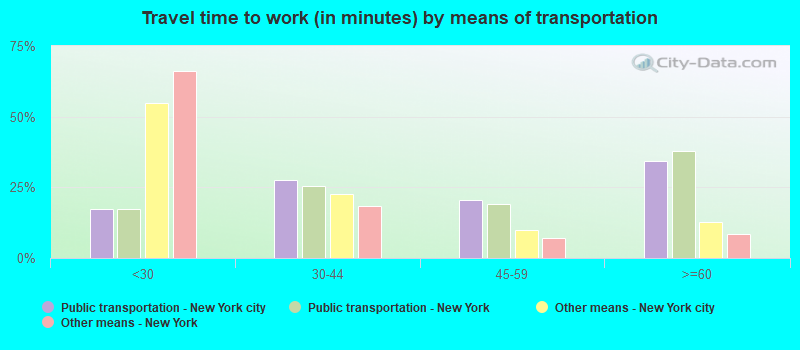
Means of transportation to work
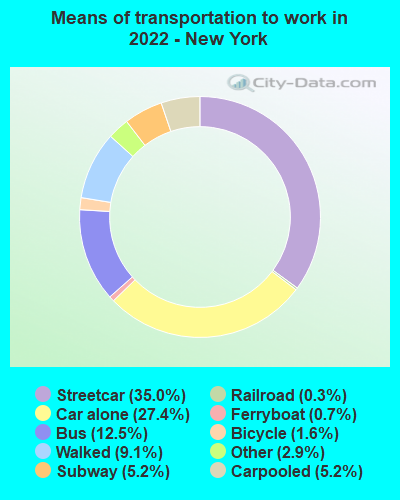
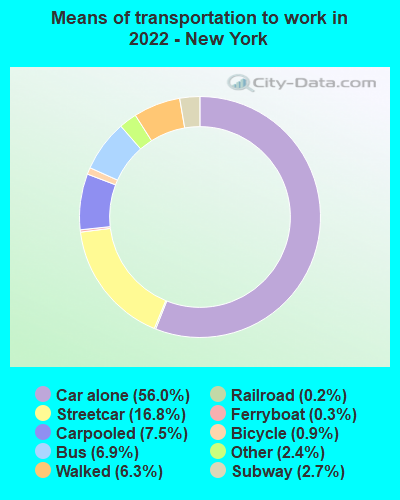
Drove car alone:
| New York: | 27.4% (1,087,340) |
| New York: | 56.0% (2,137,855) |
Carpooled:
| New York: | 5.2% (204,775) |
| New York: | 7.5% (314,148) |
Bus:
| New York: | 12.5% (495,305) |
| New York: | 6.9% (329,762) |
Subway or elevated rail:
| New York: | 35.0% (1,386,616) |
| New York: | 16.8% (698,442) |
Long-distance train or commuter rail:
| New York: | 5.2% (207,776) |
| New York: | 2.7% (90,989) |
Light rail, streetcar or trolley:
| New York: | 0.3% (13,019) |
| New York: | 0.2% (5,871) |
Ferryboat:
| New York: | 0.7% (25,987) |
| New York: | 0.3% (10,620) |
Bicycle:
| New York: | 1.6% (65,171) |
| New York: | 0.9% (21,215) |
Walked:
| New York: | 9.1% (361,350) |
| New York: | 6.3% (272,995) |
Other means:
| New York: | 2.9% (114,160) |
| New York: | 2.4% (101,006) |
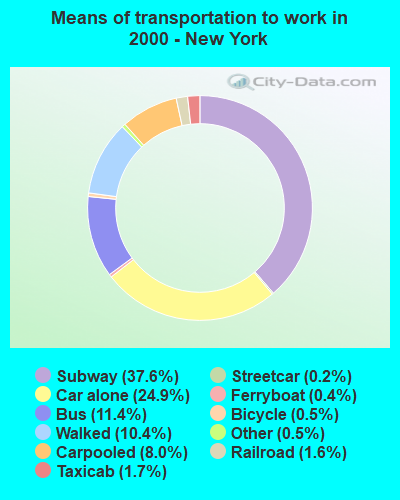

Drove car alone:
| New York: | 24.9% (794,422) |
| New York: | 56.3% (4,620,178) |
Carpooled:
| New York: | 8.0% (254,974) |
| New York: | 9.2% (756,918) |
Bus or trolley bus:
| New York: | 11.4% (364,408) |
| New York: | 5.8% (475,389) |
Streetcar or trolley car:
| New York: | 0.2% (5,101) |
| New York: | 0.1% (6,058) |
Subway or elevated:
| New York: | 37.6% (1,199,226) |
| New York: | 14.8% (1,217,009) |
Railroad:
| New York: | 1.6% (51,141) |
| New York: | 2.8% (228,215) |
Ferryboat:
| New York: | 0.4% (11,193) |
| New York: | 0.1% (11,626) |
Taxicab:
| New York: | 1.7% (53,781) |
| New York: | 0.8% (67,897) |
Motorcycle:
| New York: | 0.0% (1,488) |
| New York: | 0.0% (3,625) |
Bicycle:
| New York: | 0.5% (15,024) |
| New York: | 0.3% (25,036) |
Walked:
| New York: | 10.4% (332,264) |
| New York: | 6.2% (511,721) |
Other means:
| New York: | 0.5% (16,897) |
| New York: | 0.5% (40,375) |
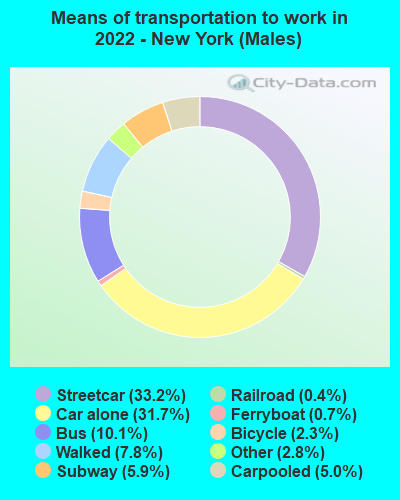
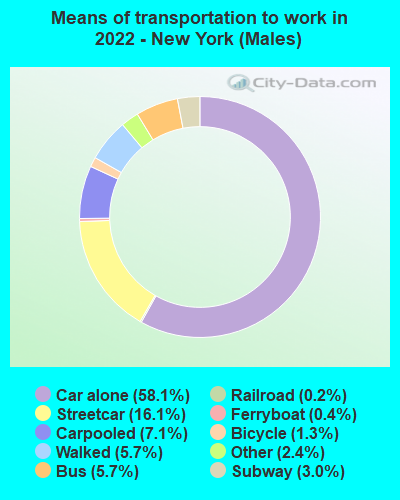
Drove car alone - Males:
| New York: | 31.7% (668,872) |
| New York: | 58.1% (2,137,855) |
Carpooled - Males:
| New York: | 5.0% (104,929) |
| New York: | 7.1% (314,148) |
Bus - Males:
| New York: | 10.1% (213,239) |
| New York: | 5.7% (329,762) |
Subway or elevated rail - Males:
| New York: | 33.2% (700,566) |
| New York: | 16.1% (698,442) |
Long-distance train or commuter rail - Males:
| New York: | 5.9% (125,085) |
| New York: | 3.0% (90,989) |
Light rail, streetcar or trolley - Males:
| New York: | 0.4% (7,423) |
| New York: | 0.2% (5,871) |
Ferryboat - Males:
| New York: | 0.7% (15,517) |
| New York: | 0.4% (10,620) |
Bicycle - Males:
| New York: | 2.3% (47,868) |
| New York: | 1.3% (21,215) |
Walked - Males:
| New York: | 7.8% (165,321) |
| New York: | 5.7% (272,995) |
Other means - Males:
| New York: | 2.8% (58,749) |
| New York: | 2.4% (101,006) |
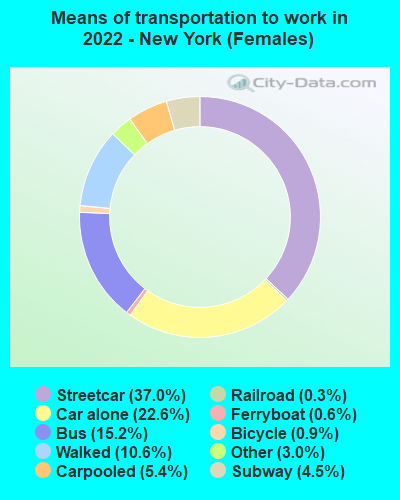
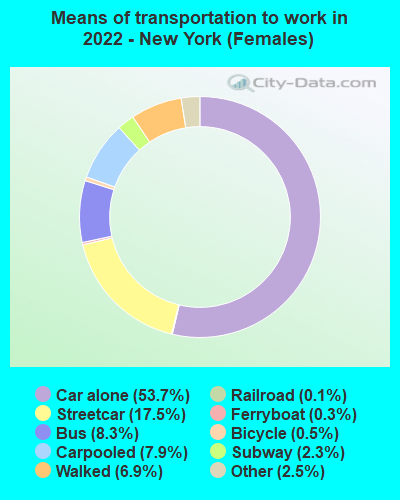
Drove car alone - Females:
| New York: | 22.6% (418,468) |
| New York: | 53.7% (2,137,855) |
Carpooled - Females:
| New York: | 5.4% (99,846) |
| New York: | 7.9% (314,148) |
Bus - Females:
| New York: | 15.2% (282,066) |
| New York: | 8.3% (329,762) |
Subway or elevated rail - Females:
| New York: | 37.0% (686,050) |
| New York: | 17.5% (698,442) |
Long-distance train or commuter rail - Females:
| New York: | 4.5% (82,691) |
| New York: | 2.3% (90,989) |
Light rail, streetcar or trolley - Females:
| New York: | 0.3% (5,596) |
| New York: | 0.1% (5,871) |
Ferryboat - Females:
| New York: | 0.6% (10,470) |
| New York: | 0.3% (10,620) |
Bicycle - Females:
| New York: | 0.9% (17,303) |
| New York: | 0.5% (21,215) |
Walked - Females:
| New York: | 10.6% (196,029) |
| New York: | 6.9% (272,995) |
Other means - Females:
| New York: | 3.0% (55,411) |
| New York: | 2.5% (101,006) |
Private vehicle occupancy
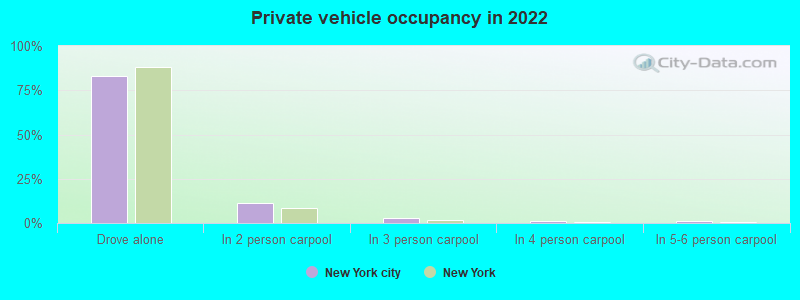
Drove alone:
| New York: | 83.1% (866,429) |
| New York: | 88.3% (4,609,282) |
In 2 person carpool:
| New York: | 11.5% (119,928) |
| New York: | 8.7% (455,269) |
In 3 person carpool:
| New York: | 2.7% (28,592) |
| New York: | 1.6% (86,175) |
In 4 person carpool:
| New York: | 1.2% (12,742) |
| New York: | 0.7% (37,602) |
In 5-6 person carpool:
| New York: | 0.9% (9,348) |
| New York: | 0.4% (21,758) |
In 7+ person carpool:
| New York: | 0.5% (5,425) |
| New York: | 0.2% (12,838) |
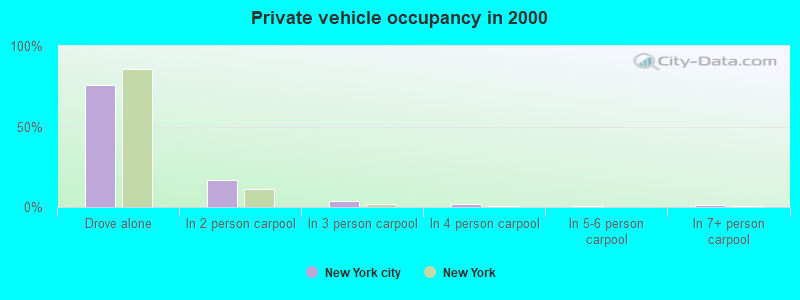
Drove alone:
| New York: | 75.7% (794,422) |
| New York: | 85.9% (4,620,178) |
In 2 person carpool:
| New York: | 16.8% (176,158) |
| New York: | 11.0% (590,255) |
In 3 person carpool:
| New York: | 3.7% (39,089) |
| New York: | 1.8% (96,470) |
In 4 person carpool:
| New York: | 1.6% (16,912) |
| New York: | 0.7% (36,112) |
In 5-6 person carpool:
| New York: | 0.9% (9,455) |
| New York: | 0.3% (16,644) |
In 7+ person carpool:
| New York: | 1.3% (13,360) |
| New York: | 0.3% (17,437) |
Class of workers
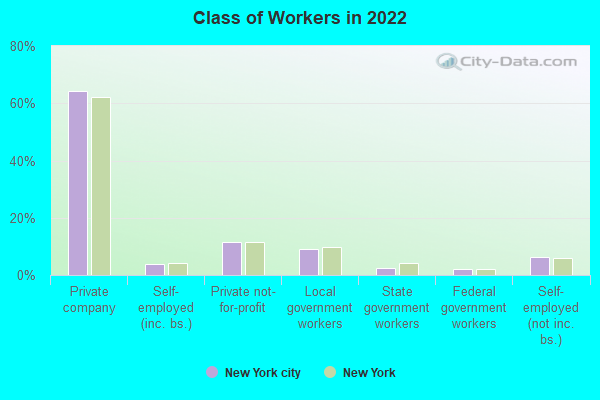
Employee of private company:
| New York: | 64.4% (2,606,890) |
| New York: | 62.2% (5,966,667) |
Self-employed in own incorporated business:
| New York: | 3.9% (157,181) |
| New York: | 4.1% (392,920) |
Private not-for-profit wage and salary workers:
| New York: | 11.5% (465,952) |
| New York: | 11.6% (1,113,247) |
Local government workers:
| New York: | 9.0% (364,762) |
| New York: | 9.9% (953,569) |
State government workers:
| New York: | 2.6% (103,629) |
| New York: | 4.2% (401,705) |
Federal government workers:
| New York: | 2.0% (82,422) |
| New York: | 2.0% (194,327) |
Self-employed workers in own not incorporated business:
| New York: | 6.4% (257,787) |
| New York: | 5.9% (562,168) |
Unpaid family workers:
| New York: | 0.2% (6,668) |
| New York: | 0.2% (15,735) |

Employee of private company:
| New York: | 65.4% (2,143,712) |
| New York: | 63.7% (5,340,134) |
Self-employed in own incorporated business:
| New York: | 3.2% (103,472) |
| New York: | 3.4% (283,619) |
Private not-for-profit wage and salary workers:
| New York: | 9.4% (306,814) |
| New York: | 9.7% (810,356) |
Local government workers:
| New York: | 11.2% (366,415) |
| New York: | 10.2% (858,120) |
State government workers:
| New York: | 2.6% (85,407) |
| New York: | 4.6% (383,673) |
Federal government workers:
| New York: | 2.3% (76,080) |
| New York: | 2.2% (185,100) |
Self-employed workers in own not incorporated business:
| New York: | 5.7% (188,054) |
| New York: | 6.0% (501,068) |
Unpaid family workers:
| New York: | 0.2% (7,871) |
| New York: | 0.2% (20,918) |
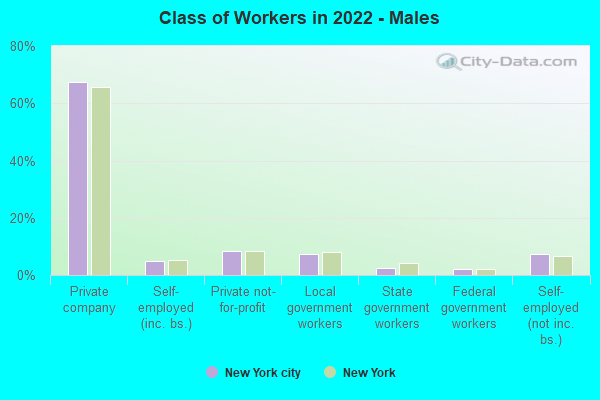
Employee of private company - Males:
| New York: | 67.5% (1,388,353) |
| New York: | 65.7% (3,237,092) |
Self-employed in own incorporated business - Males:
| New York: | 4.9% (100,284) |
| New York: | 5.3% (259,387) |
Private not-for-profit wage and salary workers - Males:
| New York: | 8.5% (173,976) |
| New York: | 8.3% (407,704) |
Local government workers - Males:
| New York: | 7.4% (152,353) |
| New York: | 7.9% (389,927) |
State government workers - Males:
| New York: | 2.5% (50,752) |
| New York: | 4.1% (199,717) |
Federal government workers - Males:
| New York: | 2.0% (40,675) |
| New York: | 2.1% (104,103) |
Self-employed workers in own not incorporated business - Males:
| New York: | 7.2% (147,694) |
| New York: | 6.6% (324,901) |
Unpaid family workers - Males:
| New York: | 0.1% (2,899) |
| New York: | 0.2% (7,572) |
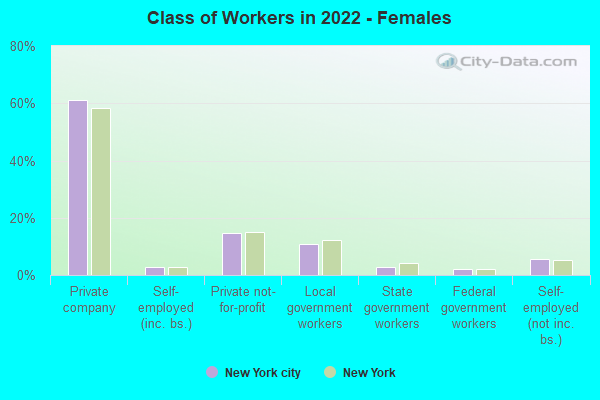
Employee of private company - Females:
| New York: | 61.3% (1,218,537) |
| New York: | 58.4% (2,729,575) |
Self-employed in own incorporated business - Females:
| New York: | 2.9% (56,897) |
| New York: | 2.9% (133,533) |
Private not-for-profit wage and salary workers - Females:
| New York: | 14.7% (291,976) |
| New York: | 15.1% (705,543) |
Local government workers - Females:
| New York: | 10.7% (212,409) |
| New York: | 12.1% (563,642) |
State government workers - Females:
| New York: | 2.7% (52,877) |
| New York: | 4.3% (201,988) |
Federal government workers - Females:
| New York: | 2.1% (41,747) |
| New York: | 1.9% (90,224) |
Self-employed workers in own not incorporated business - Females:
| New York: | 5.5% (110,093) |
| New York: | 5.1% (237,267) |
Unpaid family workers - Females:
| New York: | 0.2% (3,769) |
| New York: | 0.2% (8,163) |