Work and Jobs in North Davis, Utah (UT) Detailed Stats
Occupations, Industries, Unemployment, Workers, Commute
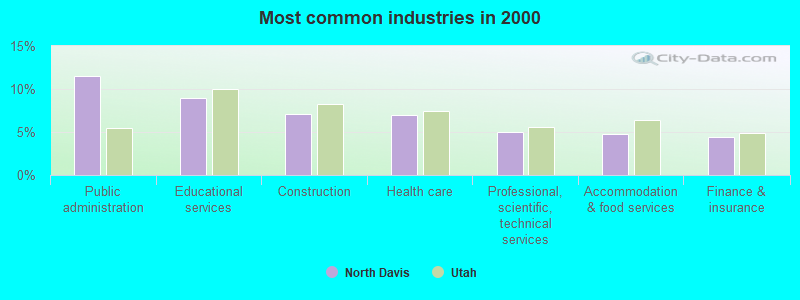
The most common industries in North Davis are: Public administration (11.5% of civilian employees), Educational services (8.9% of civilian employees), Construction (7.1% of civilian employees). 64.8% of workers are employees of private companies, which is 4.9% less than the rate of 68.0% across the entire state of Utah.
Most common industries
Most common industries | |||
|---|---|---|---|
Industry | All | Males | Females |
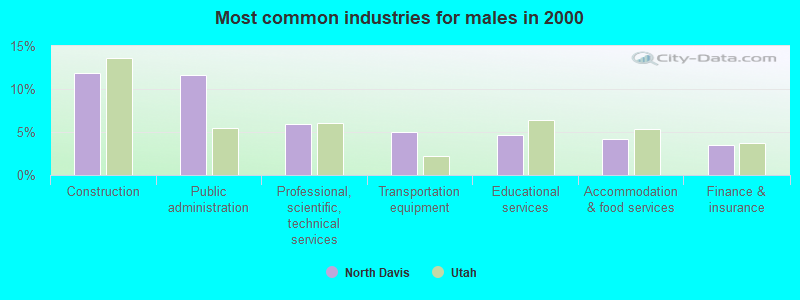
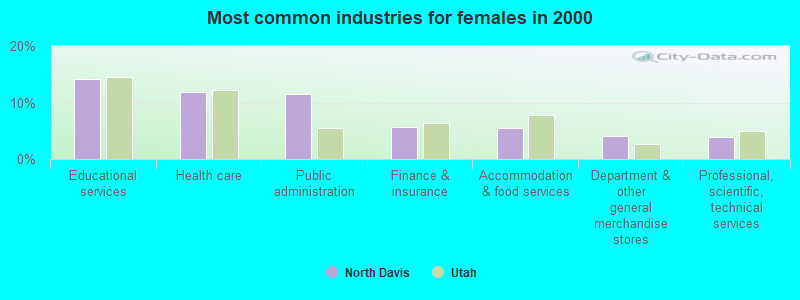
| Public administration | 11.5% (7,907) | 11.6% (4,365) | 11.5% (3,542) |
| Educational services | 8.9% (6,100) | 4.7% (1,754) | 14.1% (4,346) |
| Construction | 7.1% (4,877) | 11.9% (4,467) | 1.3% (410) |
| Health care | 7.0% (4,793) | 3.1% (1,164) | 11.8% (3,629) |
| Professional, scientific, and technical services | 5.0% (3,443) | 5.9% (2,224) | 4.0% (1,219) |
| Accommodation and food services | 4.8% (3,270) | 4.2% (1,567) | 5.5% (1,703) |
| Finance and insurance | 4.5% (3,057) | 3.5% (1,318) | 5.6% (1,739) |
| Food and beverage stores | 3.5% (2,428) | 3.2% (1,218) | 3.9% (1,210) |
| Transportation equipment | 3.4% (2,357) | 4.9% (1,861) | 1.6% (496) |
| Administrative and support and waste management services | 3.2% (2,174) | 3.1% (1,170) | 3.3% (1,004) |
| Department and other general merchandise stores | 2.5% (1,731) | 1.3% (487) | 4.0% (1,244) |
| Social assistance | 1.9% (1,330) | 0.7% (271) | 3.4% (1,059) |
| Real estate and rental and leasing | 1.7% (1,134) | 1.7% (655) | 1.6% (479) |
| Repair and maintenance | 1.6% (1,091) | 2.5% (940) | 0.5% (151) |
| Motor vehicle and parts dealers | 1.6% (1,076) | 2.2% (820) | 0.8% (256) |
| Miscellaneous manufacturing | 1.5% (1,056) | 1.8% (659) | 1.3% (397) |
| Metal and metal products | 1.4% (954) | 2.0% (768) | 0.6% (186) |
| Personal and laundry services | 1.3% (914) | 0.4% (142) | 2.5% (772) |
| Computer and electronic products | 1.3% (901) | 1.7% (654) | 0.8% (247) |
| Arts, entertainment, and recreation | 1.3% (871) | 1.3% (490) | 1.2% (381) |
| Truck transportation | 1.2% (789) | 1.8% (669) | 0.4% (120) |
| Air transportation | 1.1% (761) | 1.1% (406) | 1.2% (355) |
| Religious, grantmaking, civic, professional, and similar organizations | 1.1% (728) | 1.1% (421) | 1.0% (307) |
| Other transportation, and support activities, and couriers | 1.0% (662) | 1.5% (569) | 0.3% (93) |
| Building material and garden equipment and supplies dealers | 1.0% (655) | 1.0% (386) | 0.9% (269) |
| Broadcasting and telecommunications | 0.9% (641) | 1.0% (376) | 0.9% (265) |
| Food | 0.9% (635) | 1.1% (400) | 0.8% (235) |
| Data processing, libraries, and other information services | 0.9% (595) | 0.8% (316) | 0.9% (279) |
| Furniture and home furnishings, and household appliance stores | 0.8% (574) | 0.9% (352) | 0.7% (222) |
| Groceries and related products merchant wholesalers | 0.8% (539) | 1.2% (440) | 0.3% (99) |
| Machinery | 0.7% (475) | 0.8% (300) | 0.6% (175) |
| Other direct selling establishments | 0.7% (460) | 0.4% (169) | 0.9% (291) |
| Publishing, and motion picture and sound recording industries | 0.6% (436) | 0.6% (218) | 0.7% (218) |
| Radio, TV, and computer stores | 0.6% (434) | 0.8% (301) | 0.4% (133) |
| Used merchandise, gift, novelty, and souvenir, and other miscellaneous stores | 0.6% (428) | 0.4% (144) | 0.9% (284) |
| Miscellaneous nondurable goods merchant wholesalers | 0.6% (428) | 0.6% (223) | 0.7% (205) |
| Chemicals | 0.6% (427) | 0.8% (309) | 0.4% (118) |
| U. S. Postal service | 0.6% (412) | 0.8% (295) | 0.4% (117) |
| Agriculture, forestry, fishing and hunting | 0.5% (371) | 0.7% (269) | 0.3% (102) |
| Utilities | 0.5% (365) | 0.8% (315) | 0.2% (50) |
| Furniture and related product manufacturing | 0.5% (333) | 0.6% (226) | 0.3% (107) |
| Clothing and accessories, including shoe, stores | 0.5% (322) | 0.2% (87) | 0.8% (235) |
| Printing and related support activities | 0.5% (315) | 0.4% (152) | 0.5% (163) |
| Sporting goods, camera, and hobby and toy stores | 0.4% (305) | 0.3% (102) | 0.7% (203) |
| Pharmacies and drug stores | 0.4% (293) | 0.4% (159) | 0.4% (134) |
| Paper | 0.4% (270) | 0.6% (222) | 0.2% (48) |
| Machinery, equipment, and supplies merchant wholesalers | 0.4% (261) | 0.6% (228) | 0.1% (33) |
| Health and personal care, except drug, stores | 0.4% (240) | 0.2% (69) | 0.6% (171) |
| Gasoline stations | 0.3% (237) | 0.2% (87) | 0.5% (150) |
| Plastics and rubber products | 0.3% (209) | 0.4% (159) | 0.2% (50) |
| Petroleum and coal products | 0.3% (205) | 0.4% (154) | 0.2% (51) |
| Electronic shopping and mail-order houses | 0.3% (175) | 0.3% (118) | 0.2% (57) |
| Professional and commercial equipment and supplies merchant wholesalers | 0.2% (167) | 0.4% (134) | 0.1% (33) |
| Electrical and electronic goods merchant wholesalers | 0.2% (159) | 0.4% (140) | 0.1% (19) |
| Nonmetallic mineral products | 0.2% (158) | 0.4% (133) | 0.1% (25) |
| Book stores and news dealers | 0.2% (147) | 0.1% (46) | 0.3% (101) |
| Office supplies and stationery stores | 0.2% (146) | 0.3% (102) | 0.1% (44) |
| Motor vehicles, parts and supplies merchant wholesalers | 0.2% (143) | 0.3% (115) | 0.1% (28) |
| Warehousing and storage | 0.2% (141) | 0.3% (108) | 0.1% (33) |
| Miscellaneous durable goods merchant wholesalers | 0.2% (137) | 0.3% (95) | 0.1% (42) |
| Private households | 0.2% (134) | 0.0% (15) | 0.4% (119) |
| Drugs, sundries, and chemical and allied products merchant wholesalers | 0.2% (126) | 0.2% (68) | 0.2% (58) |
| Rail transportation | 0.2% (110) | 0.3% (110) | 0.0% (0) |
| Textile mills and textile products | 0.2% (107) | 0.1% (27) | 0.3% (80) |
| Hardware, plumbing and heating equipment, and supplies merchant wholesalers | 0.2% (107) | 0.2% (90) | 0.1% (17) |
| Lumber and other construction materials merchant wholesalers | 0.1% (100) | 0.2% (90) | 0.0% (10) |
| Mining, quarrying, and oil and gas extraction | 0.1% (99) | 0.3% (99) | 0.0% (0) |
| Wood products | 0.1% (94) | 0.2% (76) | 0.1% (18) |
| Retail florists | 0.1% (90) | 0.1% (23) | 0.2% (67) |
| Jewelry, luggage, and leather goods stores | 0.1% (88) | 0.1% (40) | 0.2% (48) |
| Petroleum and petroleum products merchant wholesalers | 0.1% (86) | 0.2% (86) | 0.0% (0) |
| Sewing, needlework, and piece goods stores | 0.1% (84) | 0.0% (9) | 0.2% (75) |
| Paper and paper products merchant wholesalers | 0.1% (84) | 0.1% (55) | 0.1% (29) |
| Music stores | 0.1% (80) | 0.1% (41) | 0.1% (39) |
| Alcoholic beverages merchant wholesalers | 0.1% (62) | 0.2% (62) | 0.0% (0) |
| Metals and minerals, except petroleum, merchant wholesalers | 0.1% (60) | 0.2% (60) | 0.0% (0) |
| Beverage and tobacco products | 0.1% (56) | 0.1% (46) | 0.0% (10) |
| Electrical equipment, appliances, and components | 0.1% (46) | 0.1% (41) | 0.0% (5) |
Unemployment in North Davis
- Unemployment by race in 2000
- Unemployment rate for White non-Hispanic residents
- 3.9%Males
- 5.2%Females
- Unemployment rate for Black residents
- 19.8%Males
- 13.8%Females
- Unemployment rate for American Indian and Alaska Native residents
- 14.6%Males
- 17.0%Females
- Unemployment rate for Asian residents
- 11.1%Males
- 7.0%Females
- Unemployment rate for other race residents
- 4.2%Males
- 6.8%Females
- Unemployment rate for two or more race residents
- 3.6%Males
- 12.7%Females
- Unemployment rate for Hispanic or Latino residents
- 7.5%Males
- 7.1%Females
Time leaving home to go to work

<5am:
| North Davis: | 3.6% (2,554) |
| Utah: | 3.4% (34,668) |
5:30am:
| North Davis: | 3.5% (2,445) |
| Utah: | 2.6% (27,208) |
6am:
| North Davis: | 7.6% (5,352) |
| Utah: | 4.9% (50,890) |
6:30am:
| North Davis: | 9.6% (6,793) |
| Utah: | 6.9% (71,407) |
7am:
| North Davis: | 11.8% (8,353) |
| Utah: | 9.6% (99,512) |
7:30am:
| North Davis: | 11.7% (8,241) |
| Utah: | 12.2% (126,423) |
8am:
| North Davis: | 11.0% (7,772) |
| Utah: | 14.5% (149,517) |
8:30am:
| North Davis: | 8.8% (6,242) |
| Utah: | 10.4% (107,893) |
9am:
| North Davis: | 5.0% (3,524) |
| Utah: | 5.7% (59,261) |
10am:
| North Davis: | 4.4% (3,132) |
| Utah: | 5.8% (59,537) |
11am:
| North Davis: | 1.8% (1,285) |
| Utah: | 2.6% (26,709) |
12pm:
| North Davis: | 1.4% (1,010) |
| Utah: | 1.4% (14,712) |
4pm:
| North Davis: | 8.5% (6,010) |
| Utah: | 8.5% (87,296) |
>4pm:
| North Davis: | 7.5% (5,324) |
| Utah: | 7.2% (74,490) |
Travel time to work


Less than 5 minutes:
| North Davis: | 3.6% (2,529) |
| Utah: | 4.2% (43,896) |
5 to 9 minutes:
| North Davis: | 13.4% (9,490) |
| Utah: | 13.9% (143,317) |
10 to 14 minutes:
| North Davis: | 17.4% (12,311) |
| Utah: | 16.9% (175,060) |
15 to 19 minutes:
| North Davis: | 17.1% (12,113) |
| Utah: | 16.8% (173,076) |
20 to 24 minutes:
| North Davis: | 12.4% (8,762) |
| Utah: | 14.6% (151,080) |
25 to 29 minutes:
| North Davis: | 4.5% (3,161) |
| Utah: | 5.3% (54,800) |
30 to 34 minutes:
| North Davis: | 8.3% (5,898) |
| Utah: | 10.8% (111,752) |
35 to 39 minutes:
| North Davis: | 2.3% (1,656) |
| Utah: | 1.8% (18,540) |
40 to 44 minutes:
| North Davis: | 3.1% (2,196) |
| Utah: | 2.3% (23,425) |
45 to 59 minutes:
| North Davis: | 7.7% (5,447) |
| Utah: | 4.6% (47,093) |
60 to 89 minutes:
| North Davis: | 4.9% (3,428) |
| Utah: | 3.0% (30,830) |
90 or more minutes:
| North Davis: | 1.5% (1,046) |
| Utah: | 1.6% (16,654) |
Means of transportation to work

Drove car alone:
| North Davis: | 78.3% (55,331) |
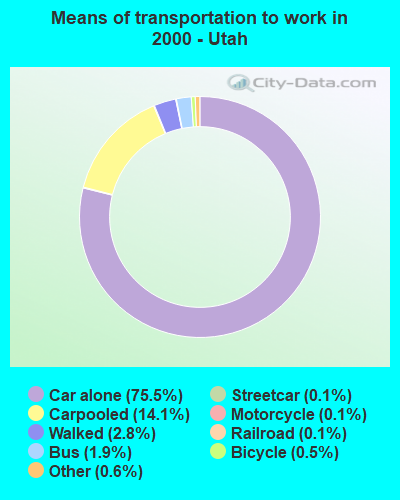
| Utah: | 75.5% (779,438) |
Carpooled:
| North Davis: | 13.8% (9,772) |
| Utah: | 14.1% (145,950) |
Bus or trolley bus:
| North Davis: | 1.8% (1,267) |
| Utah: | 1.9% (19,910) |
Streetcar or trolley car:
| North Davis: | 0.0% (14) |
| Utah: | 0.1% (1,077) |
Ferryboat:
| North Davis: | 0.1% (49) |
| Utah: | 0.0% (102) |
Taxicab:
| North Davis: | 0.0% (16) |
| Utah: | 0.0% (159) |
Motorcycle:
| North Davis: | 0.1% (97) |
| Utah: | 0.1% (1,284) |
Bicycle:
| North Davis: | 0.3% (207) |
| Utah: | 0.5% (5,267) |
Walked:
| North Davis: | 1.4% (955) |
| Utah: | 2.8% (28,523) |
Other means:
| North Davis: | 0.5% (329) |
| Utah: | 0.6% (5,862) |
Private vehicle occupancy

Drove alone:
| North Davis: | 85.0% (55,331) |
| Utah: | 84.2% (779,438) |
In 2 person carpool:
| North Davis: | 12.1% (7,882) |
| Utah: | 12.2% (112,575) |
In 3 person carpool:
| North Davis: | 2.1% (1,350) |
| Utah: | 2.2% (19,966) |
In 4 person carpool:
| North Davis: | 0.4% (266) |
| Utah: | 0.8% (7,439) |
In 5-6 person carpool:
| North Davis: | 0.3% (189) |
| Utah: | 0.4% (3,682) |
In 7+ person carpool:
| North Davis: | 0.1% (85) |
| Utah: | 0.2% (2,288) |
Class of workers
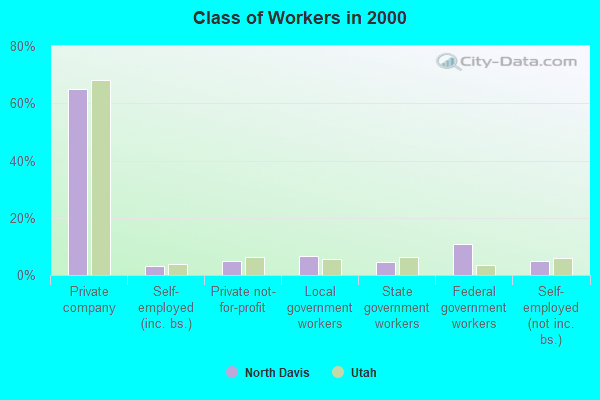
Employee of private company:
| North Davis: | 64.8% (44,385) |
| Utah: | 68.0% (709,966) |
Self-employed in own incorporated business:
| North Davis: | 3.0% (2,080) |
| Utah: | 3.9% (40,428) |
Private not-for-profit wage and salary workers:
| North Davis: | 4.8% (3,290) |
| Utah: | 6.3% (66,081) |
Local government workers:
| North Davis: | 6.7% (4,588) |
| Utah: | 5.7% (59,805) |
State government workers:
| North Davis: | 4.5% (3,070) |
| Utah: | 6.4% (66,879) |
Federal government workers:
| North Davis: | 11.0% (7,523) |
| Utah: | 3.6% (37,312) |
Self-employed workers in own not incorporated business:
| North Davis: | 4.9% (3,341) |
| Utah: | 5.8% (60,621) |
Unpaid family workers:
| North Davis: | 0.3% (207) |
| Utah: | 0.3% (3,270) |

Employee of private company - Males:
| North Davis: | 68.2% (25,682) |
| Utah: | 70.8% (409,495) |
Self-employed in own incorporated business - Males:
| North Davis: | 4.2% (1,577) |
| Utah: | 5.4% (31,105) |
Private not-for-profit wage and salary workers - Males:
| North Davis: | 3.4% (1,293) |
| Utah: | 4.7% (26,927) |
Local government workers - Males:
| North Davis: | 4.6% (1,750) |
| Utah: | 4.6% (26,323) |
State government workers - Males:
| North Davis: | 3.6% (1,355) |
| Utah: | 5.0% (28,909) |
Federal government workers - Males:
| North Davis: | 11.4% (4,297) |
| Utah: | 3.6% (20,562) |
Self-employed workers in own not incorporated business - Males:
| North Davis: | 4.4% (1,641) |
| Utah: | 5.8% (33,789) |
Unpaid family workers - Males:
| North Davis: | 0.2% (60) |
| Utah: | 0.2% (1,359) |

Employee of private company - Females:
| North Davis: | 60.7% (18,703) |
| Utah: | 64.5% (300,471) |
Self-employed in own incorporated business - Females:
| North Davis: | 1.6% (503) |
| Utah: | 2.0% (9,323) |
Private not-for-profit wage and salary workers - Females:
| North Davis: | 6.5% (1,997) |
| Utah: | 8.4% (39,154) |
Local government workers - Females:
| North Davis: | 9.2% (2,838) |
| Utah: | 7.2% (33,482) |
State government workers - Females:
| North Davis: | 5.6% (1,715) |
| Utah: | 8.1% (37,970) |
Federal government workers - Females:
| North Davis: | 10.5% (3,226) |
| Utah: | 3.6% (16,750) |
Self-employed workers in own not incorporated business - Females:
| North Davis: | 5.5% (1,700) |
| Utah: | 5.8% (26,832) |
Unpaid family workers - Females:
| North Davis: | 0.5% (147) |
| Utah: | 0.4% (1,911) |