Work and Jobs in North Hempstead, New York (NY) Detailed Stats
Occupations, Industries, Unemployment, Workers, Commute
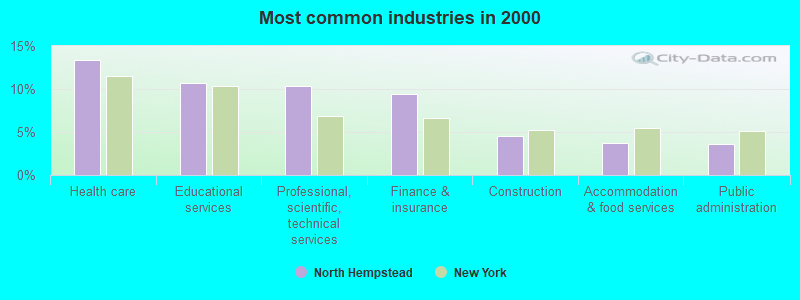
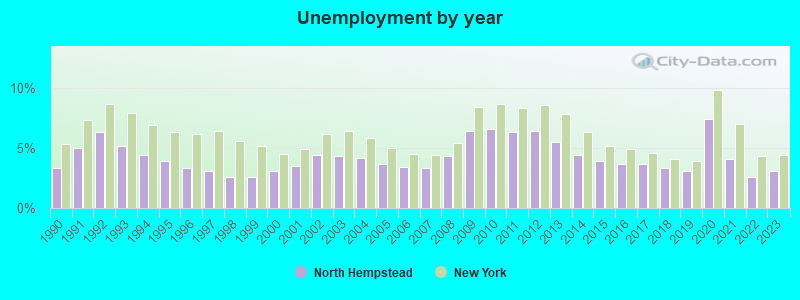
The unemployment rate in 2023 in North Hempstead, NY was 3.1%, which was 41.9% less than the unemployment rate of 4.4% across the entire state of New York. Compared to the unemployment rate of 5.5% in 2013, this represents a decrease of 77.4%. The most common industries in North Hempstead are: Health care (13.3% of civilian employees), Educational services (10.7% of civilian employees), Professional, scientific, technical services (10.4% of civilian employees). 60.5% of workers are employees of private companies, which is 5.3% less than the rate of 63.7% across the entire state of New York.
Most common industries
Most common industries | |||
|---|---|---|---|
Industry | All | Males | Females |
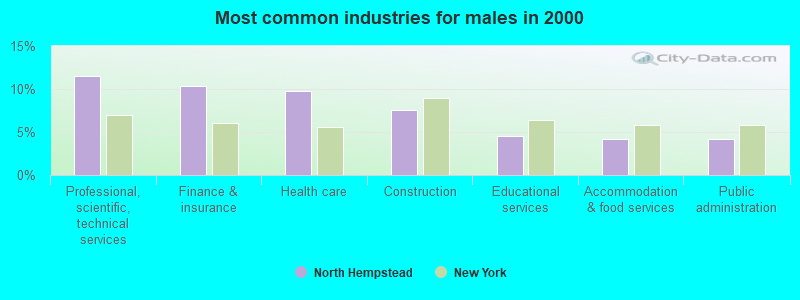
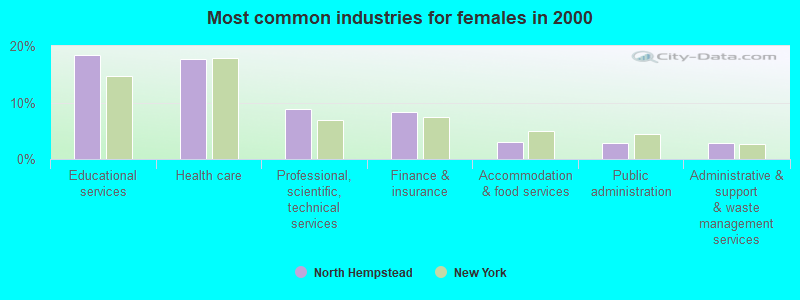
| Health care | 13.3% (13,942) | 9.8% (5,633) | 17.6% (8,309) |
| Educational services | 10.7% (11,232) | 4.5% (2,597) | 18.3% (8,635) |
| Professional, scientific, and technical services | 10.4% (10,838) | 11.5% (6,633) | 8.9% (4,205) |
| Finance and insurance | 9.4% (9,880) | 10.4% (5,949) | 8.3% (3,931) |
| Construction | 4.5% (4,685) | 7.5% (4,328) | 0.8% (357) |
| Accommodation and food services | 3.7% (3,874) | 4.2% (2,438) | 3.0% (1,436) |
| Public administration | 3.6% (3,744) | 4.2% (2,387) | 2.9% (1,357) |
| Administrative and support and waste management services | 3.3% (3,430) | 3.7% (2,098) | 2.8% (1,332) |
| Real estate and rental and leasing | 2.9% (3,030) | 3.1% (1,778) | 2.7% (1,252) |
| Other transportation, and support activities, and couriers | 1.9% (1,945) | 2.6% (1,485) | 1.0% (460) |
| Arts, entertainment, and recreation | 1.8% (1,893) | 1.9% (1,105) | 1.7% (788) |
| Publishing, and motion picture and sound recording industries | 1.7% (1,778) | 1.5% (890) | 1.9% (888) |
| Food and beverage stores | 1.6% (1,678) | 1.8% (1,048) | 1.3% (630) |
| Miscellaneous manufacturing | 1.5% (1,557) | 1.8% (1,029) | 1.1% (528) |
| Religious, grantmaking, civic, professional, and similar organizations | 1.5% (1,530) | 1.2% (711) | 1.7% (819) |
| Broadcasting and telecommunications | 1.3% (1,333) | 1.6% (895) | 0.9% (438) |
| Personal and laundry services | 1.3% (1,319) | 0.9% (534) | 1.7% (785) |
| Clothing and accessories, including shoe, stores | 1.2% (1,306) | 0.8% (488) | 1.7% (818) |
| Social assistance | 1.2% (1,212) | 0.3% (145) | 2.3% (1,067) |
| Private households | 1.1% (1,144) | 0.2% (112) | 2.2% (1,032) |
| Department and other general merchandise stores | 0.9% (978) | 0.6% (355) | 1.3% (623) |
| Repair and maintenance | 0.8% (876) | 1.4% (780) | 0.2% (96) |
| Computer and electronic products | 0.8% (859) | 1.1% (626) | 0.5% (233) |
| Apparel | 0.8% (856) | 0.6% (373) | 1.0% (483) |
| Miscellaneous durable goods merchant wholesalers | 0.8% (837) | 1.0% (563) | 0.6% (274) |
| Apparel, fabrics, and notions merchant wholesalers | 0.8% (797) | 1.0% (552) | 0.5% (245) |
| Data processing, libraries, and other information services | 0.8% (796) | 0.6% (327) | 1.0% (469) |
| U. S. Postal service | 0.7% (767) | 1.0% (570) | 0.4% (197) |
| Other direct selling establishments | 0.7% (763) | 0.8% (441) | 0.7% (322) |
| Pharmacies and drug stores | 0.7% (747) | 0.6% (350) | 0.8% (397) |
| Air transportation | 0.7% (742) | 0.7% (404) | 0.7% (338) |
| Miscellaneous nondurable goods merchant wholesalers | 0.7% (729) | 0.9% (503) | 0.5% (226) |
| Motor vehicle and parts dealers | 0.7% (713) | 0.9% (543) | 0.4% (170) |
| Used merchandise, gift, novelty, and souvenir, and other miscellaneous stores | 0.6% (671) | 0.6% (348) | 0.7% (323) |
| Metal and metal products | 0.6% (617) | 0.8% (470) | 0.3% (147) |
| Furniture and home furnishings, and household appliance stores | 0.6% (593) | 0.6% (344) | 0.5% (249) |
| Printing and related support activities | 0.5% (573) | 0.7% (398) | 0.4% (175) |
| Chemicals | 0.5% (539) | 0.5% (284) | 0.5% (255) |
| Radio, TV, and computer stores | 0.5% (533) | 0.6% (360) | 0.4% (173) |
| Building material and garden equipment and supplies dealers | 0.5% (503) | 0.7% (376) | 0.3% (127) |
| Utilities | 0.5% (486) | 0.7% (402) | 0.2% (84) |
| Professional and commercial equipment and supplies merchant wholesalers | 0.5% (484) | 0.6% (357) | 0.3% (127) |
| Groceries and related products merchant wholesalers | 0.5% (481) | 0.8% (439) | 0.1% (42) |
| Jewelry, luggage, and leather goods stores | 0.4% (468) | 0.4% (249) | 0.5% (219) |
| Food | 0.4% (464) | 0.5% (312) | 0.3% (152) |
| Textile mills and textile products | 0.3% (365) | 0.4% (243) | 0.3% (122) |
| Electronic shopping and mail-order houses | 0.3% (334) | 0.4% (207) | 0.3% (127) |
| Machinery | 0.3% (328) | 0.5% (280) | 0.1% (48) |
| Sporting goods, camera, and hobby and toy stores | 0.3% (326) | 0.4% (209) | 0.2% (117) |
| Electrical and electronic goods merchant wholesalers | 0.3% (319) | 0.4% (237) | 0.2% (82) |
| Machinery, equipment, and supplies merchant wholesalers | 0.3% (302) | 0.4% (227) | 0.2% (75) |
| Health and personal care, except drug, stores | 0.3% (302) | 0.2% (105) | 0.4% (197) |
| Drugs, sundries, and chemical and allied products merchant wholesalers | 0.3% (268) | 0.3% (159) | 0.2% (109) |
| Furniture and home furnishing merchant wholesalers | 0.2% (260) | 0.3% (196) | 0.1% (64) |
| Truck transportation | 0.2% (249) | 0.4% (231) | 0.0% (18) |
| Transportation equipment | 0.2% (236) | 0.4% (216) | 0.0% (20) |
| Office supplies and stationery stores | 0.2% (235) | 0.3% (185) | 0.1% (50) |
| Book stores and news dealers | 0.2% (210) | 0.2% (95) | 0.2% (115) |
| Rail transportation | 0.2% (200) | 0.3% (176) | 0.1% (24) |
| Motor vehicles, parts and supplies merchant wholesalers | 0.2% (187) | 0.3% (150) | 0.1% (37) |
| Retail florists | 0.2% (176) | 0.1% (65) | 0.2% (111) |
| Music stores | 0.2% (172) | 0.2% (100) | 0.2% (72) |
| Nonmetallic mineral products | 0.1% (156) | 0.2% (110) | 0.1% (46) |
| Plastics and rubber products | 0.1% (156) | 0.2% (101) | 0.1% (55) |
| Electrical equipment, appliances, and components | 0.1% (144) | 0.1% (78) | 0.1% (66) |
| Furniture and related product manufacturing | 0.1% (140) | 0.2% (122) | 0.0% (18) |
| Gasoline stations | 0.1% (124) | 0.2% (102) | 0.0% (22) |
| Hardware, plumbing and heating equipment, and supplies merchant wholesalers | 0.1% (118) | 0.1% (76) | 0.1% (42) |
| Paper and paper products merchant wholesalers | 0.1% (117) | 0.2% (104) | 0.0% (13) |
| Beverage and tobacco products | 0.1% (94) | 0.1% (79) | 0.0% (15) |
| Alcoholic beverages merchant wholesalers | 0.1% (87) | 0.1% (59) | 0.1% (28) |
| Fuel dealers | 0.1% (68) | 0.1% (63) | 0.0% (5) |
| Recyclable material merchant wholesalers | 0.1% (68) | 0.1% (61) | 0.0% (7) |
Unemployment in North Hempstead
- Unemployment by race in 2000
- Unemployment rate for White non-Hispanic residents
- 3.1%Males
- 2.9%Females
- Unemployment rate for Black residents
- 10.2%Males
- 7.7%Females
- Unemployment rate for American Indian and Alaska Native residents
- 16.5%Females
- Unemployment rate for Asian residents
- 3.6%Males
- 2.7%Females
- Unemployment rate for other race residents
- 4.9%Males
- 9.7%Females
- Unemployment rate for two or more race residents
- 7.4%Males
- 6.0%Females
- Unemployment rate for Hispanic or Latino residents
- 4.1%Males
- 6.7%Females
Unemployment in 2023:
| North Hempstead: | 3.1% |
| New York: | 4.4% |
Unemployment in 2022:
| North Hempstead: | 2.6% |
| New York: | 4.3% |
Unemployment in 2021:
| North Hempstead: | 4.1% |
| New York: | 7.0% |
Unemployment in 2020:
| North Hempstead: | 7.4% |
| New York: | 9.8% |
Unemployment in 2019:
| North Hempstead: | 3.1% |
| New York: | 3.9% |
Unemployment in 2018:
| North Hempstead: | 3.3% |
| New York: | 4.1% |
Unemployment in 2017:
| North Hempstead: | 3.7% |
| New York: | 4.6% |
Unemployment in 2016:
| North Hempstead: | 3.7% |
| New York: | 4.9% |
Unemployment in 2015:
| North Hempstead: | 3.9% |
| New York: | 5.2% |
Unemployment in 2014:
| North Hempstead: | 4.4% |
| New York: | 6.3% |
Unemployment in 2013:
| North Hempstead: | 5.5% |
| New York: | 7.8% |
Unemployment in 2012:
| North Hempstead: | 6.4% |
| New York: | 8.6% |
Unemployment in 2011:
| North Hempstead: | 6.3% |
| New York: | 8.3% |
Unemployment in 2010:
| North Hempstead: | 6.6% |
| New York: | 8.7% |
Unemployment in 2009:
| North Hempstead: | 6.4% |
| New York: | 8.4% |
Unemployment in 2008:
| North Hempstead: | 4.3% |
| New York: | 5.4% |
Unemployment in 2007:
| North Hempstead: | 3.3% |
| New York: | 4.4% |
Unemployment in 2006:
| North Hempstead: | 3.4% |
| New York: | 4.5% |
Unemployment in 2005:
| North Hempstead: | 3.7% |
| New York: | 5.0% |
Unemployment in 2004:
| North Hempstead: | 4.2% |
| New York: | 5.8% |
Unemployment in 2003:
| North Hempstead: | 4.3% |
| New York: | 6.4% |
Unemployment in 2002:
| North Hempstead: | 4.4% |
| New York: | 6.2% |
Unemployment in 2001:
| North Hempstead: | 3.5% |
| New York: | 4.9% |
Unemployment in 2000:
| North Hempstead: | 3.1% |
| New York: | 4.5% |
Unemployment in 1999:
| North Hempstead: | 2.6% |
| New York: | 5.2% |
Unemployment in 1998:
| North Hempstead: | 2.6% |
| New York: | 5.6% |
Unemployment in 1997:
| North Hempstead: | 3.1% |
| New York: | 6.4% |
Unemployment in 1996:
| North Hempstead: | 3.3% |
| New York: | 6.2% |
Unemployment in 1995:
| North Hempstead: | 3.9% |
| New York: | 6.3% |
Unemployment in 1994:
| North Hempstead: | 4.4% |
| New York: | 6.9% |
Unemployment in 1993:
| North Hempstead: | 5.2% |
| New York: | 7.9% |
Unemployment in 1992:
| North Hempstead: | 6.3% |
| New York: | 8.7% |
Unemployment in 1991:
| North Hempstead: | 5.0% |
| New York: | 7.3% |
Unemployment in 1990:
| North Hempstead: | 3.3% |
| New York: | 5.3% |
Time leaving home to go to work

<5am:
| North Hempstead: | 1.6% (1,606) |
| New York: | 2.4% (194,562) |
5:30am:
| North Hempstead: | 1.3% (1,356) |
| New York: | 2.1% (174,328) |
6am:
| North Hempstead: | 1.8% (1,798) |
| New York: | 3.1% (253,826) |
6:30am:
| North Hempstead: | 5.7% (5,894) |
| New York: | 7.0% (573,349) |
7am:
| North Hempstead: | 7.9% (8,075) |
| New York: | 8.6% (706,982) |
7:30am:
| North Hempstead: | 15.1% (15,506) |
| New York: | 14.0% (1,147,579) |
8am:
| North Hempstead: | 15.0% (15,329) |
| New York: | 14.8% (1,213,706) |
8:30am:
| North Hempstead: | 15.3% (15,733) |
| New York: | 13.9% (1,144,298) |
9am:
| North Hempstead: | 9.6% (9,856) |
| New York: | 7.5% (614,475) |
10am:
| North Hempstead: | 9.8% (10,055) |
| New York: | 7.2% (593,377) |
11am:
| North Hempstead: | 3.6% (3,643) |
| New York: | 2.7% (224,011) |
12pm:
| North Hempstead: | 1.5% (1,548) |
| New York: | 1.3% (105,049) |
4pm:
| North Hempstead: | 3.9% (3,969) |
| New York: | 6.3% (517,309) |
>4pm:
| North Hempstead: | 4.0% (4,120) |
| New York: | 6.1% (501,196) |
Travel time to work


Less than 5 minutes:
| North Hempstead: | 1.9% (1,931) |
| New York: | 2.7% (219,036) |
5 to 9 minutes:
| North Hempstead: | 8.5% (8,681) |
| New York: | 8.3% (680,270) |
10 to 14 minutes:
| North Hempstead: | 11.4% (11,647) |
| New York: | 11.6% (956,590) |
15 to 19 minutes:
| North Hempstead: | 11.4% (11,692) |
| New York: | 12.4% (1,020,084) |
20 to 24 minutes:
| North Hempstead: | 10.0% (10,279) |
| New York: | 12.3% (1,013,757) |
25 to 29 minutes:
| North Hempstead: | 4.3% (4,428) |
| New York: | 4.9% (399,384) |
30 to 34 minutes:
| North Hempstead: | 11.7% (11,990) |
| New York: | 12.9% (1,058,688) |
35 to 39 minutes:
| North Hempstead: | 2.2% (2,213) |
| New York: | 2.5% (203,722) |
40 to 44 minutes:
| North Hempstead: | 3.9% (4,047) |
| New York: | 4.1% (340,311) |
45 to 59 minutes:
| North Hempstead: | 9.6% (9,851) |
| New York: | 9.8% (806,556) |
60 to 89 minutes:
| North Hempstead: | 16.1% (16,492) |
| New York: | 10.3% (848,185) |
90 or more minutes:
| North Hempstead: | 5.1% (5,237) |
| New York: | 5.1% (417,464) |
Means of transportation to work


Drove car alone:
| North Hempstead: | 64.5% (66,127) |
| New York: | 56.3% (4,620,178) |
Carpooled:
| North Hempstead: | 9.0% (9,208) |
| New York: | 9.2% (756,918) |
Bus or trolley bus:
| North Hempstead: | 2.3% (2,335) |
| New York: | 5.8% (475,389) |
Streetcar or trolley car:
| North Hempstead: | 0.0% (36) |
| New York: | 0.1% (6,058) |
Subway or elevated:
| North Hempstead: | 1.2% (1,203) |
| New York: | 14.8% (1,217,009) |
Railroad:
| North Hempstead: | 14.5% (14,878) |
| New York: | 2.8% (228,215) |
Ferryboat:
| North Hempstead: | 0.0% (2) |
| New York: | 0.1% (11,626) |
Taxicab:
| North Hempstead: | 0.3% (262) |
| New York: | 0.8% (67,897) |
Motorcycle:
| North Hempstead: | 0.0% (33) |
| New York: | 0.0% (3,625) |
Bicycle:
| North Hempstead: | 0.2% (254) |
| New York: | 0.3% (25,036) |
Walked:
| North Hempstead: | 3.6% (3,719) |
| New York: | 6.2% (511,721) |
Other means:
| North Hempstead: | 0.4% (431) |
| New York: | 0.5% (40,375) |
Private vehicle occupancy

Drove alone:
| North Hempstead: | 87.8% (66,127) |
| New York: | 85.9% (4,620,178) |
In 2 person carpool:
| North Hempstead: | 9.6% (7,206) |
| New York: | 11.0% (590,255) |
In 3 person carpool:
| North Hempstead: | 1.6% (1,215) |
| New York: | 1.8% (96,470) |
In 4 person carpool:
| North Hempstead: | 0.8% (586) |
| New York: | 0.7% (36,112) |
In 5-6 person carpool:
| North Hempstead: | 0.2% (135) |
| New York: | 0.3% (16,644) |
In 7+ person carpool:
| North Hempstead: | 0.1% (66) |
| New York: | 0.3% (17,437) |
Class of workers
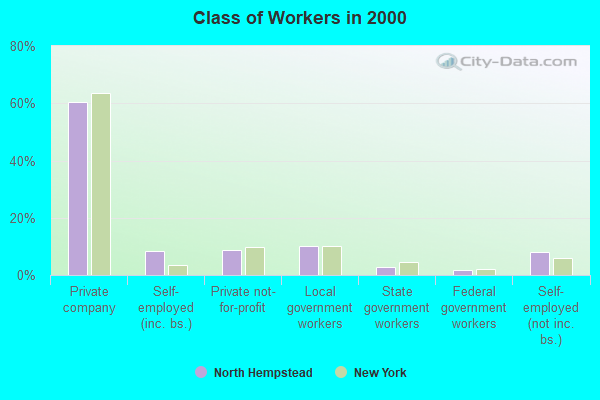
Employee of private company:
| North Hempstead: | 60.5% (63,268) |
| New York: | 63.7% (5,340,134) |
Self-employed in own incorporated business:
| North Hempstead: | 8.4% (8,818) |
| New York: | 3.4% (283,619) |
Private not-for-profit wage and salary workers:
| North Hempstead: | 8.6% (8,981) |
| New York: | 9.7% (810,356) |
Local government workers:
| North Hempstead: | 10.0% (10,414) |
| New York: | 10.2% (858,120) |
State government workers:
| North Hempstead: | 2.7% (2,777) |
| New York: | 4.6% (383,673) |
Federal government workers:
| North Hempstead: | 1.7% (1,741) |
| New York: | 2.2% (185,100) |
Self-employed workers in own not incorporated business:
| North Hempstead: | 7.9% (8,268) |
| New York: | 6.0% (501,068) |
Unpaid family workers:
| North Hempstead: | 0.3% (297) |
| New York: | 0.2% (20,918) |

Employee of private company - Males:
| North Hempstead: | 60.8% (34,940) |
| New York: | 66.2% (2,902,064) |
Self-employed in own incorporated business - Males:
| North Hempstead: | 12.3% (7,060) |
| New York: | 4.9% (215,651) |
Private not-for-profit wage and salary workers - Males:
| North Hempstead: | 5.5% (3,180) |
| New York: | 6.3% (277,787) |
Local government workers - Males:
| North Hempstead: | 7.5% (4,290) |
| New York: | 8.7% (380,426) |
State government workers - Males:
| North Hempstead: | 1.8% (1,050) |
| New York: | 4.1% (181,784) |
Federal government workers - Males:
| North Hempstead: | 2.0% (1,151) |
| New York: | 2.3% (102,647) |
Self-employed workers in own not incorporated business - Males:
| North Hempstead: | 9.9% (5,683) |
| New York: | 7.1% (312,497) |
Unpaid family workers - Males:
| North Hempstead: | 0.2% (93) |
| New York: | 0.2% (9,470) |

Employee of private company - Females:
| North Hempstead: | 60.1% (28,328) |
| New York: | 60.9% (2,438,070) |
Self-employed in own incorporated business - Females:
| North Hempstead: | 3.7% (1,758) |
| New York: | 1.7% (67,968) |
Private not-for-profit wage and salary workers - Females:
| North Hempstead: | 12.3% (5,801) |
| New York: | 13.3% (532,569) |
Local government workers - Females:
| North Hempstead: | 13.0% (6,124) |
| New York: | 11.9% (477,694) |
State government workers - Females:
| North Hempstead: | 3.7% (1,727) |
| New York: | 5.0% (201,889) |
Federal government workers - Females:
| North Hempstead: | 1.3% (590) |
| New York: | 2.1% (82,453) |
Self-employed workers in own not incorporated business - Females:
| North Hempstead: | 5.5% (2,585) |
| New York: | 4.7% (188,571) |
Unpaid family workers - Females:
| North Hempstead: | 0.4% (204) |
| New York: | 0.3% (11,448) |