Work and Jobs in North Tonawanda, New York (NY) Detailed Stats
Occupations, Industries, Unemployment, Workers, Commute
Settings
X


Recent posts about work in North Tonawanda, New York on our local forum with over 2,400,000 registered users:
 | Buffalo-Boom/Bust II (617 replies) |
| Crane watch map (349 replies) |
| Lockport development (108 replies) |
| For those interested in state political issues (428 replies) |
| Upstate NY job openings...... (1437 replies) |
| Not good North Tonawanda... (1 reply) |
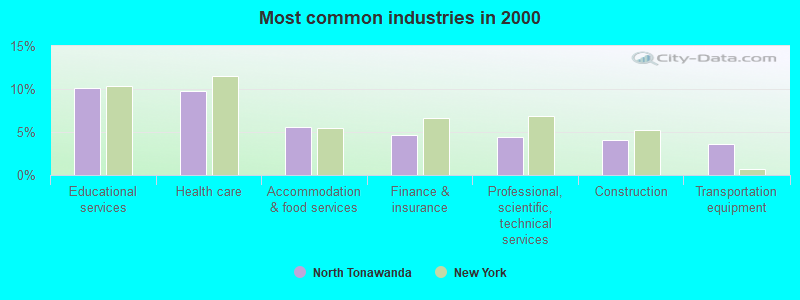
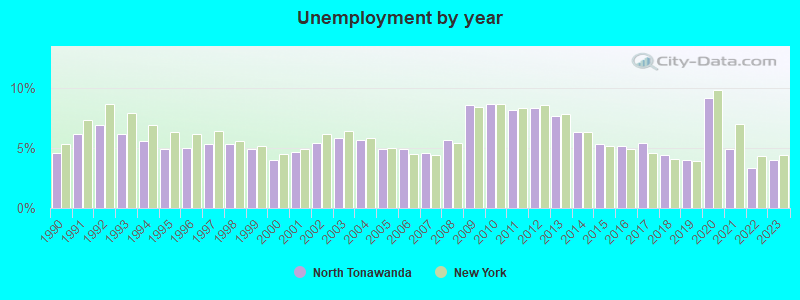
The unemployment rate in 2023 in North Tonawanda, NY was 4.0%, which was 10.0% less than the unemployment rate of 4.4% across the entire state of New York. Compared to the unemployment rate of 7.7% in 2013, this represents a decrease of 92.5%. The most common industries in North Tonawanda are: Educational services (10.2% of civilian employees), Health care (9.7% of civilian employees), Accommodation & food services (5.6% of civilian employees). 43.3% of workers work in Niagara County and 9.9% of all workers work at home. 73.0% of workers are employees of private companies, which is 14.8% greater than the rate of 62.2% across the entire state of New York.
Whole page based on the data from 2000 / 2022 when the population of North Tonawanda, New York was 33,262 / 30,285
Whole page based on the data from 2000 / 2022 when the population of North Tonawanda, New York was 33,262 / 30,285
Most common industries

Most common industries | |||
|---|---|---|---|
Industry | All | Males | Females |
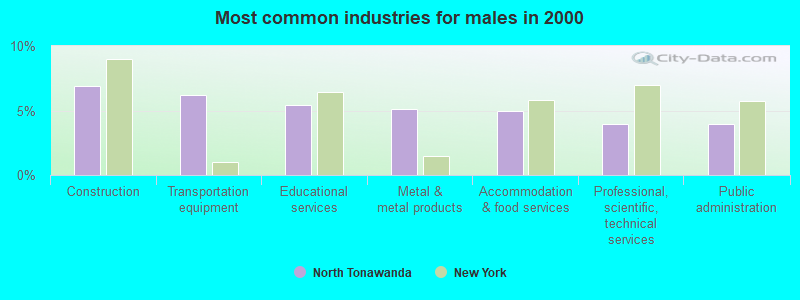
| Educational services | 10.2% (1,685) | 5.5% (471) | 15.3% (1,214) |
| Health care | 9.7% (1,614) | 3.0% (257) | 17.1% (1,357) |
| Accommodation and food services | 5.6% (935) | 4.9% (427) | 6.4% (508) |
| Finance and insurance | 4.6% (767) | 3.0% (262) | 6.3% (505) |
| Professional, scientific, and technical services | 4.4% (732) | 4.0% (342) | 4.9% (390) |
| Construction | 4.1% (677) | 6.9% (597) | 1.0% (80) |
| Transportation equipment | 3.6% (597) | 6.2% (537) | 0.8% (60) |
| Public administration | 3.5% (588) | 4.0% (342) | 3.1% (246) |
| Metal and metal products | 3.0% (505) | 5.2% (445) | 0.8% (60) |
| Administrative and support and waste management services | 2.9% (486) | 3.0% (255) | 2.9% (231) |
| Food and beverage stores | 2.8% (470) | 2.3% (199) | 3.4% (271) |
| Miscellaneous manufacturing | 2.7% (449) | 2.7% (237) | 2.7% (212) |
| Machinery | 2.3% (377) | 3.7% (317) | 0.8% (60) |
| Chemicals | 2.0% (338) | 3.0% (258) | 1.0% (80) |
| Social assistance | 2.0% (330) | 1.1% (95) | 3.0% (235) |
| Plastics and rubber products | 1.9% (317) | 2.3% (201) | 1.5% (116) |
| Other transportation, and support activities, and couriers | 1.8% (300) | 1.5% (131) | 2.1% (169) |
| Motor vehicle and parts dealers | 1.6% (269) | 2.1% (178) | 1.1% (91) |
| Repair and maintenance | 1.5% (244) | 2.5% (213) | 0.4% (31) |
| Other direct selling establishments | 1.4% (237) | 0.6% (52) | 2.3% (185) |
| Department and other general merchandise stores | 1.4% (235) | 0.9% (81) | 1.9% (154) |
| Arts, entertainment, and recreation | 1.4% (234) | 2.1% (185) | 0.6% (49) |
| Truck transportation | 1.2% (207) | 2.1% (183) | 0.3% (24) |
| Nonmetallic mineral products | 1.2% (204) | 1.9% (161) | 0.5% (43) |
| Computer and electronic products | 1.2% (196) | 1.5% (128) | 0.9% (68) |
| Used merchandise, gift, novelty, and souvenir, and other miscellaneous stores | 1.1% (188) | 0.8% (67) | 1.5% (121) |
| Personal and laundry services | 1.1% (188) | 0.3% (28) | 2.0% (160) |
| Religious, grantmaking, civic, professional, and similar organizations | 1.1% (177) | 1.0% (84) | 1.2% (93) |
| Food | 1.0% (173) | 0.9% (82) | 1.1% (91) |
| Printing and related support activities | 1.0% (171) | 1.1% (94) | 1.0% (77) |
| Clothing and accessories, including shoe, stores | 1.0% (169) | 0.4% (32) | 1.7% (137) |
| Professional and commercial equipment and supplies merchant wholesalers | 1.0% (168) | 1.2% (100) | 0.9% (68) |
| Building material and garden equipment and supplies dealers | 1.0% (161) | 1.6% (140) | 0.3% (21) |
| Broadcasting and telecommunications | 0.8% (140) | 0.8% (67) | 0.9% (73) |
| Machinery, equipment, and supplies merchant wholesalers | 0.8% (138) | 1.4% (120) | 0.2% (18) |
| Real estate and rental and leasing | 0.8% (132) | 0.6% (53) | 1.0% (79) |
| U. S. Postal service | 0.8% (130) | 1.2% (103) | 0.3% (27) |
| Paper | 0.7% (112) | 1.1% (97) | 0.2% (15) |
| Pharmacies and drug stores | 0.6% (107) | 0.3% (27) | 1.0% (80) |
| Publishing, and motion picture and sound recording industries | 0.6% (99) | 0.8% (69) | 0.4% (30) |
| Textile mills and textile products | 0.5% (86) | 0.8% (66) | 0.3% (20) |
| Furniture and home furnishings, and household appliance stores | 0.5% (83) | 0.4% (35) | 0.6% (48) |
| Utilities | 0.4% (73) | 0.6% (55) | 0.2% (18) |
| Sporting goods, camera, and hobby and toy stores | 0.4% (65) | 0.6% (52) | 0.2% (13) |
| Groceries and related products merchant wholesalers | 0.4% (65) | 0.6% (51) | 0.2% (14) |
| Electronic shopping and mail-order houses | 0.4% (59) | 0.2% (13) | 0.6% (46) |
| Electrical equipment, appliances, and components | 0.4% (59) | 0.4% (36) | 0.3% (23) |
| Miscellaneous nondurable goods merchant wholesalers | 0.3% (57) | 0.4% (34) | 0.3% (23) |
| Electrical and electronic goods merchant wholesalers | 0.3% (53) | 0.5% (45) | 0.1% (8) |
| Wood products | 0.3% (51) | 0.3% (23) | 0.4% (28) |
| Warehousing and storage | 0.3% (50) | 0.4% (31) | 0.2% (19) |
| Paper and paper products merchant wholesalers | 0.3% (49) | 0.5% (41) | 0.1% (8) |
| Hardware, plumbing and heating equipment, and supplies merchant wholesalers | 0.3% (47) | 0.5% (42) | 0.1% (5) |
| Drugs, sundries, and chemical and allied products merchant wholesalers | 0.3% (42) | 0.3% (24) | 0.2% (18) |
| Radio, TV, and computer stores | 0.2% (40) | 0.3% (29) | 0.1% (11) |
| Motor vehicles, parts and supplies merchant wholesalers | 0.2% (37) | 0.3% (29) | 0.1% (8) |
| Metals and minerals, except petroleum, merchant wholesalers | 0.2% (36) | 0.4% (36) | 0.0% (0) |
| Alcoholic beverages merchant wholesalers | 0.2% (34) | 0.4% (34) | 0.0% (0) |
| Gasoline stations | 0.2% (34) | 0.3% (23) | 0.1% (11) |
| Petroleum and petroleum products merchant wholesalers | 0.2% (32) | 0.4% (32) | 0.0% (0) |
| Rail transportation | 0.2% (31) | 0.4% (31) | 0.0% (0) |
| Data processing, libraries, and other information services | 0.2% (30) | 0.1% (5) | 0.3% (25) |
| Air transportation | 0.2% (25) | 0.2% (16) | 0.1% (9) |
| Private households | 0.1% (22) | 0.0% (0) | 0.3% (22) |
| Petroleum and coal products | 0.1% (20) | 0.2% (14) | 0.1% (6) |
| Furniture and related product manufacturing | 0.1% (19) | 0.2% (19) | 0.0% (0) |
| Agriculture, forestry, fishing and hunting | 0.1% (18) | 0.2% (18) | 0.0% (0) |
| Mining, quarrying, and oil and gas extraction | 0.1% (13) | 0.2% (13) | 0.0% (0) |
| Lumber and other construction materials merchant wholesalers | 0.1% (11) | 0.1% (11) | 0.0% (0) |
| Miscellaneous durable goods merchant wholesalers | 0.1% (9) | 0.1% (9) | 0.0% (0) |
Unemployment in North Tonawanda
- Unemployment by race in 2022
- Unemployment rate for White non-Hispanic residents
- 4.1%Males
- 2.5%Females
- Unemployment rate for Asian residents
- 12.6%Females
- Unemployment rate for two or more race residents
- 3.8%Males
- Unemployment by race in 2000
- Unemployment rate for White non-Hispanic residents
- 6.1%Males
- 4.0%Females
- Unemployment rate for American Indian and Alaska Native residents
- 34.8%Males
- 27.0%Females
- Unemployment rate for two or more race residents
- 8.8%Females
- Unemployment rate for Hispanic or Latino residents
- 8.0%Females
Unemployment in 2023:
| North Tonawanda: | 4.0% |
| New York: | 4.4% |
Unemployment in 2022:
| North Tonawanda: | 3.3% |
| New York: | 4.3% |
Unemployment in 2021:
| North Tonawanda: | 4.9% |
| New York: | 7.0% |
Unemployment in 2020:
| North Tonawanda: | 9.2% |
| New York: | 9.8% |
Unemployment in 2019:
| North Tonawanda: | 4.0% |
| New York: | 3.9% |
Unemployment in 2018:
| North Tonawanda: | 4.4% |
| New York: | 4.1% |
Unemployment in 2017:
| North Tonawanda: | 5.4% |
| New York: | 4.6% |
Unemployment in 2016:
| North Tonawanda: | 5.2% |
| New York: | 4.9% |
Unemployment in 2015:
| North Tonawanda: | 5.3% |
| New York: | 5.2% |
Unemployment in 2014:
| North Tonawanda: | 6.3% |
| New York: | 6.3% |
Unemployment in 2013:
| North Tonawanda: | 7.7% |
| New York: | 7.8% |
Unemployment in 2012:
| North Tonawanda: | 8.3% |
| New York: | 8.6% |
Unemployment in 2011:
| North Tonawanda: | 8.2% |
| New York: | 8.3% |
Unemployment in 2010:
| North Tonawanda: | 8.7% |
| New York: | 8.7% |
Unemployment in 2009:
| North Tonawanda: | 8.6% |
| New York: | 8.4% |
Unemployment in 2008:
| North Tonawanda: | 5.7% |
| New York: | 5.4% |
Unemployment in 2007:
| North Tonawanda: | 4.6% |
| New York: | 4.4% |
Unemployment in 2006:
| North Tonawanda: | 4.9% |
| New York: | 4.5% |
Unemployment in 2005:
| North Tonawanda: | 4.9% |
| New York: | 5.0% |
Unemployment in 2004:
| North Tonawanda: | 5.7% |
| New York: | 5.8% |
Unemployment in 2003:
| North Tonawanda: | 5.8% |
| New York: | 6.4% |
Unemployment in 2002:
| North Tonawanda: | 5.4% |
| New York: | 6.2% |
Unemployment in 2001:
| North Tonawanda: | 4.7% |
| New York: | 4.9% |
Unemployment in 2000:
| North Tonawanda: | 4.0% |
| New York: | 4.5% |
Unemployment in 1999:
| North Tonawanda: | 4.9% |
| New York: | 5.2% |
Unemployment in 1998:
| North Tonawanda: | 5.3% |
| New York: | 5.6% |
Unemployment in 1997:
| North Tonawanda: | 5.3% |
| New York: | 6.4% |
Unemployment in 1996:
| North Tonawanda: | 5.0% |
| New York: | 6.2% |
Unemployment in 1995:
| North Tonawanda: | 4.9% |
| New York: | 6.3% |
Unemployment in 1994:
| North Tonawanda: | 5.6% |
| New York: | 6.9% |
Unemployment in 1993:
| North Tonawanda: | 6.2% |
| New York: | 7.9% |
Unemployment in 1992:
| North Tonawanda: | 6.9% |
| New York: | 8.7% |
Unemployment in 1991:
| North Tonawanda: | 6.2% |
| New York: | 7.3% |
Unemployment in 1990:
| North Tonawanda: | 4.6% |
| New York: | 5.3% |
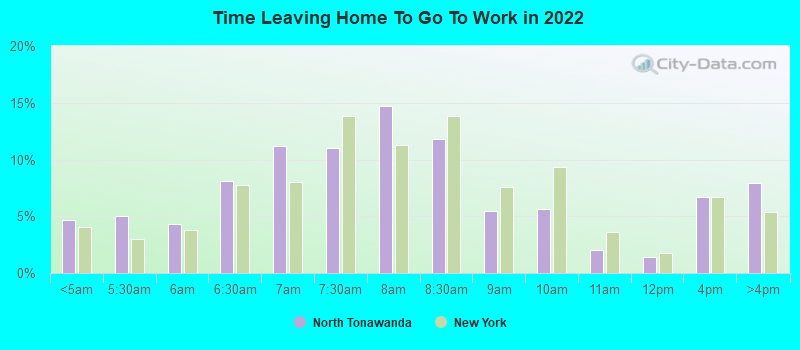
Time leaving home to go to work
12:00 a.m. to 4:59 a.m.:
| North Tonawanda: | 4.7% (651) |
| New York: | 4.0% (324,269) |
5:00 a.m. to 5:29 a.m.:
| North Tonawanda: | 5.0% (702) |
| New York: | 3.0% (244,203) |
5:30 a.m. to 5:59 a.m.:
| North Tonawanda: | 4.3% (605) |
| New York: | 3.8% (306,441) |
6:00 a.m. to 6:29 a.m.:
| North Tonawanda: | 8.1% (1,131) |
| New York: | 7.8% (625,523) |
6:30 a.m. to 6:59 a.m.:
| North Tonawanda: | 11.2% (1,556) |
| New York: | 8.0% (641,168) |
7:00 a.m. to 7:29 a.m.:
| North Tonawanda: | 11.0% (1,528) |
| New York: | 13.8% (1,113,086) |
7:30 a.m. to 7:59 a.m.:
| North Tonawanda: | 14.8% (2,054) |
| New York: | 11.3% (908,026) |
8:00 a.m. to 8:29 a.m.:
| North Tonawanda: | 11.8% (1,645) |
| New York: | 13.8% (1,113,103) |
8:30 a.m. to 8:59 a.m.:
| North Tonawanda: | 5.4% (755) |
| New York: | 7.6% (611,626) |
9:00 a.m. to 9:59 a.m.:
| North Tonawanda: | 5.6% (782) |
| New York: | 9.3% (751,365) |
10:00 a.m. to 10:59 a.m.:
| North Tonawanda: | 2.0% (281) |
| New York: | 3.6% (288,284) |
11:00 a.m. to 11:59 a.m.:
| North Tonawanda: | 1.4% (194) |
| New York: | 1.8% (142,295) |
12:00 p.m. to 3:59 p.m.:
| North Tonawanda: | 6.7% (928) |
| New York: | 6.7% (538,932) |
4:00 p.m. to 11:59 p.m.:
| North Tonawanda: | 7.9% (1,105) |
| New York: | 5.4% (432,010) |

<5am:
| North Tonawanda: | 2.0% (327) |
| New York: | 2.4% (194,562) |
5:30am:
| North Tonawanda: | 1.4% (233) |
| New York: | 2.1% (174,328) |
6am:
| North Tonawanda: | 4.1% (669) |
| New York: | 3.1% (253,826) |
6:30am:
| North Tonawanda: | 8.4% (1,365) |
| New York: | 7.0% (573,349) |
7am:
| North Tonawanda: | 11.7% (1,899) |
| New York: | 8.6% (706,982) |
7:30am:
| North Tonawanda: | 14.5% (2,342) |
| New York: | 14.0% (1,147,579) |
8am:
| North Tonawanda: | 15.9% (2,573) |
| New York: | 14.8% (1,213,706) |
8:30am:
| North Tonawanda: | 9.8% (1,593) |
| New York: | 13.9% (1,144,298) |
9am:
| North Tonawanda: | 6.3% (1,027) |
| New York: | 7.5% (614,475) |
10am:
| North Tonawanda: | 4.2% (687) |
| New York: | 7.2% (593,377) |
11am:
| North Tonawanda: | 1.4% (230) |
| New York: | 2.7% (224,011) |
12pm:
| North Tonawanda: | 1.0% (168) |
| New York: | 1.3% (105,049) |
4pm:
| North Tonawanda: | 8.7% (1,403) |
| New York: | 6.3% (517,309) |
>4pm:
| North Tonawanda: | 8.9% (1,447) |
| New York: | 6.1% (501,196) |

12:00 a.m. to 4:59 a.m. - Males:
| North Tonawanda: | 5.5% (413) |
| New York: | 5.3% (221,747) |
5:00 a.m. to 5:29 a.m. - Males:
| North Tonawanda: | 7.3% (545) |
| New York: | 4.3% (179,128) |
5:30 a.m. to 5:59 a.m. - Males:
| North Tonawanda: | 5.0% (371) |
| New York: | 5.0% (208,932) |
6:00 a.m. to 6:29 a.m. - Males:
| North Tonawanda: | 9.9% (742) |
| New York: | 9.2% (385,998) |
6:30 a.m. to 6:59 a.m. - Males:
| North Tonawanda: | 14.4% (1,077) |
| New York: | 8.0% (337,755) |
7:00 a.m. to 7:29 a.m. - Males:
| North Tonawanda: | 7.5% (559) |
| New York: | 13.5% (566,438) |
7:30 a.m. to 7:59 a.m. - Males:
| North Tonawanda: | 14.7% (1,096) |
| New York: | 9.7% (409,686) |
8:00 a.m. to 8:29 a.m. - Males:
| North Tonawanda: | 13.6% (1,014) |
| New York: | 12.3% (515,665) |
8:30 a.m. to 8:59 a.m. - Males:
| North Tonawanda: | 3.5% (260) |
| New York: | 6.3% (263,407) |
9:00 a.m. to 9:59 a.m. - Males:
| North Tonawanda: | 4.6% (343) |
| New York: | 8.6% (363,060) |
10:00 a.m. to 10:59 a.m. - Males:
| North Tonawanda: | 1.1% (85) |
| New York: | 3.5% (147,669) |
11:00 a.m. to 11:59 a.m. - Males:
| North Tonawanda: | 1.9% (139) |
| New York: | 1.8% (74,935) |
12:00 p.m. to 3:59 p.m. - Males:
| North Tonawanda: | 3.4% (253) |
| New York: | 7.0% (294,293) |
4:00 p.m. to 11:59 p.m. - Males:
| North Tonawanda: | 8.8% (656) |
| New York: | 5.7% (240,166) |

12:00 a.m. to 4:59 a.m. - Females:
| North Tonawanda: | 3.5% (227) |
| New York: | 2.7% (102,522) |
5:00 a.m. to 5:29 a.m. - Females:
| North Tonawanda: | 2.6% (164) |
| New York: | 1.7% (65,075) |
5:30 a.m. to 5:59 a.m. - Females:
| North Tonawanda: | 3.6% (234) |
| New York: | 2.5% (97,509) |
6:00 a.m. to 6:29 a.m. - Females:
| North Tonawanda: | 6.0% (388) |
| New York: | 6.3% (239,525) |
6:30 a.m. to 6:59 a.m. - Females:
| North Tonawanda: | 7.7% (493) |
| New York: | 7.9% (303,413) |
7:00 a.m. to 7:29 a.m. - Females:
| North Tonawanda: | 15.3% (986) |
| New York: | 14.3% (546,648) |
7:30 a.m. to 7:59 a.m. - Females:
| North Tonawanda: | 15.0% (967) |
| New York: | 13.0% (498,340) |
8:00 a.m. to 8:29 a.m. - Females:
| North Tonawanda: | 10.1% (652) |
| New York: | 15.6% (597,438) |
8:30 a.m. to 8:59 a.m. - Females:
| North Tonawanda: | 7.3% (468) |
| New York: | 9.1% (348,219) |
9:00 a.m. to 9:59 a.m. - Females:
| North Tonawanda: | 6.8% (435) |
| New York: | 10.1% (388,305) |
10:00 a.m. to 10:59 a.m. - Females:
| North Tonawanda: | 3.0% (192) |
| New York: | 3.7% (140,615) |
11:00 a.m. to 11:59 a.m. - Females:
| North Tonawanda: | 0.8% (50) |
| New York: | 1.8% (67,360) |
12:00 p.m. to 3:59 p.m. - Females:
| North Tonawanda: | 10.9% (704) |
| New York: | 6.4% (244,639) |
4:00 p.m. to 11:59 p.m. - Females:
| North Tonawanda: | 6.7% (428) |
| New York: | 5.0% (191,844) |
Travel time to work
Percentage of workers working in this county: 43.3%
Number of people working at home: 1,563 (9.9% of all workers)
Daytime population change due to commuting: -7,665 (-23.0%)
Workers who live and work in this city: 3,666 (22.6%)
Number of people working at home: 1,563 (9.9% of all workers)
Daytime population change due to commuting: -7,665 (-23.0%)
Workers who live and work in this city: 3,666 (22.6%)

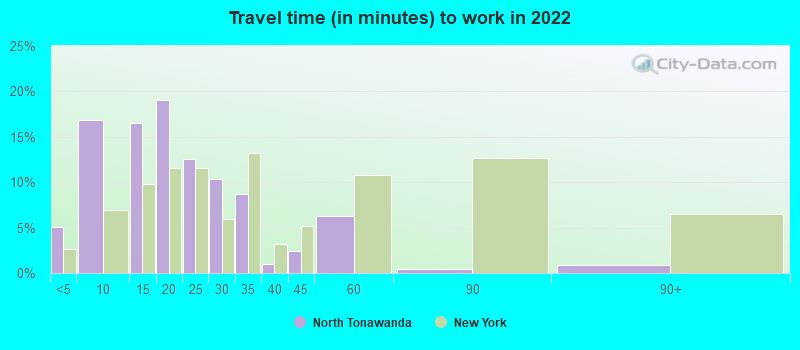

Less than 5 minutes:
| North Tonawanda: | 5.0% (388) |
| New York: | 2.7% (225,210) |
5 to 9 minutes:
| North Tonawanda: | 16.8% (1,294) |
| New York: | 6.9% (584,338) |
10 to 14 minutes:
| North Tonawanda: | 16.5% (1,269) |
| New York: | 9.8% (825,925) |
15 to 19 minutes:
| North Tonawanda: | 19.1% (1,464) |
| New York: | 11.6% (975,938) |
20 to 24 minutes:
| North Tonawanda: | 12.6% (965) |
| New York: | 11.6% (972,845) |
25 to 29 minutes:
| North Tonawanda: | 10.3% (795) |
| New York: | 5.9% (497,572) |
30 to 34 minutes:
| North Tonawanda: | 8.7% (665) |
| New York: | 13.2% (1,107,734) |
35 to 39 minutes:
| North Tonawanda: | 1.0% (77) |
| New York: | 3.2% (267,604) |
40 to 44 minutes:
| North Tonawanda: | 2.4% (185) |
| New York: | 5.2% (435,501) |
45 to 59 minutes:
| North Tonawanda: | 6.2% (480) |
| New York: | 10.8% (904,759) |
60 to 89 minutes:
| North Tonawanda: | 0.5% (36) |
| New York: | 12.7% (1,068,486) |
90 or more minutes:
| North Tonawanda: | 0.9% (69) |
| New York: | 6.4% (542,041) |


Less than 5 minutes:
| North Tonawanda: | 2.9% (463) |
| New York: | 2.7% (219,036) |
5 to 9 minutes:
| North Tonawanda: | 12.5% (2,027) |
| New York: | 8.3% (680,270) |
10 to 14 minutes:
| North Tonawanda: | 15.7% (2,541) |
| New York: | 11.6% (956,590) |
15 to 19 minutes:
| North Tonawanda: | 19.2% (3,114) |
| New York: | 12.4% (1,020,084) |
20 to 24 minutes:
| North Tonawanda: | 20.6% (3,339) |
| New York: | 12.3% (1,013,757) |
25 to 29 minutes:
| North Tonawanda: | 8.4% (1,361) |
| New York: | 4.9% (399,384) |
30 to 34 minutes:
| North Tonawanda: | 11.7% (1,896) |
| New York: | 12.9% (1,058,688) |
35 to 39 minutes:
| North Tonawanda: | 1.7% (271) |
| New York: | 2.5% (203,722) |
40 to 44 minutes:
| North Tonawanda: | 2.5% (404) |
| New York: | 4.1% (340,311) |
45 to 59 minutes:
| North Tonawanda: | 1.8% (295) |
| New York: | 9.8% (806,556) |
60 to 89 minutes:
| North Tonawanda: | 0.9% (153) |
| New York: | 10.3% (848,185) |
90 or more minutes:
| North Tonawanda: | 0.6% (99) |
| New York: | 5.1% (417,464) |

Less than 5 minutes - Males:
| North Tonawanda: | 4.9% (243) |
| New York: | 2.7% (121,454) |
5 to 9 minutes - Males:
| North Tonawanda: | 17.6% (866) |
| New York: | 6.5% (286,493) |
10 to 14 minutes - Males:
| North Tonawanda: | 15.2% (749) |
| New York: | 9.0% (399,036) |
15 to 19 minutes - Males:
| North Tonawanda: | 14.3% (705) |
| New York: | 10.8% (479,544) |
20 to 24 minutes - Males:
| North Tonawanda: | 12.7% (623) |
| New York: | 11.4% (503,832) |
25 to 29 minutes - Males:
| North Tonawanda: | 15.2% (746) |
| New York: | 5.9% (259,244) |
30 to 34 minutes - Males:
| North Tonawanda: | 8.7% (430) |
| New York: | 13.5% (598,211) |
35 to 39 minutes - Males:
| North Tonawanda: | 0.6% (30) |
| New York: | 3.2% (141,729) |
40 to 44 minutes - Males:
| North Tonawanda: | 2.2% (107) |
| New York: | 5.3% (235,705) |
45 to 59 minutes - Males:
| North Tonawanda: | 8.1% (398) |
| New York: | 10.9% (482,109) |
60 to 89 minutes - Males:
| North Tonawanda: | 0.9% (46) |
| New York: | 13.8% (608,656) |
90 or more minutes - Males:
| North Tonawanda: | 1.2% (57) |
| New York: | 7.0% (309,037) |

Less than 5 minutes - Females:
| North Tonawanda: | 5.4% (153) |
| New York: | 2.6% (103,756) |
5 to 9 minutes - Females:
| North Tonawanda: | 16.1% (453) |
| New York: | 7.5% (297,845) |
10 to 14 minutes - Females:
| North Tonawanda: | 18.2% (512) |
| New York: | 10.7% (426,889) |
15 to 19 minutes - Females:
| North Tonawanda: | 27.1% (763) |
| New York: | 12.5% (496,394) |
20 to 24 minutes - Females:
| North Tonawanda: | 12.5% (350) |
| New York: | 11.8% (469,013) |
25 to 29 minutes - Females:
| North Tonawanda: | 4.1% (116) |
| New York: | 6.0% (238,328) |
30 to 34 minutes - Females:
| North Tonawanda: | 8.4% (236) |
| New York: | 12.8% (509,523) |
35 to 39 minutes - Females:
| North Tonawanda: | 1.7% (48) |
| New York: | 3.2% (125,875) |
40 to 44 minutes - Females:
| North Tonawanda: | 2.8% (79) |
| New York: | 5.0% (199,796) |
45 to 59 minutes - Females:
| North Tonawanda: | 3.1% (88) |
| New York: | 10.6% (422,650) |
90 or more minutes - Females:
| North Tonawanda: | 0.4% (10) |
| New York: | 5.9% (233,004) |
Means of transportation to work
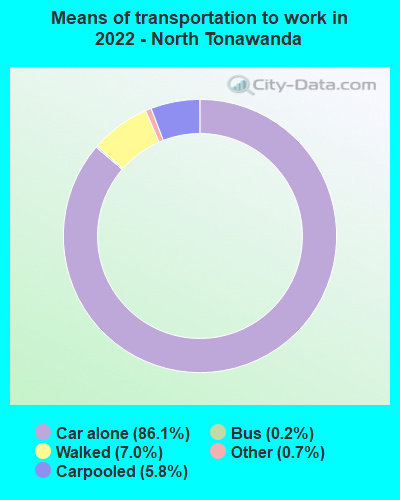
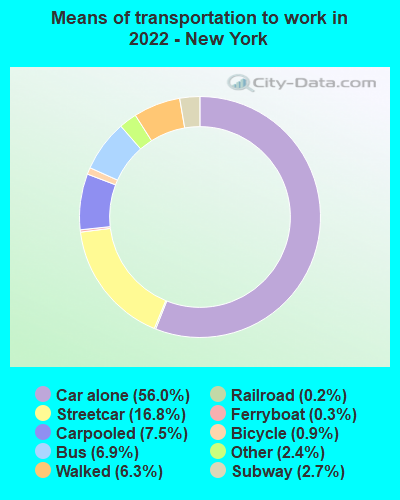
Drove car alone:
| North Tonawanda: | 86.1% (6,797) |
| New York: | 56.0% (2,137,855) |
Carpooled:
| North Tonawanda: | 5.8% (457) |
| New York: | 7.5% (314,148) |
Bus:
| North Tonawanda: | 0.2% (17) |
| New York: | 6.9% (329,762) |
Subway or elevated rail:
| North Tonawanda: | 0.0% (2) |
| New York: | 16.8% (698,442) |
Bicycle:
| North Tonawanda: | 0.1% (5) |
| New York: | 0.9% (21,215) |
Walked:
| North Tonawanda: | 7.0% (555) |
| New York: | 6.3% (272,995) |
Other means:
| North Tonawanda: | 0.7% (58) |
| New York: | 2.4% (101,006) |


Drove car alone:
| North Tonawanda: | 86.1% (13,946) |
| New York: | 56.3% (4,620,178) |
Carpooled:
| North Tonawanda: | 9.1% (1,474) |
| New York: | 9.2% (756,918) |
Bus or trolley bus:
| North Tonawanda: | 0.3% (56) |
| New York: | 5.8% (475,389) |
Streetcar or trolley car:
| North Tonawanda: | 0.0% (8) |
| New York: | 0.1% (6,058) |
Subway or elevated:
| North Tonawanda: | 0.1% (17) |
| New York: | 14.8% (1,217,009) |
Bicycle:
| North Tonawanda: | 0.3% (53) |
| New York: | 0.3% (25,036) |
Walked:
| North Tonawanda: | 2.2% (354) |
| New York: | 6.2% (511,721) |
Other means:
| North Tonawanda: | 0.3% (55) |
| New York: | 0.5% (40,375) |

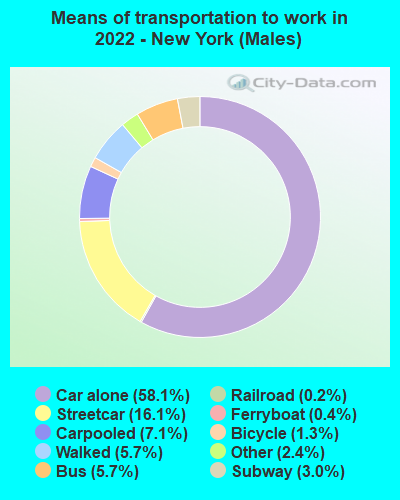
Drove car alone - Males:
| North Tonawanda: | 86.8% (4,346) |
| New York: | 58.1% (2,137,855) |
Carpooled - Males:
| North Tonawanda: | 5.2% (260) |
| New York: | 7.1% (314,148) |
Bus - Males:
| North Tonawanda: | 0.4% (18) |
| New York: | 5.7% (329,762) |
Subway or elevated rail - Males:
| North Tonawanda: | 0.0% (2) |
| New York: | 16.1% (698,442) |
Bicycle - Males:
| North Tonawanda: | 0.1% (5) |
| New York: | 1.3% (21,215) |
Walked - Males:
| North Tonawanda: | 6.5% (324) |
| New York: | 5.7% (272,995) |
Other means - Males:
| North Tonawanda: | 1.0% (50) |
| New York: | 2.4% (101,006) |

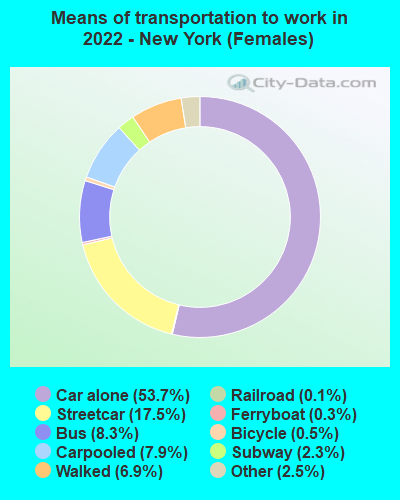
Drove car alone - Females:
| North Tonawanda: | 85.0% (2,488) |
| New York: | 53.7% (2,137,855) |
Carpooled - Females:
| North Tonawanda: | 6.7% (197) |
| New York: | 7.9% (314,148) |
Walked - Females:
| North Tonawanda: | 7.9% (232) |
| New York: | 6.9% (272,995) |
Other means - Females:
| North Tonawanda: | 0.3% (9) |
| New York: | 2.5% (101,006) |
Private vehicle occupancy

Drove alone:
| North Tonawanda: | 92.7% (12,248) |
| New York: | 88.3% (4,609,282) |
In 2 person carpool:
| North Tonawanda: | 5.5% (720) |
| New York: | 8.7% (455,269) |
In 3 person carpool:
| North Tonawanda: | 1.4% (181) |
| New York: | 1.6% (86,175) |
In 4 person carpool:
| North Tonawanda: | 0.4% (54) |
| New York: | 0.7% (37,602) |
In 7+ person carpool:
| North Tonawanda: | 0.0% (5) |
| New York: | 0.2% (12,838) |

Drove alone:
| North Tonawanda: | 90.4% (13,946) |
| New York: | 85.9% (4,620,178) |
In 2 person carpool:
| North Tonawanda: | 8.3% (1,285) |
| New York: | 11.0% (590,255) |
In 3 person carpool:
| North Tonawanda: | 1.0% (148) |
| New York: | 1.8% (96,470) |
In 4 person carpool:
| North Tonawanda: | 0.1% (22) |
| New York: | 0.7% (36,112) |
In 5-6 person carpool:
| North Tonawanda: | 0.1% (19) |
| New York: | 0.3% (16,644) |
Class of workers
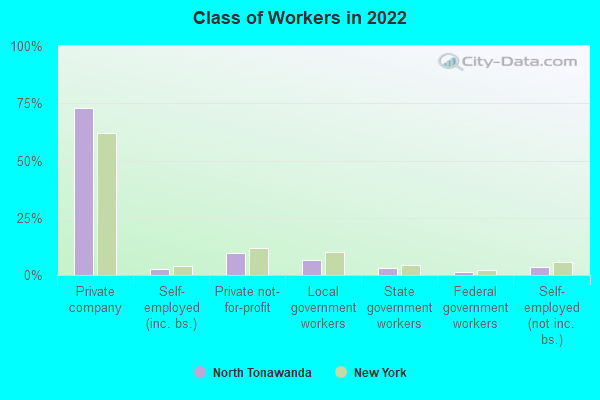
Employee of private company:
| North Tonawanda: | 73.0% (11,849) |
| New York: | 62.2% (5,966,667) |
Self-employed in own incorporated business:
| North Tonawanda: | 2.8% (453) |
| New York: | 4.1% (392,920) |
Private not-for-profit wage and salary workers:
| North Tonawanda: | 9.5% (1,546) |
| New York: | 11.6% (1,113,247) |
Local government workers:
| North Tonawanda: | 6.6% (1,077) |
| New York: | 9.9% (953,569) |
State government workers:
| North Tonawanda: | 2.9% (472) |
| New York: | 4.2% (401,705) |
Federal government workers:
| North Tonawanda: | 1.5% (247) |
| New York: | 2.0% (194,327) |
Self-employed workers in own not incorporated business:
| North Tonawanda: | 3.7% (596) |
| New York: | 5.9% (562,168) |

Employee of private company:
| North Tonawanda: | 72.2% (11,975) |
| New York: | 63.7% (5,340,134) |
Self-employed in own incorporated business:
| North Tonawanda: | 2.0% (331) |
| New York: | 3.4% (283,619) |
Private not-for-profit wage and salary workers:
| North Tonawanda: | 8.1% (1,347) |
| New York: | 9.7% (810,356) |
Local government workers:
| North Tonawanda: | 8.5% (1,411) |
| New York: | 10.2% (858,120) |
State government workers:
| North Tonawanda: | 3.1% (506) |
| New York: | 4.6% (383,673) |
Federal government workers:
| North Tonawanda: | 2.5% (414) |
| New York: | 2.2% (185,100) |
Self-employed workers in own not incorporated business:
| North Tonawanda: | 3.6% (605) |
| New York: | 6.0% (501,068) |

Employee of private company - Males:
| North Tonawanda: | 79.1% (6,869) |
| New York: | 65.7% (3,237,092) |
Self-employed in own incorporated business - Males:
| North Tonawanda: | 3.6% (317) |
| New York: | 5.3% (259,387) |
Private not-for-profit wage and salary workers - Males:
| North Tonawanda: | 3.6% (316) |
| New York: | 8.3% (407,704) |
Local government workers - Males:
| North Tonawanda: | 6.7% (579) |
| New York: | 7.9% (389,927) |
State government workers - Males:
| North Tonawanda: | 2.2% (194) |
| New York: | 4.1% (199,717) |
Federal government workers - Males:
| North Tonawanda: | 1.6% (138) |
| New York: | 2.1% (104,103) |
Self-employed workers in own not incorporated business - Males:
| North Tonawanda: | 3.2% (275) |
| New York: | 6.6% (324,901) |

Employee of private company - Females:
| North Tonawanda: | 65.9% (4,980) |
| New York: | 58.4% (2,729,575) |
Self-employed in own incorporated business - Females:
| North Tonawanda: | 1.8% (136) |
| New York: | 2.9% (133,533) |
Private not-for-profit wage and salary workers - Females:
| North Tonawanda: | 16.3% (1,230) |
| New York: | 15.1% (705,543) |
Local government workers - Females:
| North Tonawanda: | 6.6% (498) |
| New York: | 12.1% (563,642) |
State government workers - Females:
| North Tonawanda: | 3.7% (279) |
| New York: | 4.3% (201,988) |
Federal government workers - Females:
| North Tonawanda: | 1.5% (110) |
| New York: | 1.9% (90,224) |
Self-employed workers in own not incorporated business - Females:
| North Tonawanda: | 4.3% (321) |
| New York: | 5.1% (237,267) |