Work and Jobs in Orangetown, New York (NY) Detailed Stats
Occupations, Industries, Unemployment, Workers, Commute
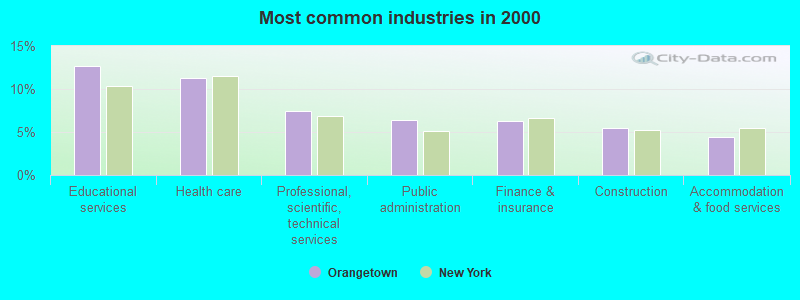
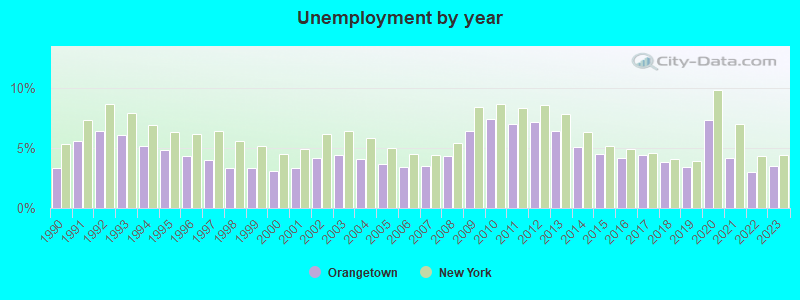
The unemployment rate in 2023 in Orangetown, NY was 3.5%, which was 25.7% less than the unemployment rate of 4.4% across the entire state of New York. Compared to the unemployment rate of 6.4% in 2013, this represents a decrease of 82.9%. The most common industries in Orangetown are: Educational services (12.6% of civilian employees), Health care (11.3% of civilian employees), Professional, scientific, technical services (7.5% of civilian employees). 59.9% of workers are employees of private companies, which is 6.3% less than the rate of 63.7% across the entire state of New York.
Most common industries
Most common industries | |||
|---|---|---|---|
Industry | All | Males | Females |
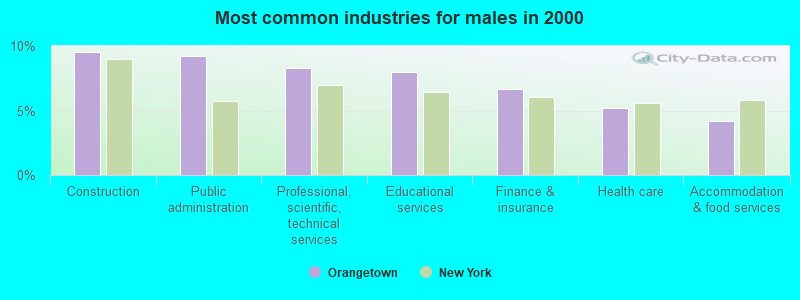
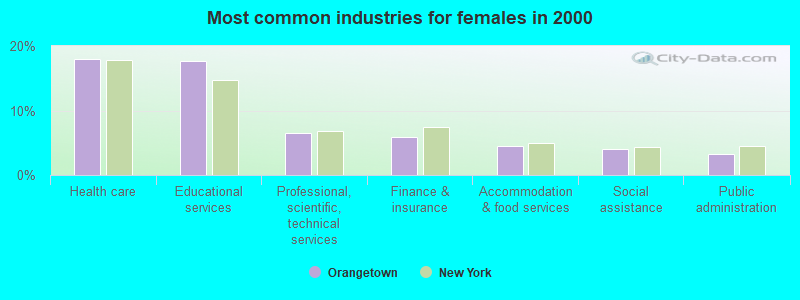
| Educational services | 12.6% (3,059) | 8.0% (1,009) | 17.7% (2,050) |
| Health care | 11.3% (2,743) | 5.2% (659) | 18.0% (2,084) |
| Professional, scientific, and technical services | 7.5% (1,810) | 8.3% (1,054) | 6.5% (756) |
| Public administration | 6.3% (1,535) | 9.2% (1,164) | 3.2% (371) |
| Finance and insurance | 6.3% (1,528) | 6.6% (842) | 5.9% (686) |
| Construction | 5.5% (1,336) | 9.5% (1,204) | 1.1% (132) |
| Accommodation and food services | 4.4% (1,056) | 4.2% (534) | 4.5% (522) |
| Chemicals | 3.0% (731) | 3.1% (391) | 2.9% (340) |
| Publishing, and motion picture and sound recording industries | 2.8% (687) | 2.7% (343) | 3.0% (344) |
| Social assistance | 2.4% (590) | 1.0% (126) | 4.0% (464) |
| Arts, entertainment, and recreation | 2.3% (560) | 1.9% (238) | 2.8% (322) |
| Broadcasting and telecommunications | 2.3% (550) | 2.6% (328) | 1.9% (222) |
| Administrative and support and waste management services | 2.2% (534) | 2.3% (287) | 2.1% (247) |
| Religious, grantmaking, civic, professional, and similar organizations | 2.0% (473) | 2.2% (273) | 1.7% (200) |
| Real estate and rental and leasing | 1.8% (428) | 1.8% (229) | 1.7% (199) |
| Clothing and accessories, including shoe, stores | 1.5% (366) | 1.2% (156) | 1.8% (210) |
| Utilities | 1.4% (349) | 2.4% (298) | 0.4% (51) |
| Other transportation, and support activities, and couriers | 1.4% (331) | 2.1% (260) | 0.6% (71) |
| Food and beverage stores | 1.3% (326) | 1.4% (177) | 1.3% (149) |
| Personal and laundry services | 1.3% (317) | 1.0% (132) | 1.6% (185) |
| Miscellaneous manufacturing | 1.2% (281) | 1.3% (162) | 1.0% (119) |
| Motor vehicle and parts dealers | 1.0% (239) | 1.2% (152) | 0.8% (87) |
| Repair and maintenance | 1.0% (237) | 1.6% (208) | 0.3% (29) |
| Department and other general merchandise stores | 0.8% (205) | 0.6% (71) | 1.2% (134) |
| Computer and electronic products | 0.8% (196) | 1.0% (130) | 0.6% (66) |
| Food | 0.7% (172) | 0.7% (92) | 0.7% (80) |
| Radio, TV, and computer stores | 0.7% (171) | 0.9% (113) | 0.5% (58) |
| Transportation equipment | 0.7% (165) | 0.8% (103) | 0.5% (62) |
| Sporting goods, camera, and hobby and toy stores | 0.6% (154) | 0.6% (78) | 0.7% (76) |
| Building material and garden equipment and supplies dealers | 0.6% (137) | 0.6% (78) | 0.5% (59) |
| Pharmacies and drug stores | 0.5% (132) | 0.4% (55) | 0.7% (77) |
| Data processing, libraries, and other information services | 0.5% (128) | 0.5% (65) | 0.5% (63) |
| Used merchandise, gift, novelty, and souvenir, and other miscellaneous stores | 0.5% (125) | 0.7% (89) | 0.3% (36) |
| Miscellaneous nondurable goods merchant wholesalers | 0.5% (109) | 0.7% (92) | 0.1% (17) |
| Metal and metal products | 0.4% (107) | 0.5% (63) | 0.4% (44) |
| Professional and commercial equipment and supplies merchant wholesalers | 0.4% (104) | 0.4% (52) | 0.5% (52) |
| Other direct selling establishments | 0.4% (104) | 0.5% (62) | 0.4% (42) |
| Printing and related support activities | 0.4% (103) | 0.6% (71) | 0.3% (32) |
| Truck transportation | 0.4% (103) | 0.8% (103) | 0.0% (0) |
| Private households | 0.4% (100) | 0.0% (0) | 0.9% (100) |
| Apparel | 0.4% (95) | 0.4% (54) | 0.4% (41) |
| Miscellaneous durable goods merchant wholesalers | 0.4% (94) | 0.4% (55) | 0.3% (39) |
| Groceries and related products merchant wholesalers | 0.4% (94) | 0.7% (88) | 0.1% (6) |
| Health and personal care, except drug, stores | 0.4% (87) | 0.3% (39) | 0.4% (48) |
| Book stores and news dealers | 0.3% (82) | 0.3% (37) | 0.4% (45) |
| Electrical equipment, appliances, and components | 0.3% (77) | 0.2% (31) | 0.4% (46) |
| Electrical and electronic goods merchant wholesalers | 0.3% (75) | 0.3% (42) | 0.3% (33) |
| Apparel, fabrics, and notions merchant wholesalers | 0.3% (72) | 0.4% (48) | 0.2% (24) |
| Paper | 0.3% (69) | 0.2% (23) | 0.4% (46) |
| U. S. Postal service | 0.3% (69) | 0.5% (64) | 0.0% (5) |
| Machinery, equipment, and supplies merchant wholesalers | 0.3% (66) | 0.4% (55) | 0.1% (11) |
| Jewelry, luggage, and leather goods stores | 0.3% (65) | 0.2% (24) | 0.4% (41) |
| Furniture and home furnishings, and household appliance stores | 0.2% (59) | 0.2% (27) | 0.3% (32) |
| Textile mills and textile products | 0.2% (59) | 0.3% (43) | 0.1% (16) |
| Alcoholic beverages merchant wholesalers | 0.2% (58) | 0.2% (26) | 0.3% (32) |
| Paper and paper products merchant wholesalers | 0.2% (55) | 0.3% (37) | 0.2% (18) |
| Machinery | 0.2% (52) | 0.3% (38) | 0.1% (14) |
| Drugs, sundries, and chemical and allied products merchant wholesalers | 0.2% (52) | 0.2% (25) | 0.2% (27) |
| Plastics and rubber products | 0.2% (49) | 0.3% (42) | 0.1% (7) |
| Motor vehicles, parts and supplies merchant wholesalers | 0.2% (47) | 0.2% (22) | 0.2% (25) |
| Gasoline stations | 0.2% (47) | 0.4% (47) | 0.0% (0) |
| Furniture and related product manufacturing | 0.2% (44) | 0.3% (44) | 0.0% (0) |
| Air transportation | 0.2% (41) | 0.1% (16) | 0.2% (25) |
| Rail transportation | 0.1% (36) | 0.3% (36) | 0.0% (0) |
| Hardware, plumbing and heating equipment, and supplies merchant wholesalers | 0.1% (35) | 0.2% (27) | 0.1% (8) |
| Beverage and tobacco products | 0.1% (29) | 0.1% (15) | 0.1% (14) |
| Music stores | 0.1% (21) | 0.2% (21) | 0.0% (0) |
| Water transportation | 0.1% (15) | 0.1% (15) | 0.0% (0) |
Unemployment in Orangetown
- Unemployment by race in 2000
- Unemployment rate for White non-Hispanic residents
- 2.7%Males
- 2.4%Females
- Unemployment rate for Black residents
- 8.6%Males
- 7.3%Females
- Unemployment rate for Asian residents
- 1.2%Males
- 7.1%Females
- Unemployment rate for other race residents
- 15.5%Males
- Unemployment rate for two or more race residents
- 2.5%Males
- 2.8%Females
- Unemployment rate for Hispanic or Latino residents
- 7.2%Males
- 0.5%Females
Unemployment in 2023:
| Orangetown: | 3.5% |
| New York: | 4.4% |
Unemployment in 2022:
| Orangetown: | 3.0% |
| New York: | 4.3% |
Unemployment in 2021:
| Orangetown: | 4.2% |
| New York: | 7.0% |
Unemployment in 2020:
| Orangetown: | 7.3% |
| New York: | 9.8% |
Unemployment in 2019:
| Orangetown: | 3.4% |
| New York: | 3.9% |
Unemployment in 2018:
| Orangetown: | 3.8% |
| New York: | 4.1% |
Unemployment in 2017:
| Orangetown: | 4.4% |
| New York: | 4.6% |
Unemployment in 2016:
| Orangetown: | 4.2% |
| New York: | 4.9% |
Unemployment in 2015:
| Orangetown: | 4.5% |
| New York: | 5.2% |
Unemployment in 2014:
| Orangetown: | 5.1% |
| New York: | 6.3% |
Unemployment in 2013:
| Orangetown: | 6.4% |
| New York: | 7.8% |
Unemployment in 2012:
| Orangetown: | 7.2% |
| New York: | 8.6% |
Unemployment in 2011:
| Orangetown: | 7.0% |
| New York: | 8.3% |
Unemployment in 2010:
| Orangetown: | 7.4% |
| New York: | 8.7% |
Unemployment in 2009:
| Orangetown: | 6.4% |
| New York: | 8.4% |
Unemployment in 2008:
| Orangetown: | 4.3% |
| New York: | 5.4% |
Unemployment in 2007:
| Orangetown: | 3.5% |
| New York: | 4.4% |
Unemployment in 2006:
| Orangetown: | 3.4% |
| New York: | 4.5% |
Unemployment in 2005:
| Orangetown: | 3.7% |
| New York: | 5.0% |
Unemployment in 2004:
| Orangetown: | 4.1% |
| New York: | 5.8% |
Unemployment in 2003:
| Orangetown: | 4.4% |
| New York: | 6.4% |
Unemployment in 2002:
| Orangetown: | 4.2% |
| New York: | 6.2% |
Unemployment in 2001:
| Orangetown: | 3.3% |
| New York: | 4.9% |
Unemployment in 2000:
| Orangetown: | 3.1% |
| New York: | 4.5% |
Unemployment in 1999:
| Orangetown: | 3.3% |
| New York: | 5.2% |
Unemployment in 1998:
| Orangetown: | 3.3% |
| New York: | 5.6% |
Unemployment in 1997:
| Orangetown: | 4.0% |
| New York: | 6.4% |
Unemployment in 1996:
| Orangetown: | 4.3% |
| New York: | 6.2% |
Unemployment in 1995:
| Orangetown: | 4.8% |
| New York: | 6.3% |
Unemployment in 1994:
| Orangetown: | 5.2% |
| New York: | 6.9% |
Unemployment in 1993:
| Orangetown: | 6.1% |
| New York: | 7.9% |
Unemployment in 1992:
| Orangetown: | 6.4% |
| New York: | 8.7% |
Unemployment in 1991:
| Orangetown: | 5.6% |
| New York: | 7.3% |
Unemployment in 1990:
| Orangetown: | 3.3% |
| New York: | 5.3% |
Time leaving home to go to work

<5am:
| Orangetown: | 1.3% (307) |
| New York: | 2.4% (194,562) |
5:30am:
| Orangetown: | 1.1% (254) |
| New York: | 2.1% (174,328) |
6am:
| Orangetown: | 2.3% (544) |
| New York: | 3.1% (253,826) |
6:30am:
| Orangetown: | 7.8% (1,853) |
| New York: | 7.0% (573,349) |
7am:
| Orangetown: | 8.8% (2,097) |
| New York: | 8.6% (706,982) |
7:30am:
| Orangetown: | 14.8% (3,503) |
| New York: | 14.0% (1,147,579) |
8am:
| Orangetown: | 13.2% (3,117) |
| New York: | 14.8% (1,213,706) |
8:30am:
| Orangetown: | 14.3% (3,396) |
| New York: | 13.9% (1,144,298) |
9am:
| Orangetown: | 9.0% (2,127) |
| New York: | 7.5% (614,475) |
10am:
| Orangetown: | 7.6% (1,807) |
| New York: | 7.2% (593,377) |
11am:
| Orangetown: | 3.1% (729) |
| New York: | 2.7% (224,011) |
12pm:
| Orangetown: | 1.4% (339) |
| New York: | 1.3% (105,049) |
4pm:
| Orangetown: | 5.7% (1,343) |
| New York: | 6.3% (517,309) |
>4pm:
| Orangetown: | 5.8% (1,366) |
| New York: | 6.1% (501,196) |
Travel time to work


Less than 5 minutes:
| Orangetown: | 4.1% (962) |
| New York: | 2.7% (219,036) |
5 to 9 minutes:
| Orangetown: | 11.0% (2,608) |
| New York: | 8.3% (680,270) |
10 to 14 minutes:
| Orangetown: | 12.9% (3,049) |
| New York: | 11.6% (956,590) |
15 to 19 minutes:
| Orangetown: | 11.8% (2,804) |
| New York: | 12.4% (1,020,084) |
20 to 24 minutes:
| Orangetown: | 9.6% (2,286) |
| New York: | 12.3% (1,013,757) |
25 to 29 minutes:
| Orangetown: | 3.8% (898) |
| New York: | 4.9% (399,384) |
30 to 34 minutes:
| Orangetown: | 8.5% (2,011) |
| New York: | 12.9% (1,058,688) |
35 to 39 minutes:
| Orangetown: | 3.1% (732) |
| New York: | 2.5% (203,722) |
40 to 44 minutes:
| Orangetown: | 4.9% (1,166) |
| New York: | 4.1% (340,311) |
45 to 59 minutes:
| Orangetown: | 9.9% (2,349) |
| New York: | 9.8% (806,556) |
60 to 89 minutes:
| Orangetown: | 11.0% (2,609) |
| New York: | 10.3% (848,185) |
90 or more minutes:
| Orangetown: | 5.5% (1,308) |
| New York: | 5.1% (417,464) |
Means of transportation to work


Drove car alone:
| Orangetown: | 73.4% (17,404) |
| New York: | 56.3% (4,620,178) |
Carpooled:
| Orangetown: | 10.1% (2,400) |
| New York: | 9.2% (756,918) |
Bus or trolley bus:
| Orangetown: | 4.3% (1,028) |
| New York: | 5.8% (475,389) |
Streetcar or trolley car:
| Orangetown: | 0.0% (10) |
| New York: | 0.1% (6,058) |
Subway or elevated:
| Orangetown: | 0.2% (54) |
| New York: | 14.8% (1,217,009) |
Railroad:
| Orangetown: | 2.6% (614) |
| New York: | 2.8% (228,215) |
Ferryboat:
| Orangetown: | 0.1% (29) |
| New York: | 0.1% (11,626) |
Taxicab:
| Orangetown: | 0.5% (128) |
| New York: | 0.8% (67,897) |
Motorcycle:
| Orangetown: | 0.1% (27) |
| New York: | 0.0% (3,625) |
Bicycle:
| Orangetown: | 0.2% (39) |
| New York: | 0.3% (25,036) |
Walked:
| Orangetown: | 4.2% (1,000) |
| New York: | 6.2% (511,721) |
Other means:
| Orangetown: | 0.2% (49) |
| New York: | 0.5% (40,375) |
Private vehicle occupancy

Drove alone:
| Orangetown: | 87.9% (17,404) |
| New York: | 85.9% (4,620,178) |
In 2 person carpool:
| Orangetown: | 9.4% (1,852) |
| New York: | 11.0% (590,255) |
In 3 person carpool:
| Orangetown: | 1.7% (334) |
| New York: | 1.8% (96,470) |
In 4 person carpool:
| Orangetown: | 0.7% (138) |
| New York: | 0.7% (36,112) |
In 5-6 person carpool:
| Orangetown: | 0.2% (43) |
| New York: | 0.3% (16,644) |
In 7+ person carpool:
| Orangetown: | 0.2% (33) |
| New York: | 0.3% (17,437) |
Class of workers
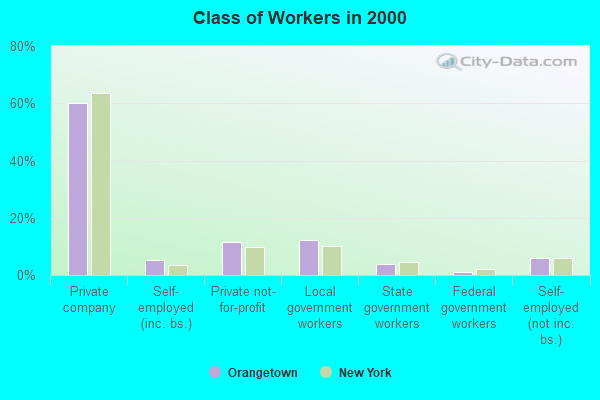
Employee of private company:
| Orangetown: | 59.9% (14,509) |
| New York: | 63.7% (5,340,134) |
Self-employed in own incorporated business:
| Orangetown: | 5.2% (1,269) |
| New York: | 3.4% (283,619) |
Private not-for-profit wage and salary workers:
| Orangetown: | 11.5% (2,796) |
| New York: | 9.7% (810,356) |
Local government workers:
| Orangetown: | 12.2% (2,945) |
| New York: | 10.2% (858,120) |
State government workers:
| Orangetown: | 3.7% (898) |
| New York: | 4.6% (383,673) |
Federal government workers:
| Orangetown: | 1.2% (284) |
| New York: | 2.2% (185,100) |
Self-employed workers in own not incorporated business:
| Orangetown: | 5.8% (1,410) |
| New York: | 6.0% (501,068) |
Unpaid family workers:
| Orangetown: | 0.4% (104) |
| New York: | 0.2% (20,918) |

Employee of private company - Males:
| Orangetown: | 60.4% (7,644) |
| New York: | 66.2% (2,902,064) |
Self-employed in own incorporated business - Males:
| Orangetown: | 7.4% (932) |
| New York: | 4.9% (215,651) |
Private not-for-profit wage and salary workers - Males:
| Orangetown: | 7.8% (985) |
| New York: | 6.3% (277,787) |
Local government workers - Males:
| Orangetown: | 12.6% (1,593) |
| New York: | 8.7% (380,426) |
State government workers - Males:
| Orangetown: | 3.8% (476) |
| New York: | 4.1% (181,784) |
Federal government workers - Males:
| Orangetown: | 1.8% (231) |
| New York: | 2.3% (102,647) |
Self-employed workers in own not incorporated business - Males:
| Orangetown: | 5.9% (749) |
| New York: | 7.1% (312,497) |
Unpaid family workers - Males:
| Orangetown: | 0.4% (55) |
| New York: | 0.2% (9,470) |

Employee of private company - Females:
| Orangetown: | 59.4% (6,865) |
| New York: | 60.9% (2,438,070) |
Self-employed in own incorporated business - Females:
| Orangetown: | 2.9% (337) |
| New York: | 1.7% (67,968) |
Private not-for-profit wage and salary workers - Females:
| Orangetown: | 15.7% (1,811) |
| New York: | 13.3% (532,569) |
Local government workers - Females:
| Orangetown: | 11.7% (1,352) |
| New York: | 11.9% (477,694) |
State government workers - Females:
| Orangetown: | 3.7% (422) |
| New York: | 5.0% (201,889) |
Federal government workers - Females:
| Orangetown: | 0.5% (53) |
| New York: | 2.1% (82,453) |
Self-employed workers in own not incorporated business - Females:
| Orangetown: | 5.7% (661) |
| New York: | 4.7% (188,571) |
Unpaid family workers - Females:
| Orangetown: | 0.4% (49) |
| New York: | 0.3% (11,448) |