Work and Jobs in Perinton, New York (NY) Detailed Stats
Occupations, Industries, Unemployment, Workers, Commute
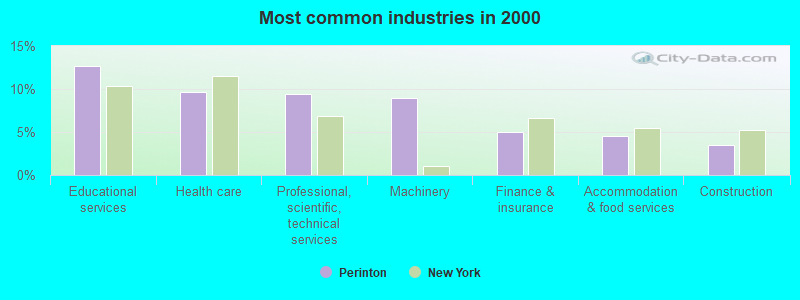
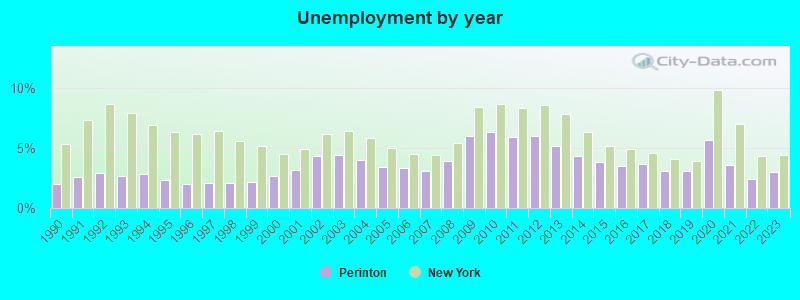
The unemployment rate in 2023 in Perinton, NY was 3.0%, which was 46.7% less than the unemployment rate of 4.4% across the entire state of New York. Compared to the unemployment rate of 5.2% in 2013, this represents a decrease of 73.3%. The most common industries in Perinton are: Educational services (12.7% of civilian employees), Health care (9.7% of civilian employees), Professional, scientific, technical services (9.4% of civilian employees). 66.5% of workers are employees of private companies, which is 4.2% greater than the rate of 63.7% across the entire state of New York.
Most common industries
Most common industries | |||
|---|---|---|---|
Industry | All | Males | Females |
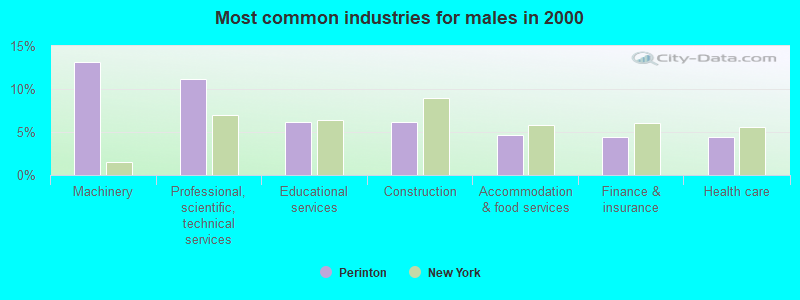
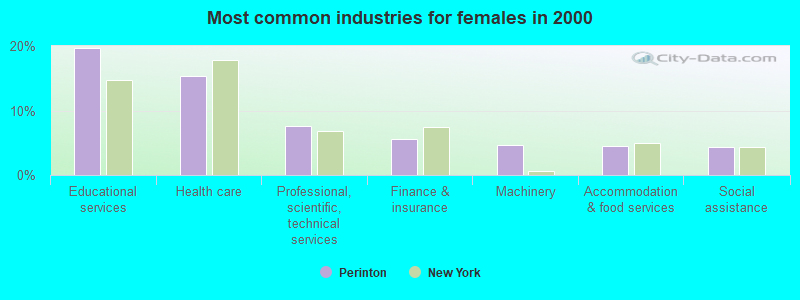
| Educational services | 12.7% (3,119) | 6.2% (782) | 19.7% (2,337) |
| Health care | 9.7% (2,374) | 4.4% (557) | 15.3% (1,817) |
| Professional, scientific, and technical services | 9.4% (2,319) | 11.2% (1,416) | 7.6% (903) |
| Machinery | 9.0% (2,207) | 13.1% (1,663) | 4.6% (544) |
| Finance and insurance | 5.0% (1,223) | 4.4% (559) | 5.6% (664) |
| Accommodation and food services | 4.5% (1,110) | 4.6% (582) | 4.4% (528) |
| Construction | 3.4% (846) | 6.1% (777) | 0.6% (69) |
| Food and beverage stores | 3.1% (768) | 2.3% (294) | 4.0% (474) |
| Administrative and support and waste management services | 2.9% (702) | 3.0% (385) | 2.7% (317) |
| Public administration | 2.5% (623) | 3.2% (405) | 1.8% (218) |
| Social assistance | 2.3% (562) | 0.4% (52) | 4.3% (510) |
| Miscellaneous manufacturing | 2.3% (553) | 2.6% (327) | 1.9% (226) |
| Broadcasting and telecommunications | 2.0% (482) | 2.7% (340) | 1.2% (142) |
| Arts, entertainment, and recreation | 1.7% (423) | 1.6% (198) | 1.9% (225) |
| Computer and electronic products | 1.6% (404) | 2.4% (299) | 0.9% (105) |
| Real estate and rental and leasing | 1.6% (392) | 1.8% (225) | 1.4% (167) |
| Personal and laundry services | 1.4% (355) | 0.7% (89) | 2.2% (266) |
| Chemicals | 1.3% (317) | 1.8% (230) | 0.7% (87) |
| Publishing, and motion picture and sound recording industries | 1.3% (311) | 1.4% (174) | 1.2% (137) |
| Metal and metal products | 1.2% (284) | 1.7% (221) | 0.5% (63) |
| Religious, grantmaking, civic, professional, and similar organizations | 1.1% (276) | 0.8% (104) | 1.4% (172) |
| Radio, TV, and computer stores | 1.0% (254) | 1.2% (158) | 0.8% (96) |
| Transportation equipment | 1.0% (246) | 1.5% (194) | 0.4% (52) |
| Data processing, libraries, and other information services | 0.9% (233) | 0.9% (120) | 1.0% (113) |
| Motor vehicle and parts dealers | 0.9% (229) | 1.2% (156) | 0.6% (73) |
| Professional and commercial equipment and supplies merchant wholesalers | 0.9% (222) | 1.3% (165) | 0.5% (57) |
| Utilities | 0.8% (205) | 1.1% (143) | 0.5% (62) |
| Used merchandise, gift, novelty, and souvenir, and other miscellaneous stores | 0.8% (199) | 0.5% (58) | 1.2% (141) |
| Department and other general merchandise stores | 0.8% (196) | 0.2% (30) | 1.4% (166) |
| Other direct selling establishments | 0.7% (175) | 0.6% (72) | 0.9% (103) |
| Furniture and home furnishings, and household appliance stores | 0.7% (170) | 0.8% (95) | 0.6% (75) |
| Repair and maintenance | 0.7% (166) | 1.0% (128) | 0.3% (38) |
| Plastics and rubber products | 0.7% (161) | 0.8% (99) | 0.5% (62) |
| Paper | 0.6% (155) | 0.9% (115) | 0.3% (40) |
| Groceries and related products merchant wholesalers | 0.6% (146) | 0.8% (105) | 0.3% (41) |
| Pharmacies and drug stores | 0.6% (139) | 0.5% (66) | 0.6% (73) |
| Printing and related support activities | 0.5% (128) | 0.9% (119) | 0.1% (9) |
| Other transportation, and support activities, and couriers | 0.5% (123) | 0.8% (102) | 0.2% (21) |
| Building material and garden equipment and supplies dealers | 0.5% (121) | 0.7% (86) | 0.3% (35) |
| Clothing and accessories, including shoe, stores | 0.5% (113) | 0.2% (22) | 0.8% (91) |
| Machinery, equipment, and supplies merchant wholesalers | 0.4% (109) | 0.8% (101) | 0.1% (8) |
| Electrical and electronic goods merchant wholesalers | 0.4% (105) | 0.6% (75) | 0.3% (30) |
| U. S. Postal service | 0.4% (104) | 0.5% (65) | 0.3% (39) |
| Miscellaneous nondurable goods merchant wholesalers | 0.4% (86) | 0.7% (86) | 0.0% (0) |
| Truck transportation | 0.3% (73) | 0.5% (65) | 0.1% (8) |
| Food | 0.3% (71) | 0.5% (61) | 0.1% (10) |
| Sporting goods, camera, and hobby and toy stores | 0.3% (69) | 0.2% (22) | 0.4% (47) |
| Health and personal care, except drug, stores | 0.3% (68) | 0.2% (25) | 0.4% (43) |
| Miscellaneous durable goods merchant wholesalers | 0.3% (66) | 0.3% (41) | 0.2% (25) |
| Nonmetallic mineral products | 0.2% (61) | 0.3% (38) | 0.2% (23) |
| Electrical equipment, appliances, and components | 0.2% (54) | 0.3% (43) | 0.1% (11) |
| Drugs, sundries, and chemical and allied products merchant wholesalers | 0.2% (52) | 0.3% (33) | 0.2% (19) |
| Private households | 0.2% (47) | 0.1% (9) | 0.3% (38) |
| Jewelry, luggage, and leather goods stores | 0.2% (43) | 0.0% (0) | 0.4% (43) |
| Air transportation | 0.2% (41) | 0.1% (14) | 0.2% (27) |
| Gasoline stations | 0.2% (37) | 0.2% (26) | 0.1% (11) |
| Furniture and home furnishing merchant wholesalers | 0.1% (36) | 0.2% (20) | 0.1% (16) |
| Beverage and tobacco products | 0.1% (34) | 0.2% (25) | 0.1% (9) |
| Office supplies and stationery stores | 0.1% (34) | 0.2% (20) | 0.1% (14) |
| Lumber and other construction materials merchant wholesalers | 0.1% (32) | 0.3% (32) | 0.0% (0) |
| Retail florists | 0.1% (29) | 0.1% (15) | 0.1% (14) |
| Paper and paper products merchant wholesalers | 0.1% (28) | 0.2% (21) | 0.1% (7) |
| Metals and minerals, except petroleum, merchant wholesalers | 0.1% (25) | 0.0% (0) | 0.2% (25) |
| Alcoholic beverages merchant wholesalers | 0.1% (23) | 0.1% (15) | 0.1% (8) |
| Furniture and related product manufacturing | 0.1% (20) | 0.1% (13) | 0.1% (7) |
| Music stores | 0.1% (19) | 0.2% (19) | 0.0% (0) |
| Mining, quarrying, and oil and gas extraction | 0.1% (17) | 0.1% (17) | 0.0% (0) |
Unemployment in Perinton
- Unemployment by race in 2000
- Unemployment rate for White non-Hispanic residents
- 3.9%Males
- 2.1%Females
- Unemployment rate for Black residents
- 6.4%Males
- 5.1%Females
- Unemployment rate for other race residents
- 18.9%Females
- Unemployment rate for Hispanic or Latino residents
- 3.8%Males
- 12.0%Females
Unemployment in 2023:
| Perinton: | 3.0% |
| New York: | 4.4% |
Unemployment in 2022:
| Perinton: | 2.4% |
| New York: | 4.3% |
Unemployment in 2021:
| Perinton: | 3.6% |
| New York: | 7.0% |
Unemployment in 2020:
| Perinton: | 5.7% |
| New York: | 9.8% |
Unemployment in 2019:
| Perinton: | 3.1% |
| New York: | 3.9% |
Unemployment in 2018:
| Perinton: | 3.1% |
| New York: | 4.1% |
Unemployment in 2017:
| Perinton: | 3.7% |
| New York: | 4.6% |
Unemployment in 2016:
| Perinton: | 3.5% |
| New York: | 4.9% |
Unemployment in 2015:
| Perinton: | 3.8% |
| New York: | 5.2% |
Unemployment in 2014:
| Perinton: | 4.3% |
| New York: | 6.3% |
Unemployment in 2013:
| Perinton: | 5.2% |
| New York: | 7.8% |
Unemployment in 2012:
| Perinton: | 6.0% |
| New York: | 8.6% |
Unemployment in 2011:
| Perinton: | 5.9% |
| New York: | 8.3% |
Unemployment in 2010:
| Perinton: | 6.3% |
| New York: | 8.7% |
Unemployment in 2009:
| Perinton: | 6.0% |
| New York: | 8.4% |
Unemployment in 2008:
| Perinton: | 3.9% |
| New York: | 5.4% |
Unemployment in 2007:
| Perinton: | 3.1% |
| New York: | 4.4% |
Unemployment in 2006:
| Perinton: | 3.3% |
| New York: | 4.5% |
Unemployment in 2005:
| Perinton: | 3.4% |
| New York: | 5.0% |
Unemployment in 2004:
| Perinton: | 4.0% |
| New York: | 5.8% |
Unemployment in 2003:
| Perinton: | 4.4% |
| New York: | 6.4% |
Unemployment in 2002:
| Perinton: | 4.3% |
| New York: | 6.2% |
Unemployment in 2001:
| Perinton: | 3.2% |
| New York: | 4.9% |
Unemployment in 2000:
| Perinton: | 2.7% |
| New York: | 4.5% |
Unemployment in 1999:
| Perinton: | 2.2% |
| New York: | 5.2% |
Unemployment in 1998:
| Perinton: | 2.1% |
| New York: | 5.6% |
Unemployment in 1997:
| Perinton: | 2.1% |
| New York: | 6.4% |
Unemployment in 1996:
| Perinton: | 2.0% |
| New York: | 6.2% |
Unemployment in 1995:
| Perinton: | 2.3% |
| New York: | 6.3% |
Unemployment in 1994:
| Perinton: | 2.8% |
| New York: | 6.9% |
Unemployment in 1993:
| Perinton: | 2.7% |
| New York: | 7.9% |
Unemployment in 1992:
| Perinton: | 2.9% |
| New York: | 8.7% |
Unemployment in 1991:
| Perinton: | 2.6% |
| New York: | 7.3% |
Unemployment in 1990:
| Perinton: | 2.0% |
| New York: | 5.3% |
Time leaving home to go to work

<5am:
| Perinton: | 1.3% (318) |
| New York: | 2.4% (194,562) |
5:30am:
| Perinton: | 1.3% (318) |
| New York: | 2.1% (174,328) |
6am:
| Perinton: | 2.3% (546) |
| New York: | 3.1% (253,826) |
6:30am:
| Perinton: | 5.4% (1,301) |
| New York: | 7.0% (573,349) |
7am:
| Perinton: | 10.2% (2,472) |
| New York: | 8.6% (706,982) |
7:30am:
| Perinton: | 18.4% (4,466) |
| New York: | 14.0% (1,147,579) |
8am:
| Perinton: | 19.1% (4,640) |
| New York: | 14.8% (1,213,706) |
8:30am:
| Perinton: | 12.6% (3,048) |
| New York: | 13.9% (1,144,298) |
9am:
| Perinton: | 7.8% (1,899) |
| New York: | 7.5% (614,475) |
10am:
| Perinton: | 5.8% (1,407) |
| New York: | 7.2% (593,377) |
11am:
| Perinton: | 1.8% (439) |
| New York: | 2.7% (224,011) |
12pm:
| Perinton: | 1.1% (261) |
| New York: | 1.3% (105,049) |
4pm:
| Perinton: | 4.2% (1,010) |
| New York: | 6.3% (517,309) |
>4pm:
| Perinton: | 4.4% (1,063) |
| New York: | 6.1% (501,196) |
Travel time to work


Less than 5 minutes:
| Perinton: | 2.5% (612) |
| New York: | 2.7% (219,036) |
5 to 9 minutes:
| Perinton: | 9.7% (2,343) |
| New York: | 8.3% (680,270) |
10 to 14 minutes:
| Perinton: | 14.4% (3,501) |
| New York: | 11.6% (956,590) |
15 to 19 minutes:
| Perinton: | 14.3% (3,480) |
| New York: | 12.4% (1,020,084) |
20 to 24 minutes:
| Perinton: | 20.4% (4,946) |
| New York: | 12.3% (1,013,757) |
25 to 29 minutes:
| Perinton: | 12.4% (3,003) |
| New York: | 4.9% (399,384) |
30 to 34 minutes:
| Perinton: | 14.0% (3,400) |
| New York: | 12.9% (1,058,688) |
35 to 39 minutes:
| Perinton: | 2.2% (536) |
| New York: | 2.5% (203,722) |
40 to 44 minutes:
| Perinton: | 1.6% (390) |
| New York: | 4.1% (340,311) |
45 to 59 minutes:
| Perinton: | 1.9% (458) |
| New York: | 9.8% (806,556) |
60 to 89 minutes:
| Perinton: | 1.1% (272) |
| New York: | 10.3% (848,185) |
90 or more minutes:
| Perinton: | 1.0% (247) |
| New York: | 5.1% (417,464) |
Means of transportation to work


Drove car alone:
| Perinton: | 88.4% (21,462) |
| New York: | 56.3% (4,620,178) |
Carpooled:
| Perinton: | 5.5% (1,326) |
| New York: | 9.2% (756,918) |
Bus or trolley bus:
| Perinton: | 0.3% (74) |
| New York: | 5.8% (475,389) |
Subway or elevated:
| Perinton: | 0.0% (6) |
| New York: | 14.8% (1,217,009) |
Bicycle:
| Perinton: | 0.0% (8) |
| New York: | 0.3% (25,036) |
Walked:
| Perinton: | 0.9% (215) |
| New York: | 6.2% (511,721) |
Other means:
| Perinton: | 0.4% (97) |
| New York: | 0.5% (40,375) |
Private vehicle occupancy

Drove alone:
| Perinton: | 94.2% (21,462) |
| New York: | 85.9% (4,620,178) |
In 2 person carpool:
| Perinton: | 5.1% (1,153) |
| New York: | 11.0% (590,255) |
In 3 person carpool:
| Perinton: | 0.5% (103) |
| New York: | 1.8% (96,470) |
In 4 person carpool:
| Perinton: | 0.2% (37) |
| New York: | 0.7% (36,112) |
In 7+ person carpool:
| Perinton: | 0.1% (33) |
| New York: | 0.3% (17,437) |
Class of workers
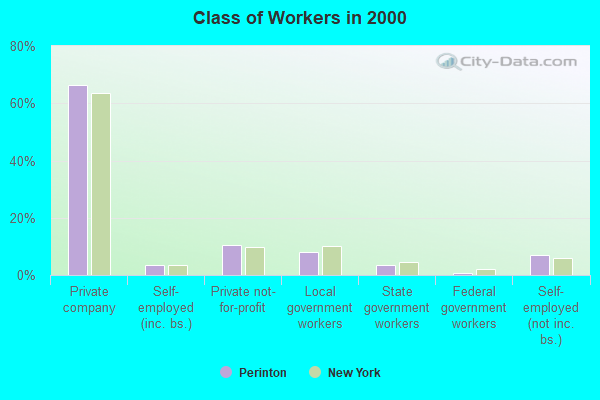
Employee of private company:
| Perinton: | 66.5% (16,315) |
| New York: | 63.7% (5,340,134) |
Self-employed in own incorporated business:
| Perinton: | 3.4% (834) |
| New York: | 3.4% (283,619) |
Private not-for-profit wage and salary workers:
| Perinton: | 10.5% (2,579) |
| New York: | 9.7% (810,356) |
Local government workers:
| Perinton: | 8.1% (1,994) |
| New York: | 10.2% (858,120) |
State government workers:
| Perinton: | 3.4% (832) |
| New York: | 4.6% (383,673) |
Federal government workers:
| Perinton: | 0.9% (210) |
| New York: | 2.2% (185,100) |
Self-employed workers in own not incorporated business:
| Perinton: | 7.0% (1,729) |
| New York: | 6.0% (501,068) |
Unpaid family workers:
| Perinton: | 0.2% (55) |
| New York: | 0.2% (20,918) |

Employee of private company - Males:
| Perinton: | 73.0% (9,241) |
| New York: | 66.2% (2,902,064) |
Self-employed in own incorporated business - Males:
| Perinton: | 5.0% (635) |
| New York: | 4.9% (215,651) |
Private not-for-profit wage and salary workers - Males:
| Perinton: | 5.4% (686) |
| New York: | 6.3% (277,787) |
Local government workers - Males:
| Perinton: | 6.0% (761) |
| New York: | 8.7% (380,426) |
State government workers - Males:
| Perinton: | 2.2% (276) |
| New York: | 4.1% (181,784) |
Federal government workers - Males:
| Perinton: | 0.9% (109) |
| New York: | 2.3% (102,647) |
Self-employed workers in own not incorporated business - Males:
| Perinton: | 7.3% (925) |
| New York: | 7.1% (312,497) |
Unpaid family workers - Males:
| Perinton: | 0.2% (27) |
| New York: | 0.2% (9,470) |

Employee of private company - Females:
| Perinton: | 59.5% (7,074) |
| New York: | 60.9% (2,438,070) |
Self-employed in own incorporated business - Females:
| Perinton: | 1.7% (199) |
| New York: | 1.7% (67,968) |
Private not-for-profit wage and salary workers - Females:
| Perinton: | 15.9% (1,893) |
| New York: | 13.3% (532,569) |
Local government workers - Females:
| Perinton: | 10.4% (1,233) |
| New York: | 11.9% (477,694) |
State government workers - Females:
| Perinton: | 4.7% (556) |
| New York: | 5.0% (201,889) |
Federal government workers - Females:
| Perinton: | 0.8% (101) |
| New York: | 2.1% (82,453) |
Self-employed workers in own not incorporated business - Females:
| Perinton: | 6.8% (804) |
| New York: | 4.7% (188,571) |
Unpaid family workers - Females:
| Perinton: | 0.2% (28) |
| New York: | 0.3% (11,448) |