Work and Jobs in Picnic Point-North Lynnwood, Washington (WA) Detailed Stats
Occupations, Industries, Unemployment, Workers, Commute

Discuss Picnic Point-North Lynnwood, Washington work on our local forum with over 2,400,000 registered users
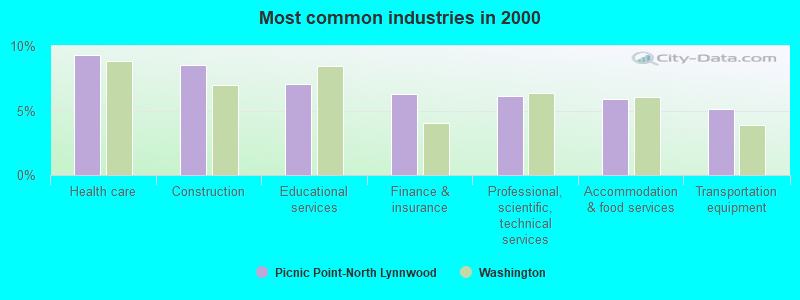
The most common industries in Picnic Point-North Lynnwood are: Health care (9.3% of civilian employees), Construction (8.5% of civilian employees), Educational services (7.1% of civilian employees). 73.7% of workers are employees of private companies, which is 10.5% greater than the rate of 66.0% across the entire state of Washington.
Most common industries
Most common industries | |||
|---|---|---|---|
Industry | All | Males | Females |
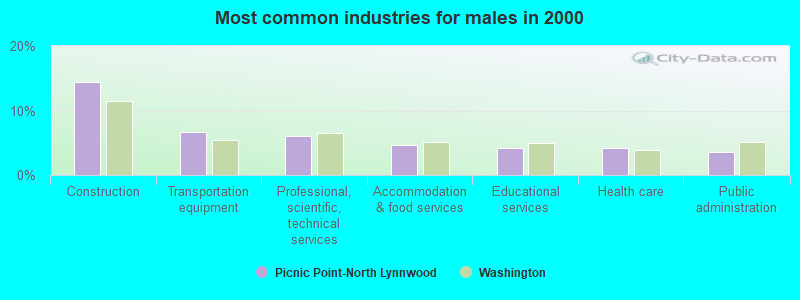
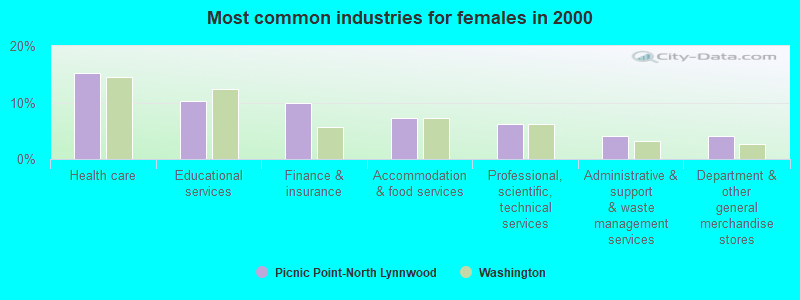
| Health care | 9.3% (1,162) | 4.1% (275) | 15.3% (887) |
| Construction | 8.5% (1,064) | 14.4% (965) | 1.7% (99) |
| Educational services | 7.1% (882) | 4.2% (283) | 10.3% (599) |
| Finance and insurance | 6.3% (783) | 3.1% (206) | 10.0% (577) |
| Professional, scientific, and technical services | 6.2% (769) | 6.1% (409) | 6.2% (360) |
| Accommodation and food services | 5.9% (736) | 4.7% (311) | 7.3% (425) |
| Transportation equipment | 5.1% (634) | 6.6% (442) | 3.3% (192) |
| Administrative and support and waste management services | 3.5% (440) | 3.0% (203) | 4.1% (237) |
| Public administration | 3.0% (380) | 3.5% (235) | 2.5% (145) |
| Department and other general merchandise stores | 3.0% (369) | 2.0% (136) | 4.0% (233) |
| Food and beverage stores | 2.7% (337) | 2.0% (136) | 3.5% (201) |
| Real estate and rental and leasing | 2.5% (314) | 2.2% (148) | 2.9% (166) |
| Motor vehicle and parts dealers | 2.2% (274) | 3.1% (206) | 1.2% (68) |
| Computer and electronic products | 2.1% (267) | 2.7% (182) | 1.5% (85) |
| Broadcasting and telecommunications | 2.0% (248) | 2.0% (137) | 1.9% (111) |
| Other transportation, and support activities, and couriers | 1.9% (239) | 2.8% (186) | 0.9% (53) |
| Arts, entertainment, and recreation | 1.7% (210) | 1.8% (118) | 1.6% (92) |
| Radio, TV, and computer stores | 1.6% (195) | 2.5% (170) | 0.4% (25) |
| Social assistance | 1.5% (191) | 0.3% (20) | 2.9% (171) |
| Miscellaneous manufacturing | 1.5% (191) | 2.3% (157) | 0.6% (34) |
| Publishing, and motion picture and sound recording industries | 1.4% (169) | 1.6% (104) | 1.1% (65) |
| Metal and metal products | 1.0% (128) | 1.6% (105) | 0.4% (23) |
| Personal and laundry services | 0.9% (111) | 0.4% (25) | 1.5% (86) |
| Repair and maintenance | 0.9% (110) | 1.6% (110) | 0.0% (0) |
| Furniture and home furnishings, and household appliance stores | 0.9% (109) | 0.9% (59) | 0.9% (50) |
| Religious, grantmaking, civic, professional, and similar organizations | 0.9% (108) | 0.4% (29) | 1.4% (79) |
| Clothing and accessories, including shoe, stores | 0.8% (99) | 0.6% (38) | 1.1% (61) |
| Machinery, equipment, and supplies merchant wholesalers | 0.8% (97) | 1.0% (68) | 0.5% (29) |
| Building material and garden equipment and supplies dealers | 0.8% (96) | 0.8% (52) | 0.8% (44) |
| Agriculture, forestry, fishing and hunting | 0.7% (92) | 1.0% (69) | 0.4% (23) |
| U. S. Postal service | 0.7% (87) | 1.2% (78) | 0.2% (9) |
| Professional and commercial equipment and supplies merchant wholesalers | 0.7% (82) | 0.7% (50) | 0.6% (32) |
| Utilities | 0.6% (80) | 0.8% (51) | 0.5% (29) |
| Air transportation | 0.6% (74) | 0.7% (48) | 0.4% (26) |
| Used merchandise, gift, novelty, and souvenir, and other miscellaneous stores | 0.6% (69) | 0.6% (42) | 0.5% (27) |
| Other direct selling establishments | 0.5% (68) | 0.4% (27) | 0.7% (41) |
| Furniture and related product manufacturing | 0.5% (64) | 0.7% (50) | 0.2% (14) |
| Sporting goods, camera, and hobby and toy stores | 0.5% (61) | 0.5% (32) | 0.5% (29) |
| Nonmetallic mineral products | 0.5% (57) | 0.6% (38) | 0.3% (19) |
| Food | 0.4% (54) | 0.5% (34) | 0.3% (20) |
| Metals and minerals, except petroleum, merchant wholesalers | 0.4% (50) | 0.5% (36) | 0.2% (14) |
| Private households | 0.4% (49) | 0.0% (0) | 0.8% (49) |
| Truck transportation | 0.4% (49) | 0.7% (49) | 0.0% (0) |
| Alcoholic beverages merchant wholesalers | 0.4% (44) | 0.5% (36) | 0.1% (8) |
| Lumber and other construction materials merchant wholesalers | 0.3% (42) | 0.6% (38) | 0.1% (4) |
| Data processing, libraries, and other information services | 0.3% (42) | 0.5% (31) | 0.2% (11) |
| Printing and related support activities | 0.3% (41) | 0.6% (41) | 0.0% (0) |
| Groceries and related products merchant wholesalers | 0.3% (40) | 0.6% (40) | 0.0% (0) |
| Miscellaneous durable goods merchant wholesalers | 0.3% (40) | 0.5% (34) | 0.1% (6) |
| Machinery | 0.3% (39) | 0.5% (34) | 0.1% (5) |
| Pharmacies and drug stores | 0.3% (38) | 0.3% (18) | 0.3% (20) |
| Electronic shopping and mail-order houses | 0.3% (38) | 0.2% (16) | 0.4% (22) |
| Electrical and electronic goods merchant wholesalers | 0.3% (38) | 0.2% (13) | 0.4% (25) |
| Health and personal care, except drug, stores | 0.3% (37) | 0.2% (16) | 0.4% (21) |
| Chemicals | 0.3% (33) | 0.3% (19) | 0.2% (14) |
| Rail transportation | 0.3% (33) | 0.5% (33) | 0.0% (0) |
| Electrical equipment, appliances, and components | 0.2% (29) | 0.2% (11) | 0.3% (18) |
| Jewelry, luggage, and leather goods stores | 0.2% (24) | 0.0% (0) | 0.4% (24) |
| Gasoline stations | 0.2% (23) | 0.3% (23) | 0.0% (0) |
| Textile mills and textile products | 0.2% (21) | 0.2% (14) | 0.1% (7) |
| Music stores | 0.2% (20) | 0.1% (10) | 0.2% (10) |
| Hardware, plumbing and heating equipment, and supplies merchant wholesalers | 0.2% (20) | 0.3% (20) | 0.0% (0) |
| Book stores and news dealers | 0.1% (18) | 0.1% (10) | 0.1% (8) |
| Furniture and home furnishing merchant wholesalers | 0.1% (18) | 0.2% (13) | 0.1% (5) |
| Apparel | 0.1% (18) | 0.3% (18) | 0.0% (0) |
| Miscellaneous nondurable goods merchant wholesalers | 0.1% (18) | 0.2% (12) | 0.1% (6) |
| Plastics and rubber products | 0.1% (17) | 0.1% (7) | 0.2% (10) |
| Wood products | 0.1% (16) | 0.2% (16) | 0.0% (0) |
| Motor vehicles, parts and supplies merchant wholesalers | 0.1% (15) | 0.2% (15) | 0.0% (0) |
| Paper | 0.1% (12) | 0.2% (12) | 0.0% (0) |
| Leather and allied products | 0.1% (8) | 0.1% (8) | 0.0% (0) |
Unemployment in Picnic Point-North Lynnwood
- Unemployment by race in 2000
- Unemployment rate for White non-Hispanic residents
- 2.6%Males
- 3.2%Females
- Unemployment rate for Black residents
- 4.1%Males
- Unemployment rate for American Indian and Alaska Native residents
- 19.6%Males
- Unemployment rate for Asian residents
- 7.0%Males
- 6.9%Females
- Unemployment rate for other race residents
- 4.0%Males
- Unemployment rate for two or more race residents
- 7.4%Males
- Unemployment rate for Hispanic or Latino residents
- 8.5%Males
Time leaving home to go to work

<5am:
| Picnic Point-North Lynnwood: | 3.8% (466) |
| Washington: | 4.2% (115,997) |
5:30am:
| Picnic Point-North Lynnwood: | 4.1% (497) |
| Washington: | 3.7% (102,868) |
6am:
| Picnic Point-North Lynnwood: | 5.3% (649) |
| Washington: | 5.3% (147,812) |
6:30am:
| Picnic Point-North Lynnwood: | 11.6% (1,421) |
| Washington: | 8.9% (248,462) |
7am:
| Picnic Point-North Lynnwood: | 9.4% (1,150) |
| Washington: | 10.3% (288,005) |
7:30am:
| Picnic Point-North Lynnwood: | 14.7% (1,807) |
| Washington: | 13.5% (375,030) |
8am:
| Picnic Point-North Lynnwood: | 10.8% (1,319) |
| Washington: | 13.4% (372,576) |
8:30am:
| Picnic Point-North Lynnwood: | 8.1% (993) |
| Washington: | 9.0% (252,058) |
9am:
| Picnic Point-North Lynnwood: | 5.0% (612) |
| Washington: | 5.1% (141,936) |
10am:
| Picnic Point-North Lynnwood: | 6.3% (769) |
| Washington: | 5.8% (161,204) |
11am:
| Picnic Point-North Lynnwood: | 2.9% (354) |
| Washington: | 2.5% (70,123) |
12pm:
| Picnic Point-North Lynnwood: | 1.3% (162) |
| Washington: | 1.3% (35,612) |
4pm:
| Picnic Point-North Lynnwood: | 7.8% (957) |
| Washington: | 6.8% (190,565) |
>4pm:
| Picnic Point-North Lynnwood: | 5.5% (679) |
| Washington: | 5.8% (162,401) |
Travel time to work
Daytime population change due to commuting: -9,816 (-42.8%)
Workers who live and work in this place: 780 (6.4%)
Workers who live and work in this place: 780 (6.4%)


Less than 5 minutes:
| Picnic Point-North Lynnwood: | 1.3% (165) |
| Washington: | 3.3% (91,132) |
5 to 9 minutes:
| Picnic Point-North Lynnwood: | 7.3% (895) |
| Washington: | 10.3% (286,517) |
10 to 14 minutes:
| Picnic Point-North Lynnwood: | 10.7% (1,313) |
| Washington: | 14.1% (391,606) |
15 to 19 minutes:
| Picnic Point-North Lynnwood: | 13.3% (1,636) |
| Washington: | 15.0% (418,990) |
20 to 24 minutes:
| Picnic Point-North Lynnwood: | 12.0% (1,476) |
| Washington: | 14.2% (394,209) |
25 to 29 minutes:
| Picnic Point-North Lynnwood: | 4.7% (574) |
| Washington: | 5.8% (162,590) |
30 to 34 minutes:
| Picnic Point-North Lynnwood: | 13.8% (1,692) |
| Washington: | 12.5% (348,311) |
35 to 39 minutes:
| Picnic Point-North Lynnwood: | 3.6% (445) |
| Washington: | 2.6% (73,592) |
40 to 44 minutes:
| Picnic Point-North Lynnwood: | 6.3% (772) |
| Washington: | 3.4% (95,182) |
45 to 59 minutes:
| Picnic Point-North Lynnwood: | 14.3% (1,749) |
| Washington: | 7.0% (195,343) |
60 to 89 minutes:
| Picnic Point-North Lynnwood: | 7.6% (934) |
| Washington: | 4.7% (131,691) |
90 or more minutes:
| Picnic Point-North Lynnwood: | 1.5% (184) |
| Washington: | 2.7% (75,486) |
Means of transportation to work


Drove car alone:
| Picnic Point-North Lynnwood: | 73.6% (9,033) |
| Washington: | 73.3% (2,040,833) |
Carpooled:
| Picnic Point-North Lynnwood: | 14.4% (1,770) |
| Washington: | 12.8% (357,742) |
Bus or trolley bus:
| Picnic Point-North Lynnwood: | 6.5% (794) |
| Washington: | 4.5% (124,450) |
Bicycle:
| Picnic Point-North Lynnwood: | 0.1% (14) |
| Washington: | 0.6% (16,205) |
Walked:
| Picnic Point-North Lynnwood: | 1.3% (159) |
| Washington: | 3.2% (89,739) |
Other means:
| Picnic Point-North Lynnwood: | 0.5% (65) |
| Washington: | 0.7% (19,499) |
Private vehicle occupancy

Drove alone:
| Picnic Point-North Lynnwood: | 83.6% (9,033) |
| Washington: | 85.1% (2,040,833) |
In 2 person carpool:
| Picnic Point-North Lynnwood: | 13.4% (1,452) |
| Washington: | 11.8% (282,638) |
In 3 person carpool:
| Picnic Point-North Lynnwood: | 1.8% (190) |
| Washington: | 1.9% (44,791) |
In 4 person carpool:
| Picnic Point-North Lynnwood: | 0.8% (82) |
| Washington: | 0.6% (14,195) |
In 5-6 person carpool:
| Picnic Point-North Lynnwood: | 0.3% (28) |
| Washington: | 0.3% (7,914) |
In 7+ person carpool:
| Picnic Point-North Lynnwood: | 0.2% (18) |
| Washington: | 0.3% (8,204) |
Class of workers
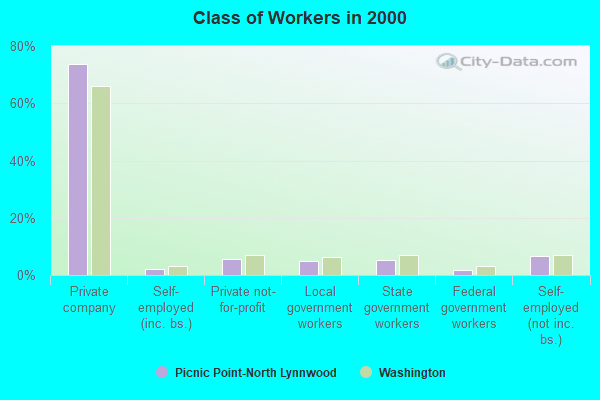
Employee of private company:
| Picnic Point-North Lynnwood: | 73.7% (9,194) |
| Washington: | 66.0% (1,843,000) |
Self-employed in own incorporated business:
| Picnic Point-North Lynnwood: | 2.0% (252) |
| Washington: | 3.2% (90,102) |
Private not-for-profit wage and salary workers:
| Picnic Point-North Lynnwood: | 5.6% (697) |
| Washington: | 6.9% (191,927) |
Local government workers:
| Picnic Point-North Lynnwood: | 5.0% (621) |
| Washington: | 6.4% (178,161) |
State government workers:
| Picnic Point-North Lynnwood: | 5.2% (648) |
| Washington: | 6.9% (192,408) |
Federal government workers:
| Picnic Point-North Lynnwood: | 1.8% (219) |
| Washington: | 3.2% (89,153) |
Self-employed workers in own not incorporated business:
| Picnic Point-North Lynnwood: | 6.7% (839) |
| Washington: | 7.2% (199,827) |
Unpaid family workers:
| Picnic Point-North Lynnwood: | 0.1% (10) |
| Washington: | 0.3% (9,144) |

Employee of private company - Males:
| Picnic Point-North Lynnwood: | 75.2% (5,027) |
| Washington: | 69.7% (1,044,674) |
Self-employed in own incorporated business - Males:
| Picnic Point-North Lynnwood: | 3.2% (216) |
| Washington: | 4.3% (64,169) |
Private not-for-profit wage and salary workers - Males:
| Picnic Point-North Lynnwood: | 3.2% (211) |
| Washington: | 4.2% (63,257) |
Local government workers - Males:
| Picnic Point-North Lynnwood: | 4.4% (295) |
| Washington: | 5.3% (79,844) |
State government workers - Males:
| Picnic Point-North Lynnwood: | 4.2% (280) |
| Washington: | 5.1% (76,834) |
Federal government workers - Males:
| Picnic Point-North Lynnwood: | 2.5% (167) |
| Washington: | 3.5% (52,763) |
Self-employed workers in own not incorporated business - Males:
| Picnic Point-North Lynnwood: | 7.3% (487) |
| Washington: | 7.6% (114,199) |

Employee of private company - Females:
| Picnic Point-North Lynnwood: | 71.9% (4,167) |
| Washington: | 61.7% (798,326) |
Self-employed in own incorporated business - Females:
| Picnic Point-North Lynnwood: | 0.6% (36) |
| Washington: | 2.0% (25,933) |
Private not-for-profit wage and salary workers - Females:
| Picnic Point-North Lynnwood: | 8.4% (486) |
| Washington: | 9.9% (128,670) |
Local government workers - Females:
| Picnic Point-North Lynnwood: | 5.6% (326) |
| Washington: | 7.6% (98,317) |
State government workers - Females:
| Picnic Point-North Lynnwood: | 6.3% (368) |
| Washington: | 8.9% (115,574) |
Federal government workers - Females:
| Picnic Point-North Lynnwood: | 0.9% (52) |
| Washington: | 2.8% (36,390) |
Self-employed workers in own not incorporated business - Females:
| Picnic Point-North Lynnwood: | 6.1% (352) |
| Washington: | 6.6% (85,628) |
Unpaid family workers - Females:
| Picnic Point-North Lynnwood: | 0.2% (10) |
| Washington: | 0.4% (5,255) |