Work and Jobs in Portsmouth, Virginia (VA) Detailed Stats
Occupations, Industries, Unemployment, Workers, Commute
Settings
X


Recent posts about work in Portsmouth, Virginia on our local forum with over 2,400,000 registered users:

Latest news about work in Portsmouth, VA collected exclusively by city-data.com from local newspapers, TV, and radio stations
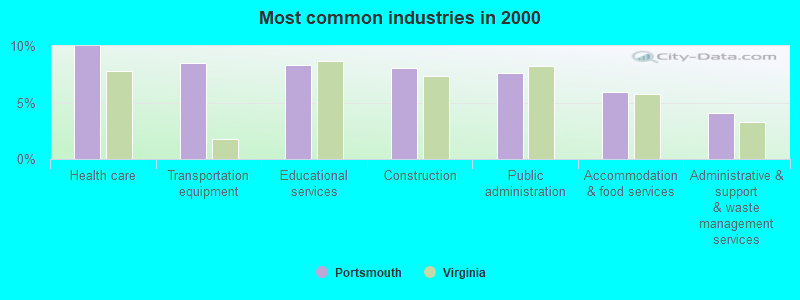
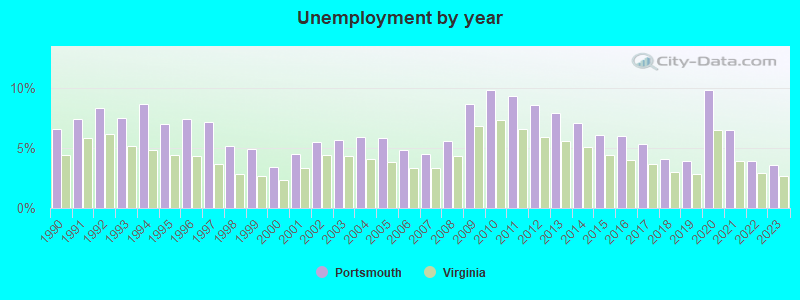
The unemployment rate in 2023 in Portsmouth, VA was 3.6%, which was 25.0% greater than the unemployment rate of 2.7% across the entire state of Virginia. Compared to the unemployment rate of 7.9% in 2013, this represents a decrease of 119.4%. The most common industries in Portsmouth are: Health care (10.0% of civilian employees), Transportation equipment (8.5% of civilian employees), Educational services (8.3% of civilian employees). 42.4% of workers work in Portsmouth city County and 6.6% of all workers work at home. 68.6% of workers are employees of private companies, which is 9.1% greater than the rate of 62.3% across the entire state of Virginia.
Whole page based on the data from 2000 / 2022 when the population of Portsmouth, Virginia was 100,565 / 97,029
Whole page based on the data from 2000 / 2022 when the population of Portsmouth, Virginia was 100,565 / 97,029
Most common industries
Most common industries | |||
|---|---|---|---|
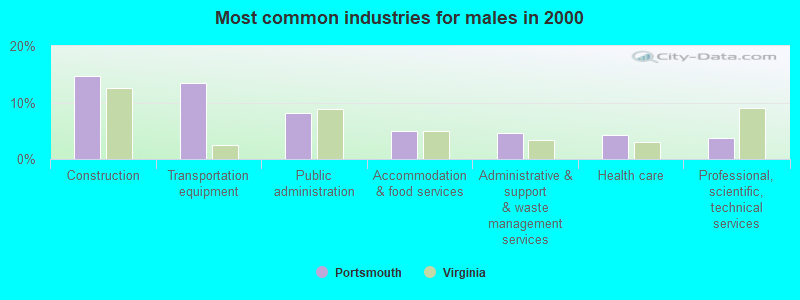
Industry | All | Males | Females |
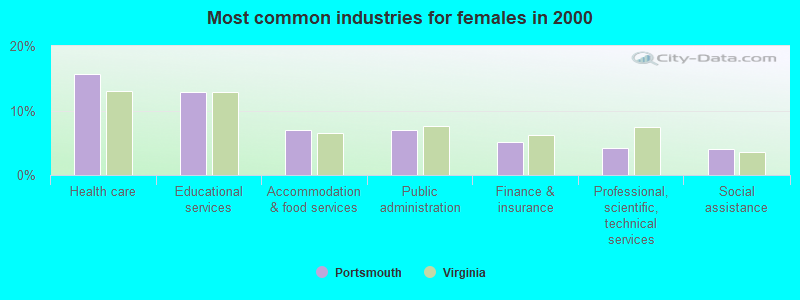
| Health care | 10.0% (4,035) | 4.2% (841) | 15.6% (3,194) |
| Transportation equipment | 8.5% (3,442) | 13.5% (2,683) | 3.7% (759) |
| Educational services | 8.3% (3,366) | 3.6% (715) | 12.9% (2,651) |
| Construction | 8.1% (3,257) | 14.7% (2,918) | 1.7% (339) |
| Public administration | 7.6% (3,061) | 8.2% (1,634) | 7.0% (1,427) |
| Accommodation and food services | 6.0% (2,402) | 4.9% (971) | 7.0% (1,431) |
| Administrative and support and waste management services | 4.1% (1,656) | 4.6% (918) | 3.6% (738) |
| Professional, scientific, and technical services | 4.0% (1,597) | 3.8% (750) | 4.1% (847) |
| Finance and insurance | 3.4% (1,362) | 1.6% (315) | 5.1% (1,047) |
| Food and beverage stores | 2.7% (1,074) | 2.4% (467) | 3.0% (607) |
| Personal and laundry services | 2.5% (994) | 1.4% (286) | 3.5% (708) |
| Department and other general merchandise stores | 2.4% (962) | 1.5% (300) | 3.2% (662) |
| Social assistance | 2.3% (938) | 0.6% (126) | 4.0% (812) |
| Real estate and rental and leasing | 1.8% (734) | 1.4% (288) | 2.2% (446) |
| Religious, grantmaking, civic, professional, and similar organizations | 1.8% (718) | 1.4% (283) | 2.1% (435) |
| Other transportation, and support activities, and couriers | 1.7% (689) | 2.1% (408) | 1.4% (281) |
| Repair and maintenance | 1.7% (682) | 2.7% (546) | 0.7% (136) |
| Food | 1.6% (652) | 1.8% (367) | 1.4% (285) |
| Broadcasting and telecommunications | 1.4% (584) | 1.4% (288) | 1.4% (296) |
| Motor vehicle and parts dealers | 1.2% (477) | 1.9% (374) | 0.5% (103) |
| Arts, entertainment, and recreation | 1.2% (473) | 1.2% (237) | 1.2% (236) |
| Truck transportation | 1.1% (445) | 1.9% (369) | 0.4% (76) |
| Publishing, and motion picture and sound recording industries | 0.8% (323) | 0.9% (170) | 0.7% (153) |
| Other direct selling establishments | 0.8% (319) | 0.6% (112) | 1.0% (207) |
| Building material and garden equipment and supplies dealers | 0.7% (279) | 1.0% (192) | 0.4% (87) |
| Utilities | 0.7% (264) | 1.1% (219) | 0.2% (45) |
| Chemicals | 0.6% (257) | 1.0% (208) | 0.2% (49) |
| Groceries and related products merchant wholesalers | 0.6% (248) | 1.0% (196) | 0.3% (52) |
| Clothing and accessories, including shoe, stores | 0.6% (235) | 0.2% (40) | 1.0% (195) |
| Pharmacies and drug stores | 0.6% (229) | 0.2% (37) | 0.9% (192) |
| Miscellaneous manufacturing | 0.6% (228) | 0.7% (143) | 0.4% (85) |
| Used merchandise, gift, novelty, and souvenir, and other miscellaneous stores | 0.5% (220) | 0.3% (67) | 0.7% (153) |
| U. S. Postal service | 0.5% (218) | 0.6% (115) | 0.5% (103) |
| Electronic shopping and mail-order houses | 0.5% (206) | 0.3% (54) | 0.7% (152) |
| Water transportation | 0.5% (193) | 0.7% (149) | 0.2% (44) |
| Machinery | 0.4% (181) | 0.8% (160) | 0.1% (21) |
| Warehousing and storage | 0.4% (176) | 0.5% (102) | 0.4% (74) |
| Computer and electronic products | 0.4% (168) | 0.5% (107) | 0.3% (61) |
| Miscellaneous nondurable goods merchant wholesalers | 0.4% (167) | 0.4% (76) | 0.4% (91) |
| Gasoline stations | 0.4% (165) | 0.3% (68) | 0.5% (97) |
| Machinery, equipment, and supplies merchant wholesalers | 0.4% (163) | 0.6% (121) | 0.2% (42) |
| Radio, TV, and computer stores | 0.4% (160) | 0.5% (109) | 0.2% (51) |
| Data processing, libraries, and other information services | 0.4% (160) | 0.3% (63) | 0.5% (97) |
| Metal and metal products | 0.4% (158) | 0.8% (151) | 0.0% (7) |
| Furniture and home furnishings, and household appliance stores | 0.4% (157) | 0.5% (102) | 0.3% (55) |
| Agriculture, forestry, fishing and hunting | 0.3% (135) | 0.5% (94) | 0.2% (41) |
| Private households | 0.2% (100) | 0.0% (5) | 0.5% (95) |
| Electrical and electronic goods merchant wholesalers | 0.2% (99) | 0.2% (48) | 0.2% (51) |
| Motor vehicles, parts and supplies merchant wholesalers | 0.2% (98) | 0.4% (71) | 0.1% (27) |
| Nonmetallic mineral products | 0.2% (96) | 0.4% (71) | 0.1% (25) |
| Plastics and rubber products | 0.2% (85) | 0.2% (33) | 0.3% (52) |
| Textile mills and textile products | 0.2% (80) | 0.1% (27) | 0.3% (53) |
| Printing and related support activities | 0.2% (69) | 0.1% (20) | 0.2% (49) |
| Hardware, plumbing and heating equipment, and supplies merchant wholesalers | 0.2% (64) | 0.2% (35) | 0.1% (29) |
| Drugs, sundries, and chemical and allied products merchant wholesalers | 0.2% (62) | 0.2% (30) | 0.2% (32) |
| Rail transportation | 0.1% (60) | 0.3% (54) | 0.0% (6) |
| Retail florists | 0.1% (57) | 0.0% (0) | 0.3% (57) |
| Petroleum and petroleum products merchant wholesalers | 0.1% (53) | 0.2% (46) | 0.0% (7) |
| Paper and paper products merchant wholesalers | 0.1% (48) | 0.2% (30) | 0.1% (18) |
| Office supplies and stationery stores | 0.1% (47) | 0.1% (24) | 0.1% (23) |
| Paper | 0.1% (46) | 0.2% (34) | 0.1% (12) |
| Professional and commercial equipment and supplies merchant wholesalers | 0.1% (44) | 0.1% (28) | 0.1% (16) |
| Health and personal care, except drug, stores | 0.1% (42) | 0.1% (22) | 0.1% (20) |
| Jewelry, luggage, and leather goods stores | 0.1% (41) | 0.1% (28) | 0.1% (13) |
| Electrical equipment, appliances, and components | 0.1% (41) | 0.1% (22) | 0.1% (19) |
| Wood products | 0.1% (40) | 0.2% (40) | 0.0% (0) |
| Alcoholic beverages merchant wholesalers | 0.1% (36) | 0.2% (36) | 0.0% (0) |
| Recyclable material merchant wholesalers | 0.1% (35) | 0.2% (35) | 0.0% (0) |
| Furniture and home furnishing merchant wholesalers | 0.1% (34) | 0.1% (28) | 0.0% (6) |
| Beverage and tobacco products | 0.1% (31) | 0.1% (25) | 0.0% (6) |
Unemployment in Portsmouth
- Unemployment by race in 2022
- Unemployment rate for White non-Hispanic residents
- 4.1%Males
- 6.7%Females
- Unemployment rate for Black residents
- 19.4%Males
- 6.2%Females
- Unemployment rate for American Indian and Alaska Native residents
- 73.8%Females
- Unemployment rate for Asian residents
- 3.6%Females
- Unemployment rate for other race residents
- 18.9%Females
- Unemployment rate for two or more race residents
- 2.4%Males
- 2.6%Females
- Unemployment rate for Hispanic or Latino residents
- 9.6%Females
- Unemployment by race in 2000
- Unemployment rate for White non-Hispanic residents
- 4.1%Males
- 5.1%Females
- Unemployment rate for Black residents
- 11.6%Males
- 10.6%Females
- Unemployment rate for American Indian and Alaska Native residents
- 11.2%Males
- 11.8%Females
- Unemployment rate for Asian residents
- 11.9%Females
- Unemployment rate for other race residents
- 5.3%Males
- 9.6%Females
- Unemployment rate for two or more race residents
- 2.2%Females
- Unemployment rate for Hispanic or Latino residents
- 7.0%Males
- 8.6%Females
Unemployment in 2023:
| Portsmouth: | 3.6% |
| Virginia: | 2.7% |
Unemployment in 2022:
| Portsmouth: | 3.9% |
| Virginia: | 2.9% |
Unemployment in 2021:
| Portsmouth: | 6.5% |
| Virginia: | 3.9% |
Unemployment in 2020:
| Portsmouth: | 9.8% |
| Virginia: | 6.5% |
Unemployment in 2019:
| Portsmouth: | 3.9% |
| Virginia: | 2.8% |
Unemployment in 2018:
| Portsmouth: | 4.1% |
| Virginia: | 3.0% |
Unemployment in 2017:
| Portsmouth: | 5.3% |
| Virginia: | 3.7% |
Unemployment in 2016:
| Portsmouth: | 6.0% |
| Virginia: | 4.0% |
Unemployment in 2015:
| Portsmouth: | 6.1% |
| Virginia: | 4.4% |
Unemployment in 2014:
| Portsmouth: | 7.1% |
| Virginia: | 5.1% |
Unemployment in 2013:
| Portsmouth: | 7.9% |
| Virginia: | 5.6% |
Unemployment in 2012:
| Portsmouth: | 8.6% |
| Virginia: | 5.9% |
Unemployment in 2011:
| Portsmouth: | 9.3% |
| Virginia: | 6.6% |
Unemployment in 2010:
| Portsmouth: | 9.8% |
| Virginia: | 7.3% |
Unemployment in 2009:
| Portsmouth: | 8.7% |
| Virginia: | 6.8% |
Unemployment in 2008:
| Portsmouth: | 5.6% |
| Virginia: | 4.3% |
Unemployment in 2007:
| Portsmouth: | 4.5% |
| Virginia: | 3.3% |
Unemployment in 2006:
| Portsmouth: | 4.8% |
| Virginia: | 3.3% |
Unemployment in 2005:
| Portsmouth: | 5.8% |
| Virginia: | 3.8% |
Unemployment in 2004:
| Portsmouth: | 5.9% |
| Virginia: | 4.1% |
Unemployment in 2003:
| Portsmouth: | 5.7% |
| Virginia: | 4.3% |
Unemployment in 2002:
| Portsmouth: | 5.5% |
| Virginia: | 4.4% |
Unemployment in 2001:
| Portsmouth: | 4.5% |
| Virginia: | 3.3% |
Unemployment in 2000:
| Portsmouth: | 3.4% |
| Virginia: | 2.3% |
Unemployment in 1999:
| Portsmouth: | 4.9% |
| Virginia: | 2.7% |
Unemployment in 1998:
| Portsmouth: | 5.2% |
| Virginia: | 2.8% |
Unemployment in 1997:
| Portsmouth: | 7.2% |
| Virginia: | 3.7% |
Unemployment in 1996:
| Portsmouth: | 7.4% |
| Virginia: | 4.3% |
Unemployment in 1995:
| Portsmouth: | 7.0% |
| Virginia: | 4.4% |
Unemployment in 1994:
| Portsmouth: | 8.7% |
| Virginia: | 4.8% |
Unemployment in 1993:
| Portsmouth: | 7.5% |
| Virginia: | 5.2% |
Unemployment in 1992:
| Portsmouth: | 8.3% |
| Virginia: | 6.2% |
Unemployment in 1991:
| Portsmouth: | 7.4% |
| Virginia: | 5.8% |
Unemployment in 1990:
| Portsmouth: | 6.6% |
| Virginia: | 4.4% |
Time leaving home to go to work
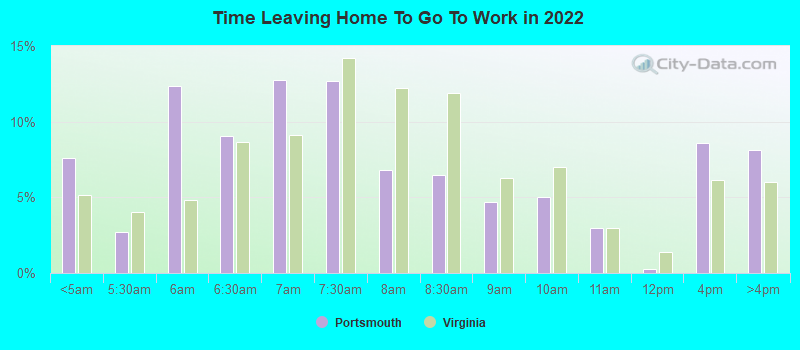
12:00 a.m. to 4:59 a.m.:
| Portsmouth: | 7.6% (3,076) |
| Virginia: | 5.2% (184,150) |
5:00 a.m. to 5:29 a.m.:
| Portsmouth: | 2.7% (1,098) |
| Virginia: | 4.0% (143,834) |
5:30 a.m. to 5:59 a.m.:
| Portsmouth: | 12.3% (5,016) |
| Virginia: | 4.8% (170,996) |
6:00 a.m. to 6:29 a.m.:
| Portsmouth: | 9.0% (3,670) |
| Virginia: | 8.6% (307,598) |
6:30 a.m. to 6:59 a.m.:
| Portsmouth: | 12.8% (5,181) |
| Virginia: | 9.1% (324,323) |
7:00 a.m. to 7:29 a.m.:
| Portsmouth: | 12.7% (5,150) |
| Virginia: | 14.2% (504,796) |
7:30 a.m. to 7:59 a.m.:
| Portsmouth: | 6.8% (2,773) |
| Virginia: | 12.3% (436,196) |
8:00 a.m. to 8:29 a.m.:
| Portsmouth: | 6.5% (2,627) |
| Virginia: | 11.9% (422,834) |
8:30 a.m. to 8:59 a.m.:
| Portsmouth: | 4.7% (1,909) |
| Virginia: | 6.3% (224,568) |
9:00 a.m. to 9:59 a.m.:
| Portsmouth: | 5.0% (2,037) |
| Virginia: | 7.0% (250,122) |
10:00 a.m. to 10:59 a.m.:
| Portsmouth: | 2.9% (1,197) |
| Virginia: | 3.0% (105,732) |
11:00 a.m. to 11:59 a.m.:
| Portsmouth: | 0.3% (105) |
| Virginia: | 1.4% (50,363) |
12:00 p.m. to 3:59 p.m.:
| Portsmouth: | 8.6% (3,482) |
| Virginia: | 6.2% (219,709) |
4:00 p.m. to 11:59 p.m.:
| Portsmouth: | 8.2% (3,314) |
| Virginia: | 6.0% (214,315) |

<5am:
| Portsmouth: | 3.3% (1,438) |
| Virginia: | 3.0% (106,117) |
5:30am:
| Portsmouth: | 3.6% (1,583) |
| Virginia: | 3.0% (104,536) |
6am:
| Portsmouth: | 5.9% (2,609) |
| Virginia: | 4.6% (160,804) |
6:30am:
| Portsmouth: | 10.7% (4,721) |
| Virginia: | 9.1% (316,895) |
7am:
| Portsmouth: | 13.9% (6,105) |
| Virginia: | 10.7% (372,448) |
7:30am:
| Portsmouth: | 13.3% (5,844) |
| Virginia: | 14.1% (491,661) |
8am:
| Portsmouth: | 13.1% (5,732) |
| Virginia: | 15.1% (526,342) |
8:30am:
| Portsmouth: | 8.0% (3,511) |
| Virginia: | 11.5% (399,738) |
9am:
| Portsmouth: | 5.1% (2,239) |
| Virginia: | 5.8% (200,280) |
10am:
| Portsmouth: | 4.0% (1,764) |
| Virginia: | 5.5% (190,998) |
11am:
| Portsmouth: | 2.0% (885) |
| Virginia: | 2.0% (69,788) |
12pm:
| Portsmouth: | 0.9% (410) |
| Virginia: | 0.9% (31,327) |
4pm:
| Portsmouth: | 6.8% (2,985) |
| Virginia: | 5.6% (196,554) |
>4pm:
| Portsmouth: | 6.6% (2,896) |
| Virginia: | 5.9% (204,265) |

12:00 a.m. to 4:59 a.m. - Males:
| Portsmouth: | 8.7% (1,825) |
| Virginia: | 6.8% (129,709) |
5:00 a.m. to 5:29 a.m. - Males:
| Portsmouth: | 2.7% (560) |
| Virginia: | 5.3% (101,619) |
5:30 a.m. to 5:59 a.m. - Males:
| Portsmouth: | 17.3% (3,627) |
| Virginia: | 5.9% (112,784) |
6:00 a.m. to 6:29 a.m. - Males:
| Portsmouth: | 8.5% (1,791) |
| Virginia: | 10.0% (191,463) |
6:30 a.m. to 6:59 a.m. - Males:
| Portsmouth: | 17.9% (3,741) |
| Virginia: | 9.5% (182,672) |
7:00 a.m. to 7:29 a.m. - Males:
| Portsmouth: | 15.5% (3,246) |
| Virginia: | 13.8% (264,728) |
7:30 a.m. to 7:59 a.m. - Males:
| Portsmouth: | 6.9% (1,437) |
| Virginia: | 10.4% (198,372) |
8:00 a.m. to 8:29 a.m. - Males:
| Portsmouth: | 3.1% (646) |
| Virginia: | 10.6% (202,530) |
8:30 a.m. to 8:59 a.m. - Males:
| Portsmouth: | 1.3% (274) |
| Virginia: | 5.5% (105,302) |
9:00 a.m. to 9:59 a.m. - Males:
| Portsmouth: | 1.9% (391) |
| Virginia: | 6.3% (120,452) |
10:00 a.m. to 10:59 a.m. - Males:
| Portsmouth: | 2.5% (534) |
| Virginia: | 2.6% (49,141) |
11:00 a.m. to 11:59 a.m. - Males:
| Portsmouth: | 0.5% (98) |
| Virginia: | 1.3% (24,562) |
12:00 p.m. to 3:59 p.m. - Males:
| Portsmouth: | 4.9% (1,030) |
| Virginia: | 6.0% (115,691) |
4:00 p.m. to 11:59 p.m. - Males:
| Portsmouth: | 8.3% (1,749) |
| Virginia: | 6.1% (116,029) |

12:00 a.m. to 4:59 a.m. - Females:
| Portsmouth: | 6.4% (1,251) |
| Virginia: | 3.3% (54,441) |
5:00 a.m. to 5:29 a.m. - Females:
| Portsmouth: | 2.7% (538) |
| Virginia: | 2.6% (42,215) |
5:30 a.m. to 5:59 a.m. - Females:
| Portsmouth: | 7.1% (1,389) |
| Virginia: | 3.5% (58,212) |
6:00 a.m. to 6:29 a.m. - Females:
| Portsmouth: | 9.5% (1,879) |
| Virginia: | 7.1% (116,135) |
6:30 a.m. to 6:59 a.m. - Females:
| Portsmouth: | 7.3% (1,440) |
| Virginia: | 8.6% (141,651) |
7:00 a.m. to 7:29 a.m. - Females:
| Portsmouth: | 9.7% (1,904) |
| Virginia: | 14.6% (240,068) |
7:30 a.m. to 7:59 a.m. - Females:
| Portsmouth: | 6.8% (1,336) |
| Virginia: | 14.5% (237,824) |
8:00 a.m. to 8:29 a.m. - Females:
| Portsmouth: | 10.1% (1,981) |
| Virginia: | 13.4% (220,304) |
8:30 a.m. to 8:59 a.m. - Females:
| Portsmouth: | 8.3% (1,635) |
| Virginia: | 7.3% (119,266) |
9:00 a.m. to 9:59 a.m. - Females:
| Portsmouth: | 8.4% (1,646) |
| Virginia: | 7.9% (129,670) |
10:00 a.m. to 10:59 a.m. - Females:
| Portsmouth: | 3.4% (663) |
| Virginia: | 3.4% (56,591) |
11:00 a.m. to 11:59 a.m. - Females:
| Portsmouth: | 0.0% (7) |
| Virginia: | 1.6% (25,801) |
12:00 p.m. to 3:59 p.m. - Females:
| Portsmouth: | 12.5% (2,452) |
| Virginia: | 6.3% (104,018) |
4:00 p.m. to 11:59 p.m. - Females:
| Portsmouth: | 7.9% (1,565) |
| Virginia: | 6.0% (98,286) |
Travel time to work
Percentage of workers working in this county: 42.4%
Number of people working at home: 3,014 (6.6% of all workers)
Daytime population change due to commuting: +5,947 (+5.9%)
Workers who live and work in this city: 19,875 (45.3%)
Number of people working at home: 3,014 (6.6% of all workers)
Daytime population change due to commuting: +5,947 (+5.9%)
Workers who live and work in this city: 19,875 (45.3%)

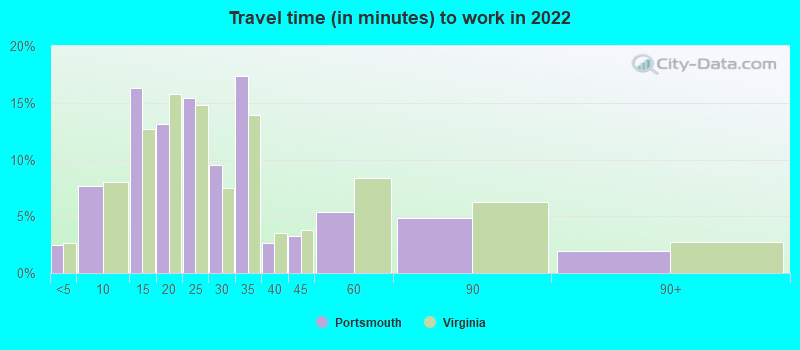

Less than 5 minutes:
| Portsmouth: | 2.4% (1,186) |
| Virginia: | 2.6% (93,024) |
5 to 9 minutes:
| Portsmouth: | 7.7% (3,763) |
| Virginia: | 8.0% (284,014) |
10 to 14 minutes:
| Portsmouth: | 16.3% (7,960) |
| Virginia: | 12.7% (449,774) |
15 to 19 minutes:
| Portsmouth: | 13.1% (6,407) |
| Virginia: | 15.7% (557,327) |
20 to 24 minutes:
| Portsmouth: | 15.4% (7,514) |
| Virginia: | 14.8% (523,186) |
25 to 29 minutes:
| Portsmouth: | 9.5% (4,649) |
| Virginia: | 7.5% (263,994) |
30 to 34 minutes:
| Portsmouth: | 17.4% (8,489) |
| Virginia: | 14.0% (494,374) |
35 to 39 minutes:
| Portsmouth: | 2.7% (1,305) |
| Virginia: | 3.6% (125,916) |
40 to 44 minutes:
| Portsmouth: | 3.3% (1,605) |
| Virginia: | 3.8% (133,560) |
45 to 59 minutes:
| Portsmouth: | 5.4% (2,615) |
| Virginia: | 8.4% (297,802) |
60 to 89 minutes:
| Portsmouth: | 4.9% (2,379) |
| Virginia: | 6.2% (220,533) |
90 or more minutes:
| Portsmouth: | 2.0% (962) |
| Virginia: | 2.8% (97,883) |


Less than 5 minutes:
| Portsmouth: | 1.8% (787) |
| Virginia: | 2.4% (85,207) |
5 to 9 minutes:
| Portsmouth: | 9.0% (3,957) |
| Virginia: | 8.5% (296,082) |
10 to 14 minutes:
| Portsmouth: | 14.3% (6,300) |
| Virginia: | 12.9% (448,126) |
15 to 19 minutes:
| Portsmouth: | 18.8% (8,260) |
| Virginia: | 15.2% (530,128) |
20 to 24 minutes:
| Portsmouth: | 17.0% (7,455) |
| Virginia: | 14.7% (513,490) |
25 to 29 minutes:
| Portsmouth: | 6.9% (3,014) |
| Virginia: | 6.2% (217,273) |
30 to 34 minutes:
| Portsmouth: | 16.2% (7,101) |
| Virginia: | 13.7% (478,666) |
35 to 39 minutes:
| Portsmouth: | 1.9% (846) |
| Virginia: | 3.0% (103,937) |
40 to 44 minutes:
| Portsmouth: | 2.1% (922) |
| Virginia: | 3.7% (127,218) |
45 to 59 minutes:
| Portsmouth: | 4.8% (2,092) |
| Virginia: | 8.3% (289,734) |
60 to 89 minutes:
| Portsmouth: | 2.4% (1,065) |
| Virginia: | 5.4% (189,384) |
90 or more minutes:
| Portsmouth: | 2.1% (923) |
| Virginia: | 2.7% (92,508) |

Less than 5 minutes - Males:
| Portsmouth: | 1.0% (284) |
| Virginia: | 2.7% (52,098) |
5 to 9 minutes - Males:
| Portsmouth: | 7.2% (2,050) |
| Virginia: | 7.0% (134,006) |
10 to 14 minutes - Males:
| Portsmouth: | 11.3% (3,204) |
| Virginia: | 11.7% (224,187) |
15 to 19 minutes - Males:
| Portsmouth: | 13.7% (3,878) |
| Virginia: | 14.6% (279,430) |
20 to 24 minutes - Males:
| Portsmouth: | 13.5% (3,837) |
| Virginia: | 14.0% (266,775) |
25 to 29 minutes - Males:
| Portsmouth: | 11.2% (3,177) |
| Virginia: | 7.3% (139,817) |
30 to 34 minutes - Males:
| Portsmouth: | 19.6% (5,561) |
| Virginia: | 14.4% (275,584) |
35 to 39 minutes - Males:
| Portsmouth: | 2.9% (817) |
| Virginia: | 3.7% (70,120) |
40 to 44 minutes - Males:
| Portsmouth: | 4.6% (1,291) |
| Virginia: | 4.2% (80,117) |
45 to 59 minutes - Males:
| Portsmouth: | 6.2% (1,765) |
| Virginia: | 9.5% (180,831) |
60 to 89 minutes - Males:
| Portsmouth: | 6.6% (1,867) |
| Virginia: | 7.3% (139,940) |
90 or more minutes - Males:
| Portsmouth: | 2.1% (602) |
| Virginia: | 3.6% (67,986) |

Less than 5 minutes - Females:
| Portsmouth: | 4.4% (902) |
| Virginia: | 2.5% (40,926) |
5 to 9 minutes - Females:
| Portsmouth: | 8.4% (1,713) |
| Virginia: | 9.2% (150,008) |
10 to 14 minutes - Females:
| Portsmouth: | 23.2% (4,756) |
| Virginia: | 13.8% (225,587) |
15 to 19 minutes - Females:
| Portsmouth: | 12.3% (2,529) |
| Virginia: | 17.0% (277,897) |
20 to 24 minutes - Females:
| Portsmouth: | 17.9% (3,677) |
| Virginia: | 15.7% (256,411) |
25 to 29 minutes - Females:
| Portsmouth: | 7.2% (1,472) |
| Virginia: | 7.6% (124,177) |
30 to 34 minutes - Females:
| Portsmouth: | 14.3% (2,928) |
| Virginia: | 13.4% (218,790) |
35 to 39 minutes - Females:
| Portsmouth: | 2.4% (488) |
| Virginia: | 3.4% (55,796) |
40 to 44 minutes - Females:
| Portsmouth: | 1.5% (314) |
| Virginia: | 3.3% (53,443) |
45 to 59 minutes - Females:
| Portsmouth: | 4.1% (850) |
| Virginia: | 7.2% (116,971) |
60 to 89 minutes - Females:
| Portsmouth: | 2.5% (512) |
| Virginia: | 4.9% (80,593) |
90 or more minutes - Females:
| Portsmouth: | 1.8% (360) |
| Virginia: | 1.8% (29,897) |
Means of transportation to work
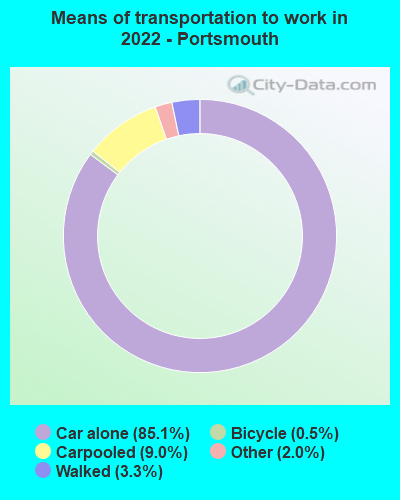
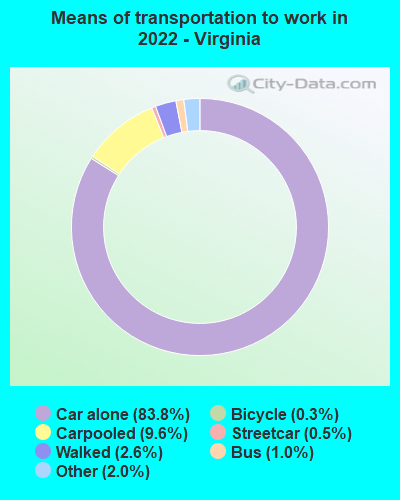
Drove car alone:
| Portsmouth: | 85.1% (41,568) |
| Virginia: | 83.8% (1,360,070) |
Carpooled:
| Portsmouth: | 9.0% (4,414) |
| Virginia: | 9.6% (170,169) |
Bus:
| Portsmouth: | 0.0% (13) |
| Virginia: | 1.0% (18,549) |
Bicycle:
| Portsmouth: | 0.5% (255) |
| Virginia: | 0.3% (3,241) |
Walked:
| Portsmouth: | 3.3% (1,621) |
| Virginia: | 2.6% (40,742) |
Other means:
| Portsmouth: | 2.0% (963) |
| Virginia: | 2.0% (29,530) |

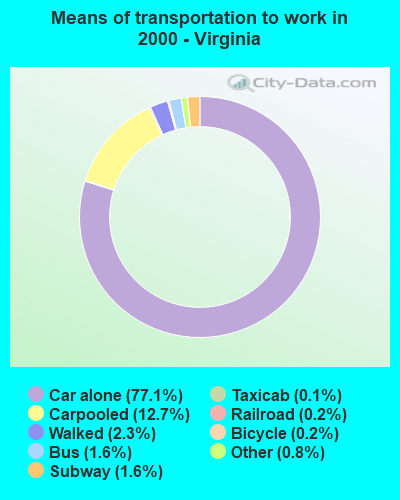
Drove car alone:
| Portsmouth: | 72.8% (31,996) |
| Virginia: | 77.1% (2,685,914) |
Carpooled:
| Portsmouth: | 15.6% (6,873) |
| Virginia: | 12.7% (441,093) |
Bus or trolley bus:
| Portsmouth: | 2.6% (1,141) |
| Virginia: | 1.6% (56,841) |
Streetcar or trolley car:
| Portsmouth: | 0.0% (13) |
| Virginia: | 0.0% (397) |
Subway or elevated:
| Portsmouth: | 0.0% (9) |
| Virginia: | 1.6% (56,225) |
Ferryboat:
| Portsmouth: | 0.1% (65) |
| Virginia: | 0.0% (336) |
Taxicab:
| Portsmouth: | 0.2% (73) |
| Virginia: | 0.1% (4,369) |
Motorcycle:
| Portsmouth: | 0.2% (71) |
| Virginia: | 0.1% (3,180) |
Bicycle:
| Portsmouth: | 0.6% (263) |
| Virginia: | 0.2% (7,930) |
Walked:
| Portsmouth: | 3.3% (1,438) |
| Virginia: | 2.3% (80,487) |
Other means:
| Portsmouth: | 1.8% (780) |
| Virginia: | 0.8% (28,983) |

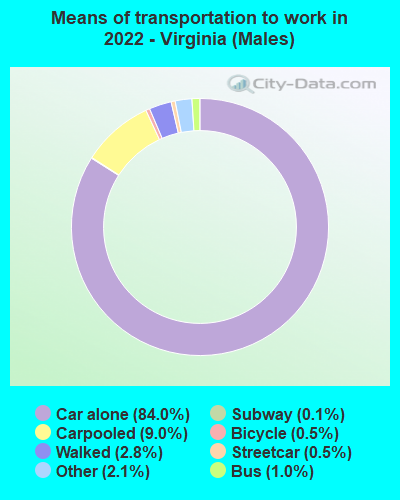
Drove car alone - Males:
| Portsmouth: | 85.2% (24,144) |
| Virginia: | 84.0% (1,360,070) |
Carpooled - Males:
| Portsmouth: | 8.6% (2,433) |
| Virginia: | 9.0% (170,169) |
Bus - Males:
| Portsmouth: | 0.0% (13) |
| Virginia: | 1.0% (18,549) |
Bicycle - Males:
| Portsmouth: | 0.9% (255) |
| Virginia: | 0.5% (3,241) |
Walked - Males:
| Portsmouth: | 3.7% (1,058) |
| Virginia: | 2.8% (40,742) |
Other means - Males:
| Portsmouth: | 1.5% (430) |
| Virginia: | 2.1% (29,530) |

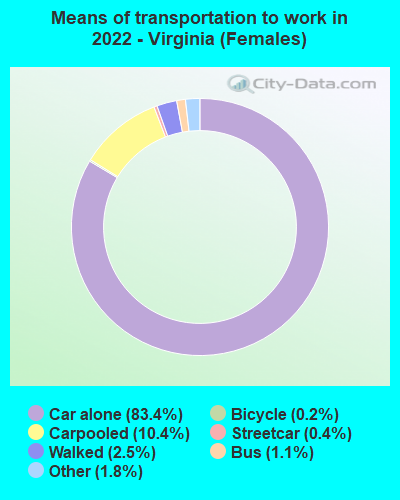
Drove car alone - Females:
| Portsmouth: | 85.0% (17,424) |
| Virginia: | 83.4% (1,360,070) |
Carpooled - Females:
| Portsmouth: | 9.7% (1,981) |
| Virginia: | 10.4% (170,169) |
Walked - Females:
| Portsmouth: | 2.7% (563) |
| Virginia: | 2.5% (40,742) |
Other means - Females:
| Portsmouth: | 2.6% (533) |
| Virginia: | 1.8% (29,530) |
Private vehicle occupancy

Drove alone:
| Portsmouth: | 87.8% (32,942) |
| Virginia: | 89.4% (2,955,039) |
In 2 person carpool:
| Portsmouth: | 9.4% (3,520) |
| Virginia: | 7.8% (259,148) |
In 3 person carpool:
| Portsmouth: | 1.4% (532) |
| Virginia: | 1.6% (53,429) |
In 4 person carpool:
| Portsmouth: | 0.2% (71) |
| Virginia: | 0.6% (18,657) |
In 5-6 person carpool:
| Portsmouth: | 0.8% (305) |
| Virginia: | 0.3% (11,523) |
In 7+ person carpool:
| Portsmouth: | 0.4% (151) |
| Virginia: | 0.2% (6,717) |

Drove alone:
| Portsmouth: | 82.3% (31,996) |
| Virginia: | 85.9% (2,685,914) |
In 2 person carpool:
| Portsmouth: | 14.2% (5,521) |
| Virginia: | 10.6% (329,961) |
In 3 person carpool:
| Portsmouth: | 2.1% (825) |
| Virginia: | 2.2% (69,338) |
In 4 person carpool:
| Portsmouth: | 0.8% (295) |
| Virginia: | 0.7% (22,849) |
In 5-6 person carpool:
| Portsmouth: | 0.3% (129) |
| Virginia: | 0.3% (10,110) |
In 7+ person carpool:
| Portsmouth: | 0.3% (103) |
| Virginia: | 0.3% (8,835) |
Class of workers
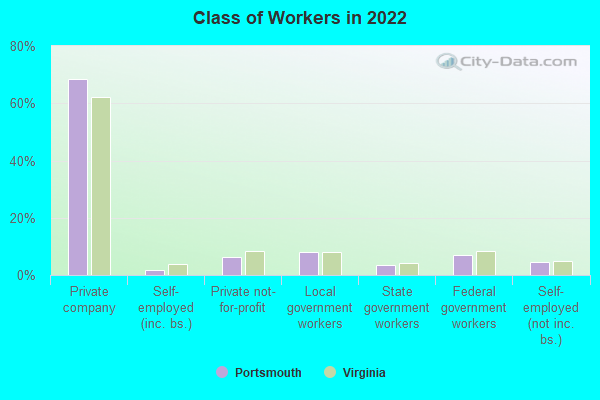
Employee of private company:
| Portsmouth: | 68.6% (28,048) |
| Virginia: | 62.3% (2,679,819) |
Self-employed in own incorporated business:
| Portsmouth: | 1.6% (659) |
| Virginia: | 3.7% (159,727) |
Private not-for-profit wage and salary workers:
| Portsmouth: | 6.4% (2,630) |
| Virginia: | 8.4% (359,054) |
Local government workers:
| Portsmouth: | 8.1% (3,307) |
| Virginia: | 8.1% (347,176) |
State government workers:
| Portsmouth: | 3.5% (1,425) |
| Virginia: | 4.1% (175,990) |
Federal government workers:
| Portsmouth: | 7.0% (2,871) |
| Virginia: | 8.3% (354,980) |
Self-employed workers in own not incorporated business:
| Portsmouth: | 4.6% (1,894) |
| Virginia: | 5.0% (216,243) |
Unpaid family workers:
| Portsmouth: | 0.2% (69) |
| Virginia: | 0.1% (5,572) |

Employee of private company:
| Portsmouth: | 61.2% (24,714) |
| Virginia: | 64.9% (2,214,133) |
Self-employed in own incorporated business:
| Portsmouth: | 2.0% (823) |
| Virginia: | 3.1% (105,080) |
Private not-for-profit wage and salary workers:
| Portsmouth: | 6.0% (2,432) |
| Virginia: | 6.7% (228,777) |
Local government workers:
| Portsmouth: | 10.6% (4,260) |
| Virginia: | 7.9% (268,029) |
State government workers:
| Portsmouth: | 3.6% (1,439) |
| Virginia: | 4.4% (149,085) |
Federal government workers:
| Portsmouth: | 12.2% (4,939) |
| Virginia: | 7.4% (251,461) |
Self-employed workers in own not incorporated business:
| Portsmouth: | 4.2% (1,702) |
| Virginia: | 5.5% (188,035) |
Unpaid family workers:
| Portsmouth: | 0.1% (44) |
| Virginia: | 0.2% (8,047) |

Employee of private company - Males:
| Portsmouth: | 72.2% (13,971) |
| Virginia: | 65.6% (1,465,158) |
Self-employed in own incorporated business - Males:
| Portsmouth: | 1.9% (371) |
| Virginia: | 4.6% (102,356) |
Private not-for-profit wage and salary workers - Males:
| Portsmouth: | 4.2% (808) |
| Virginia: | 5.7% (128,261) |
Local government workers - Males:
| Portsmouth: | 8.1% (1,577) |
| Virginia: | 5.5% (123,807) |
State government workers - Males:
| Portsmouth: | 3.3% (643) |
| Virginia: | 3.5% (78,080) |
Federal government workers - Males:
| Portsmouth: | 7.3% (1,417) |
| Virginia: | 9.2% (205,613) |
Self-employed workers in own not incorporated business - Males:
| Portsmouth: | 2.9% (569) |
| Virginia: | 5.6% (125,765) |

Employee of private company - Females:
| Portsmouth: | 65.3% (14,077) |
| Virginia: | 58.8% (1,214,661) |
Self-employed in own incorporated business - Females:
| Portsmouth: | 1.3% (288) |
| Virginia: | 2.8% (57,371) |
Private not-for-profit wage and salary workers - Females:
| Portsmouth: | 8.5% (1,822) |
| Virginia: | 11.2% (230,793) |
Local government workers - Females:
| Portsmouth: | 8.0% (1,730) |
| Virginia: | 10.8% (223,369) |
State government workers - Females:
| Portsmouth: | 3.6% (782) |
| Virginia: | 4.7% (97,910) |
Federal government workers - Females:
| Portsmouth: | 6.7% (1,454) |
| Virginia: | 7.2% (149,367) |
Self-employed workers in own not incorporated business - Females:
| Portsmouth: | 6.1% (1,325) |
| Virginia: | 4.4% (90,478) |
Unpaid family workers - Females:
| Portsmouth: | 0.3% (69) |
| Virginia: | 0.1% (2,668) |