Work and Jobs in Queens, New York (NY) Detailed Stats
Occupations, Industries, Unemployment, Workers, Commute
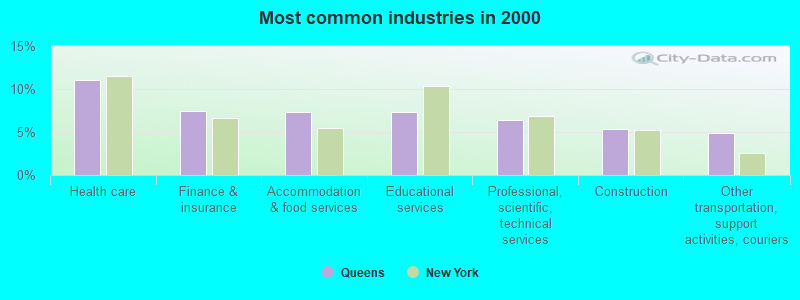
The most common industries in Queens are: Health care (11.0% of civilian employees), Finance & insurance (7.4% of civilian employees), Accommodation & food services (7.4% of civilian employees). 68.8% of workers are employees of private companies, which is 7.5% greater than the rate of 63.7% across the entire state of New York.
Most common industries
Most common industries | |||
|---|---|---|---|
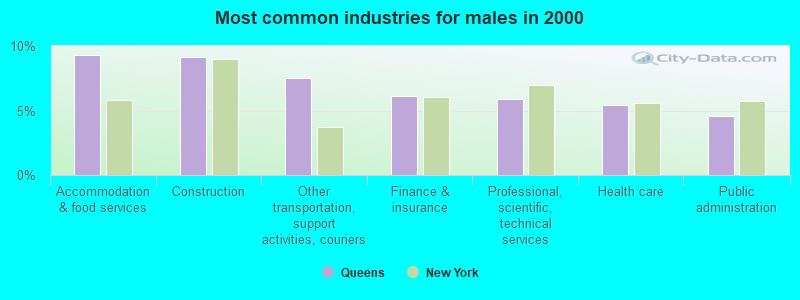
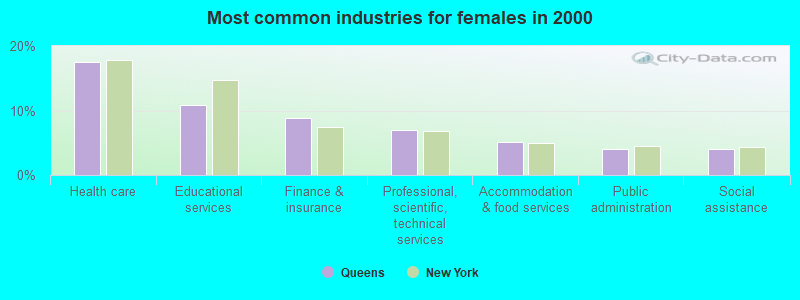
Industry | All | Males | Females |
| Health care | 11.0% (105,364) | 5.4% (27,700) | 17.5% (77,664) |
| Finance and insurance | 7.4% (70,785) | 6.1% (31,265) | 8.9% (39,520) |
| Accommodation and food services | 7.4% (70,391) | 9.3% (47,936) | 5.1% (22,455) |
| Educational services | 7.3% (69,757) | 4.2% (21,731) | 10.8% (48,026) |
| Professional, scientific, and technical services | 6.3% (60,749) | 5.9% (30,089) | 6.9% (30,660) |
| Construction | 5.4% (51,610) | 9.1% (46,826) | 1.1% (4,784) |
| Other transportation, and support activities, and couriers | 4.9% (46,549) | 7.5% (38,634) | 1.8% (7,915) |
| Public administration | 4.3% (41,372) | 4.5% (23,337) | 4.1% (18,035) |
| Administrative and support and waste management services | 3.7% (35,208) | 4.0% (20,300) | 3.4% (14,908) |
| Real estate and rental and leasing | 2.8% (27,069) | 3.5% (18,151) | 2.0% (8,918) |
| Personal and laundry services | 2.5% (23,622) | 2.1% (10,999) | 2.8% (12,623) |
| Food and beverage stores | 2.4% (22,831) | 3.0% (15,176) | 1.7% (7,655) |
| Social assistance | 2.3% (21,944) | 0.8% (4,131) | 4.0% (17,813) |
| Apparel | 1.9% (17,901) | 1.0% (4,886) | 2.9% (13,015) |
| Miscellaneous manufacturing | 1.7% (16,350) | 1.8% (9,185) | 1.6% (7,165) |
| Broadcasting and telecommunications | 1.7% (16,136) | 2.0% (10,097) | 1.4% (6,039) |
| Religious, grantmaking, civic, professional, and similar organizations | 1.6% (15,122) | 1.3% (6,452) | 2.0% (8,670) |
| Publishing, and motion picture and sound recording industries | 1.6% (14,942) | 1.5% (7,645) | 1.6% (7,297) |
| Arts, entertainment, and recreation | 1.5% (14,016) | 1.6% (8,168) | 1.3% (5,848) |
| Repair and maintenance | 1.4% (13,659) | 2.4% (12,371) | 0.3% (1,288) |
| Private households | 1.2% (11,434) | 0.1% (539) | 2.5% (10,895) |
| Clothing and accessories, including shoe, stores | 1.1% (10,935) | 0.9% (4,678) | 1.4% (6,257) |
| U. S. Postal service | 1.1% (10,348) | 1.3% (6,652) | 0.8% (3,696) |
| Department and other general merchandise stores | 1.1% (10,220) | 0.8% (3,981) | 1.4% (6,239) |
| Air transportation | 1.0% (9,757) | 1.1% (5,447) | 1.0% (4,310) |
| Other direct selling establishments | 0.8% (7,577) | 0.9% (4,514) | 0.7% (3,063) |
| Food | 0.7% (6,316) | 0.9% (4,432) | 0.4% (1,884) |
| Data processing, libraries, and other information services | 0.6% (6,203) | 0.6% (3,129) | 0.7% (3,074) |
| Miscellaneous nondurable goods merchant wholesalers | 0.6% (6,184) | 0.8% (4,263) | 0.4% (1,921) |
| Groceries and related products merchant wholesalers | 0.6% (5,869) | 0.9% (4,649) | 0.3% (1,220) |
| Truck transportation | 0.6% (5,772) | 1.0% (5,082) | 0.2% (690) |
| Pharmacies and drug stores | 0.6% (5,666) | 0.5% (2,685) | 0.7% (2,981) |
| Printing and related support activities | 0.6% (5,352) | 0.8% (3,856) | 0.3% (1,496) |
| Computer and electronic products | 0.5% (4,747) | 0.6% (3,153) | 0.4% (1,594) |
| Apparel, fabrics, and notions merchant wholesalers | 0.5% (4,675) | 0.4% (1,929) | 0.6% (2,746) |
| Motor vehicle and parts dealers | 0.5% (4,647) | 0.8% (3,946) | 0.2% (701) |
| Radio, TV, and computer stores | 0.5% (4,631) | 0.6% (3,332) | 0.3% (1,299) |
| Miscellaneous durable goods merchant wholesalers | 0.5% (4,621) | 0.5% (2,392) | 0.5% (2,229) |
| Used merchandise, gift, novelty, and souvenir, and other miscellaneous stores | 0.5% (4,541) | 0.5% (2,432) | 0.5% (2,109) |
| Utilities | 0.5% (4,416) | 0.7% (3,417) | 0.2% (999) |
| Furniture and home furnishings, and household appliance stores | 0.4% (4,101) | 0.5% (2,619) | 0.3% (1,482) |
| Building material and garden equipment and supplies dealers | 0.4% (3,982) | 0.6% (3,063) | 0.2% (919) |
| Chemicals | 0.4% (3,731) | 0.4% (1,913) | 0.4% (1,818) |
| Jewelry, luggage, and leather goods stores | 0.4% (3,645) | 0.4% (1,971) | 0.4% (1,674) |
| Metal and metal products | 0.4% (3,474) | 0.5% (2,804) | 0.2% (670) |
| Textile mills and textile products | 0.4% (3,426) | 0.3% (1,327) | 0.5% (2,099) |
| Machinery | 0.3% (2,682) | 0.4% (2,164) | 0.1% (518) |
| Health and personal care, except drug, stores | 0.3% (2,460) | 0.2% (978) | 0.3% (1,482) |
| Furniture and related product manufacturing | 0.3% (2,422) | 0.4% (2,033) | 0.1% (389) |
| Professional and commercial equipment and supplies merchant wholesalers | 0.2% (2,346) | 0.3% (1,546) | 0.2% (800) |
| Electrical and electronic goods merchant wholesalers | 0.2% (2,004) | 0.3% (1,465) | 0.1% (539) |
| Gasoline stations | 0.2% (1,839) | 0.3% (1,639) | 0.0% (200) |
| Sporting goods, camera, and hobby and toy stores | 0.2% (1,796) | 0.2% (992) | 0.2% (804) |
| Rail transportation | 0.2% (1,792) | 0.3% (1,473) | 0.1% (319) |
| Book stores and news dealers | 0.2% (1,753) | 0.2% (1,026) | 0.2% (727) |
| Electronic shopping and mail-order houses | 0.2% (1,485) | 0.1% (620) | 0.2% (865) |
| Electrical equipment, appliances, and components | 0.2% (1,441) | 0.1% (747) | 0.2% (694) |
| Drugs, sundries, and chemical and allied products merchant wholesalers | 0.1% (1,414) | 0.1% (759) | 0.1% (655) |
| Music stores | 0.1% (1,380) | 0.2% (1,045) | 0.1% (335) |
| Paper | 0.1% (1,365) | 0.2% (871) | 0.1% (494) |
| Transportation equipment | 0.1% (1,355) | 0.2% (1,040) | 0.1% (315) |
| Machinery, equipment, and supplies merchant wholesalers | 0.1% (1,353) | 0.2% (885) | 0.1% (468) |
| Office supplies and stationery stores | 0.1% (1,327) | 0.2% (782) | 0.1% (545) |
| Retail florists | 0.1% (1,212) | 0.1% (718) | 0.1% (494) |
| Plastics and rubber products | 0.1% (1,163) | 0.1% (709) | 0.1% (454) |
| Alcoholic beverages merchant wholesalers | 0.1% (1,084) | 0.2% (774) | 0.1% (310) |
| Beverage and tobacco products | 0.1% (1,046) | 0.1% (746) | 0.1% (300) |
| Furniture and home furnishing merchant wholesalers | 0.1% (1,018) | 0.1% (622) | 0.1% (396) |
| Leather and allied products | 0.1% (990) | 0.1% (497) | 0.1% (493) |
| Nonmetallic mineral products | 0.1% (958) | 0.1% (667) | 0.1% (291) |
| Warehousing and storage | 0.1% (884) | 0.1% (674) | 0.0% (210) |
| Motor vehicles, parts and supplies merchant wholesalers | 0.1% (741) | 0.1% (594) | 0.0% (147) |
Unemployment in Queens
- Unemployment by race in 2000
- Unemployment rate for White non-Hispanic residents
- 5.8%Males
- 5.4%Females
- Unemployment rate for Black residents
- 11.9%Males
- 9.3%Females
- Unemployment rate for American Indian and Alaska Native residents
- 12.3%Males
- 14.7%Females
- Unemployment rate for Asian residents
- 5.1%Males
- 6.6%Females
- Unemployment rate for other race residents
- 7.8%Males
- 12.9%Females
- Unemployment rate for two or more race residents
- 8.4%Males
- 9.8%Females
- Unemployment rate for Hispanic or Latino residents
- 8.1%Males
- 12.3%Females
Time leaving home to go to work

<5am:
| Queens: | 2.4% (22,672) |
| New York: | 2.4% (194,562) |
5:30am:
| Queens: | 2.3% (21,894) |
| New York: | 2.1% (174,328) |
6am:
| Queens: | 2.6% (24,657) |
| New York: | 3.1% (253,826) |
6:30am:
| Queens: | 7.3% (68,223) |
| New York: | 7.0% (573,349) |
7am:
| Queens: | 7.6% (70,466) |
| New York: | 8.6% (706,982) |
7:30am:
| Queens: | 15.0% (139,729) |
| New York: | 14.0% (1,147,579) |
8am:
| Queens: | 14.0% (130,488) |
| New York: | 14.8% (1,213,706) |
8:30am:
| Queens: | 15.9% (148,293) |
| New York: | 13.9% (1,144,298) |
9am:
| Queens: | 6.2% (58,118) |
| New York: | 7.5% (614,475) |
10am:
| Queens: | 7.6% (70,476) |
| New York: | 7.2% (593,377) |
11am:
| Queens: | 3.4% (31,699) |
| New York: | 2.7% (224,011) |
12pm:
| Queens: | 1.4% (13,338) |
| New York: | 1.3% (105,049) |
4pm:
| Queens: | 6.2% (57,598) |
| New York: | 6.3% (517,309) |
>4pm:
| Queens: | 6.2% (57,385) |
| New York: | 6.1% (501,196) |
Travel time to work


Less than 5 minutes:
| Queens: | 0.9% (8,788) |
| New York: | 2.7% (219,036) |
5 to 9 minutes:
| Queens: | 3.2% (29,545) |
| New York: | 8.3% (680,270) |
10 to 14 minutes:
| Queens: | 5.9% (55,158) |
| New York: | 11.6% (956,590) |
15 to 19 minutes:
| Queens: | 7.7% (71,810) |
| New York: | 12.4% (1,020,084) |
20 to 24 minutes:
| Queens: | 8.7% (81,111) |
| New York: | 12.3% (1,013,757) |
25 to 29 minutes:
| Queens: | 3.3% (30,347) |
| New York: | 4.9% (399,384) |
30 to 34 minutes:
| Queens: | 16.1% (149,708) |
| New York: | 12.9% (1,058,688) |
35 to 39 minutes:
| Queens: | 2.5% (23,322) |
| New York: | 2.5% (203,722) |
40 to 44 minutes:
| Queens: | 6.1% (56,550) |
| New York: | 4.1% (340,311) |
45 to 59 minutes:
| Queens: | 16.3% (152,102) |
| New York: | 9.8% (806,556) |
60 to 89 minutes:
| Queens: | 19.6% (182,420) |
| New York: | 10.3% (848,185) |
90 or more minutes:
| Queens: | 8.0% (74,175) |
| New York: | 5.1% (417,464) |
Means of transportation to work


Drove car alone:
| Queens: | 34.3% (319,187) |
| New York: | 56.3% (4,620,178) |
Carpooled:
| Queens: | 10.2% (95,329) |
| New York: | 9.2% (756,918) |
Bus or trolley bus:
| Queens: | 10.0% (93,186) |
| New York: | 5.8% (475,389) |
Streetcar or trolley car:
| Queens: | 0.2% (1,543) |
| New York: | 0.1% (6,058) |
Subway or elevated:
| Queens: | 34.3% (319,225) |
| New York: | 14.8% (1,217,009) |
Railroad:
| Queens: | 2.2% (20,845) |
| New York: | 2.8% (228,215) |
Ferryboat:
| Queens: | 0.0% (143) |
| New York: | 0.1% (11,626) |
Taxicab:
| Queens: | 0.7% (6,235) |
| New York: | 0.8% (67,897) |
Motorcycle:
| Queens: | 0.0% (384) |
| New York: | 0.0% (3,625) |
Bicycle:
| Queens: | 0.3% (2,417) |
| New York: | 0.3% (25,036) |
Walked:
| Queens: | 5.7% (52,776) |
| New York: | 6.2% (511,721) |
Other means:
| Queens: | 0.4% (3,766) |
| New York: | 0.5% (40,375) |
Private vehicle occupancy

Drove alone:
| Queens: | 77.0% (319,187) |
| New York: | 85.9% (4,620,178) |
In 2 person carpool:
| Queens: | 16.5% (68,306) |
| New York: | 11.0% (590,255) |
In 3 person carpool:
| Queens: | 3.4% (13,892) |
| New York: | 1.8% (96,470) |
In 4 person carpool:
| Queens: | 1.5% (6,034) |
| New York: | 0.7% (36,112) |
In 5-6 person carpool:
| Queens: | 0.8% (3,320) |
| New York: | 0.3% (16,644) |
In 7+ person carpool:
| Queens: | 0.9% (3,777) |
| New York: | 0.3% (17,437) |
Class of workers
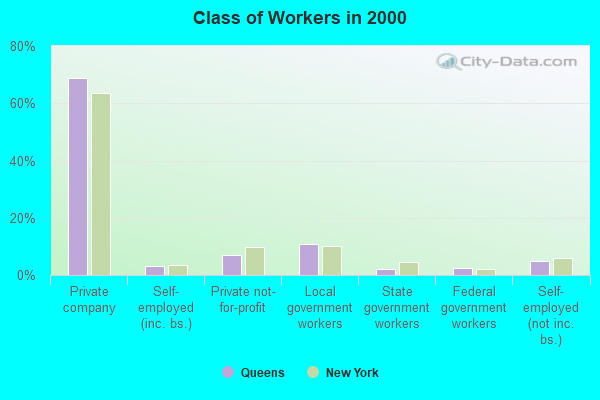
Employee of private company:
| Queens: | 68.8% (658,630) |
| New York: | 63.7% (5,340,134) |
Self-employed in own incorporated business:
| Queens: | 3.2% (30,772) |
| New York: | 3.4% (283,619) |
Private not-for-profit wage and salary workers:
| Queens: | 7.1% (68,181) |
| New York: | 9.7% (810,356) |
Local government workers:
| Queens: | 10.8% (103,048) |
| New York: | 10.2% (858,120) |
State government workers:
| Queens: | 2.3% (21,536) |
| New York: | 4.6% (383,673) |
Federal government workers:
| Queens: | 2.5% (23,852) |
| New York: | 2.2% (185,100) |
Self-employed workers in own not incorporated business:
| Queens: | 5.1% (48,383) |
| New York: | 6.0% (501,068) |
Unpaid family workers:
| Queens: | 0.2% (2,382) |
| New York: | 0.2% (20,918) |

Employee of private company - Males:
| Queens: | 70.6% (362,518) |
| New York: | 66.2% (2,902,064) |
Self-employed in own incorporated business - Males:
| Queens: | 4.5% (23,260) |
| New York: | 4.9% (215,651) |
Private not-for-profit wage and salary workers - Males:
| Queens: | 5.0% (25,638) |
| New York: | 6.3% (277,787) |
Local government workers - Males:
| Queens: | 9.1% (46,704) |
| New York: | 8.7% (380,426) |
State government workers - Males:
| Queens: | 2.0% (10,285) |
| New York: | 4.1% (181,784) |
Federal government workers - Males:
| Queens: | 2.6% (13,146) |
| New York: | 2.3% (102,647) |
Self-employed workers in own not incorporated business - Males:
| Queens: | 6.0% (30,630) |
| New York: | 7.1% (312,497) |
Unpaid family workers - Males:
| Queens: | 0.2% (1,181) |
| New York: | 0.2% (9,470) |

Employee of private company - Females:
| Queens: | 66.8% (296,112) |
| New York: | 60.9% (2,438,070) |
Self-employed in own incorporated business - Females:
| Queens: | 1.7% (7,512) |
| New York: | 1.7% (67,968) |
Private not-for-profit wage and salary workers - Females:
| Queens: | 9.6% (42,543) |
| New York: | 13.3% (532,569) |
Local government workers - Females:
| Queens: | 12.7% (56,344) |
| New York: | 11.9% (477,694) |
State government workers - Females:
| Queens: | 2.5% (11,251) |
| New York: | 5.0% (201,889) |
Federal government workers - Females:
| Queens: | 2.4% (10,706) |
| New York: | 2.1% (82,453) |
Self-employed workers in own not incorporated business - Females:
| Queens: | 4.0% (17,753) |
| New York: | 4.7% (188,571) |
Unpaid family workers - Females:
| Queens: | 0.3% (1,201) |
| New York: | 0.3% (11,448) |