Work and Jobs in Scranton, Pennsylvania (PA) Detailed Stats
Occupations, Industries, Unemployment, Workers, Commute
Settings
X


Recent posts about work in Scranton, Pennsylvania on our local forum with over 2,400,000 registered users:
 | Coworking or Shared Office Space in NEPA? (9 replies) |
| Offered a job in Swiftwater, housing holding us back (17 replies) |
| SCRANTON RUNS OUT OF MONEY, Cuts All City Salaries To Minimum Wage (93 replies) |
| Scranton/Wilkes-Barre Unemployment (18 replies) |
| Scranton vs. Wilkes-Barre for a Young Urban Professional (10 replies) |
| Summer Jobs in Scranton. (5 replies) |
Latest news about work in Scranton, PA collected exclusively by city-data.com from local newspapers, TV, and radio stations
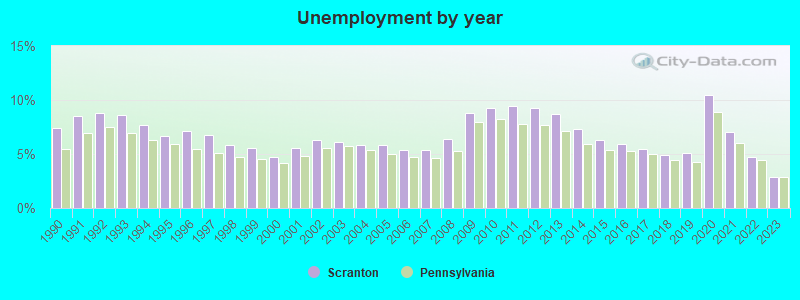
The unemployment rate in 2023 in Scranton, PA was 2.9%, which was about the same as the unemployment rate of 2.9% across the entire state of Pennsylvania. Compared to the unemployment rate of 8.7% in 2013, this represents a decrease of 200.0%. The most common industries in Scranton are: Health care (13.1% of civilian employees), Educational services (9.6% of civilian employees), Accommodation & food services (6.2% of civilian employees). 81.9% of workers work in Lackawanna County and 6.9% of all workers work at home. 74.7% of workers are employees of private companies, which is 9.4% greater than the rate of 67.7% across the entire state of Pennsylvania.
Whole page based on the data from 2000 / 2022 when the population of Scranton, Pennsylvania was 76,415 / 75,838
Whole page based on the data from 2000 / 2022 when the population of Scranton, Pennsylvania was 76,415 / 75,838
Most common industries
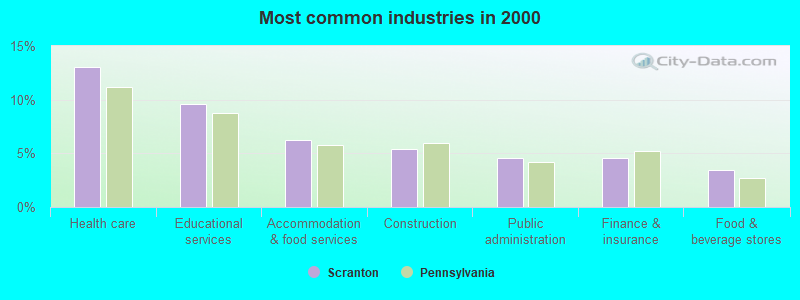
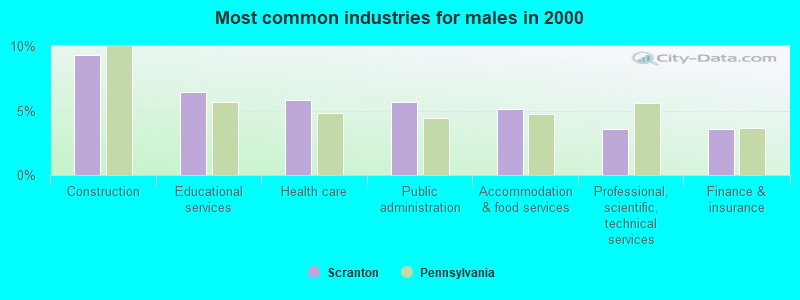
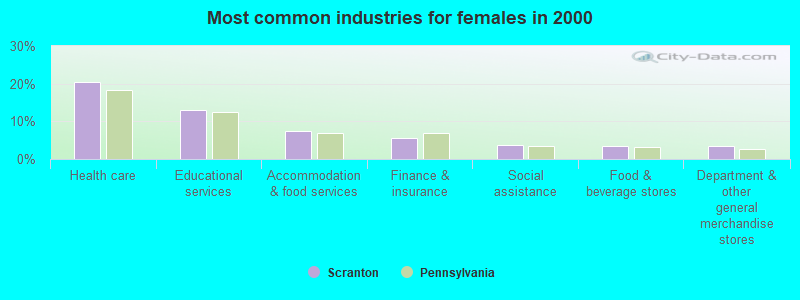
Most common industries | |||
|---|---|---|---|
Industry | All | Males | Females |
| Health care | 13.1% (4,284) | 5.8% (969) | 20.5% (3,315) |
| Educational services | 9.6% (3,157) | 6.4% (1,062) | 12.9% (2,095) |
| Accommodation and food services | 6.2% (2,039) | 5.1% (846) | 7.4% (1,193) |
| Construction | 5.4% (1,783) | 9.3% (1,545) | 1.5% (238) |
| Public administration | 4.6% (1,492) | 5.7% (941) | 3.4% (551) |
| Finance and insurance | 4.5% (1,485) | 3.6% (594) | 5.5% (891) |
| Food and beverage stores | 3.4% (1,130) | 3.4% (563) | 3.5% (567) |
| Administrative and support and waste management services | 3.3% (1,094) | 3.6% (591) | 3.1% (503) |
| Professional, scientific, and technical services | 3.3% (1,076) | 3.6% (594) | 3.0% (482) |
| Social assistance | 2.4% (794) | 1.1% (175) | 3.8% (619) |
| Department and other general merchandise stores | 2.3% (743) | 1.1% (177) | 3.5% (566) |
| Religious, grantmaking, civic, professional, and similar organizations | 2.2% (726) | 2.2% (363) | 2.2% (363) |
| Computer and electronic products | 1.9% (624) | 2.7% (447) | 1.1% (177) |
| Food | 1.9% (614) | 1.9% (314) | 1.9% (300) |
| Apparel | 1.8% (577) | 0.9% (153) | 2.6% (424) |
| Personal and laundry services | 1.6% (529) | 1.0% (170) | 2.2% (359) |
| Printing and related support activities | 1.5% (508) | 2.1% (356) | 0.9% (152) |
| Truck transportation | 1.5% (508) | 2.7% (442) | 0.4% (66) |
| Publishing, and motion picture and sound recording industries | 1.4% (475) | 1.0% (174) | 1.9% (301) |
| Broadcasting and telecommunications | 1.3% (423) | 1.4% (240) | 1.1% (183) |
| Other transportation, and support activities, and couriers | 1.3% (421) | 2.0% (335) | 0.5% (86) |
| Electrical equipment, appliances, and components | 1.3% (419) | 1.9% (318) | 0.6% (101) |
| Motor vehicle and parts dealers | 1.2% (403) | 2.1% (348) | 0.3% (55) |
| Metal and metal products | 1.2% (398) | 2.1% (350) | 0.3% (48) |
| Repair and maintenance | 1.2% (388) | 2.1% (347) | 0.3% (41) |
| Clothing and accessories, including shoe, stores | 1.1% (351) | 0.3% (54) | 1.8% (297) |
| Arts, entertainment, and recreation | 1.0% (343) | 1.0% (169) | 1.1% (174) |
| Miscellaneous manufacturing | 1.0% (339) | 1.3% (219) | 0.7% (120) |
| Groceries and related products merchant wholesalers | 1.0% (330) | 1.5% (249) | 0.5% (81) |
| Other direct selling establishments | 0.9% (298) | 0.6% (96) | 1.2% (202) |
| Utilities | 0.9% (297) | 1.5% (244) | 0.3% (53) |
| Building material and garden equipment and supplies dealers | 0.8% (272) | 1.5% (243) | 0.2% (29) |
| Real estate and rental and leasing | 0.8% (269) | 1.3% (217) | 0.3% (52) |
| Plastics and rubber products | 0.7% (245) | 1.3% (215) | 0.2% (30) |
| U. S. Postal service | 0.7% (218) | 1.1% (180) | 0.2% (38) |
| Nonmetallic mineral products | 0.6% (206) | 1.2% (197) | 0.1% (9) |
| Machinery | 0.6% (204) | 1.0% (172) | 0.2% (32) |
| Pharmacies and drug stores | 0.6% (203) | 0.3% (55) | 0.9% (148) |
| Paper | 0.6% (201) | 0.8% (129) | 0.4% (72) |
| Used merchandise, gift, novelty, and souvenir, and other miscellaneous stores | 0.6% (199) | 0.4% (59) | 0.9% (140) |
| Electronic shopping and mail-order houses | 0.5% (174) | 0.3% (48) | 0.8% (126) |
| Warehousing and storage | 0.5% (167) | 0.5% (90) | 0.5% (77) |
| Miscellaneous nondurable goods merchant wholesalers | 0.5% (148) | 0.6% (106) | 0.3% (42) |
| Furniture and home furnishings, and household appliance stores | 0.4% (146) | 0.6% (101) | 0.3% (45) |
| Textile mills and textile products | 0.4% (142) | 0.5% (88) | 0.3% (54) |
| Radio, TV, and computer stores | 0.4% (133) | 0.6% (101) | 0.2% (32) |
| Data processing, libraries, and other information services | 0.3% (102) | 0.1% (21) | 0.5% (81) |
| Chemicals | 0.3% (97) | 0.5% (76) | 0.1% (21) |
| Furniture and related product manufacturing | 0.3% (93) | 0.2% (36) | 0.4% (57) |
| Health and personal care, except drug, stores | 0.3% (92) | 0.2% (27) | 0.4% (65) |
| Motor vehicles, parts and supplies merchant wholesalers | 0.3% (83) | 0.4% (65) | 0.1% (18) |
| Book stores and news dealers | 0.2% (77) | 0.1% (15) | 0.4% (62) |
| Agriculture, forestry, fishing and hunting | 0.2% (75) | 0.3% (51) | 0.1% (24) |
| Machinery, equipment, and supplies merchant wholesalers | 0.2% (75) | 0.3% (57) | 0.1% (18) |
| Wood products | 0.2% (71) | 0.4% (71) | 0.0% (0) |
| Air transportation | 0.2% (70) | 0.2% (35) | 0.2% (35) |
| Miscellaneous durable goods merchant wholesalers | 0.2% (59) | 0.3% (46) | 0.1% (13) |
| Sewing, needlework, and piece goods stores | 0.2% (58) | 0.1% (21) | 0.2% (37) |
| Gasoline stations | 0.2% (53) | 0.3% (53) | 0.0% (0) |
| Sporting goods, camera, and hobby and toy stores | 0.2% (51) | 0.2% (32) | 0.1% (19) |
| Rail transportation | 0.1% (49) | 0.3% (49) | 0.0% (0) |
| Private households | 0.1% (49) | 0.1% (15) | 0.2% (34) |
| Apparel, fabrics, and notions merchant wholesalers | 0.1% (48) | 0.1% (11) | 0.2% (37) |
| Retail florists | 0.1% (48) | 0.0% (4) | 0.3% (44) |
| Drugs, sundries, and chemical and allied products merchant wholesalers | 0.1% (47) | 0.3% (43) | 0.0% (4) |
| Electrical and electronic goods merchant wholesalers | 0.1% (46) | 0.2% (41) | 0.0% (5) |
| Professional and commercial equipment and supplies merchant wholesalers | 0.1% (46) | 0.2% (30) | 0.1% (16) |
| Hardware, plumbing and heating equipment, and supplies merchant wholesalers | 0.1% (43) | 0.2% (36) | 0.0% (7) |
| Beverage and tobacco products | 0.1% (35) | 0.2% (35) | 0.0% (0) |
| Jewelry, luggage, and leather goods stores | 0.1% (35) | 0.1% (12) | 0.1% (23) |
| Alcoholic beverages merchant wholesalers | 0.1% (34) | 0.2% (29) | 0.0% (5) |
| Music stores | 0.1% (32) | 0.2% (25) | 0.0% (7) |
| Vending machine operators | 0.1% (29) | 0.2% (29) | 0.0% (0) |
| Office supplies and stationery stores | 0.1% (28) | 0.1% (17) | 0.1% (11) |
| Recyclable material merchant wholesalers | 0.1% (27) | 0.2% (27) | 0.0% (0) |
| Mining, quarrying, and oil and gas extraction | 0.1% (25) | 0.2% (25) | 0.0% (0) |
| Lumber and other construction materials merchant wholesalers | 0.1% (25) | 0.2% (25) | 0.0% (0) |
| Transportation equipment | 0.1% (17) | 0.1% (17) | 0.0% (0) |
Unemployment in Scranton
- Unemployment by race in 2022
- Unemployment rate for White non-Hispanic residents
- 1.4%Males
- 3.5%Females
- Unemployment rate for Black residents
- 4.7%Males
- 3.5%Females
- Unemployment rate for American Indian and Alaska Native residents
- 57.8%Females
- Unemployment rate for Asian residents
- 1.3%Males
- 3.2%Females
- Unemployment rate for other race residents
- 8.1%Males
- 5.0%Females
- Unemployment rate for two or more race residents
- 6.3%Males
- 13.8%Females
- Unemployment rate for Hispanic or Latino residents
- 7.1%Males
- 9.3%Females
- Unemployment by race in 2000
- Unemployment rate for White non-Hispanic residents
- 8.0%Males
- 5.6%Females
- Unemployment rate for Black residents
- 25.6%Males
- 9.6%Females
- Unemployment rate for Asian residents
- 3.1%Males
- 5.6%Females
- Unemployment rate for other race residents
- 10.3%Males
- 7.2%Females
- Unemployment rate for two or more race residents
- 32.0%Males
- 7.6%Females
- Unemployment rate for Hispanic or Latino residents
- 16.9%Males
- 9.7%Females
Unemployment in 2023:
| Scranton: | 2.9% |
| Pennsylvania: | 2.9% |
Unemployment in 2022:
| Scranton: | 4.7% |
| Pennsylvania: | 4.4% |
Unemployment in 2021:
| Scranton: | 7.0% |
| Pennsylvania: | 6.0% |
Unemployment in 2020:
| Scranton: | 10.5% |
| Pennsylvania: | 8.9% |
Unemployment in 2019:
| Scranton: | 5.1% |
| Pennsylvania: | 4.3% |
Unemployment in 2018:
| Scranton: | 4.9% |
| Pennsylvania: | 4.4% |
Unemployment in 2017:
| Scranton: | 5.5% |
| Pennsylvania: | 5.0% |
Unemployment in 2016:
| Scranton: | 5.9% |
| Pennsylvania: | 5.3% |
Unemployment in 2015:
| Scranton: | 6.3% |
| Pennsylvania: | 5.4% |
Unemployment in 2014:
| Scranton: | 7.3% |
| Pennsylvania: | 5.9% |
Unemployment in 2013:
| Scranton: | 8.7% |
| Pennsylvania: | 7.1% |
Unemployment in 2012:
| Scranton: | 9.3% |
| Pennsylvania: | 7.7% |
Unemployment in 2011:
| Scranton: | 9.4% |
| Pennsylvania: | 7.8% |
Unemployment in 2010:
| Scranton: | 9.3% |
| Pennsylvania: | 8.2% |
Unemployment in 2009:
| Scranton: | 8.8% |
| Pennsylvania: | 8.0% |
Unemployment in 2008:
| Scranton: | 6.4% |
| Pennsylvania: | 5.3% |
Unemployment in 2007:
| Scranton: | 5.4% |
| Pennsylvania: | 4.6% |
Unemployment in 2006:
| Scranton: | 5.4% |
| Pennsylvania: | 4.7% |
Unemployment in 2005:
| Scranton: | 5.8% |
| Pennsylvania: | 5.0% |
Unemployment in 2004:
| Scranton: | 5.8% |
| Pennsylvania: | 5.4% |
Unemployment in 2003:
| Scranton: | 6.1% |
| Pennsylvania: | 5.7% |
Unemployment in 2002:
| Scranton: | 6.3% |
| Pennsylvania: | 5.6% |
Unemployment in 2001:
| Scranton: | 5.6% |
| Pennsylvania: | 4.8% |
Unemployment in 2000:
| Scranton: | 4.7% |
| Pennsylvania: | 4.2% |
Unemployment in 1999:
| Scranton: | 5.6% |
| Pennsylvania: | 4.5% |
Unemployment in 1998:
| Scranton: | 5.8% |
| Pennsylvania: | 4.7% |
Unemployment in 1997:
| Scranton: | 6.8% |
| Pennsylvania: | 5.1% |
Unemployment in 1996:
| Scranton: | 7.1% |
| Pennsylvania: | 5.5% |
Unemployment in 1995:
| Scranton: | 6.7% |
| Pennsylvania: | 5.9% |
Unemployment in 1994:
| Scranton: | 7.7% |
| Pennsylvania: | 6.3% |
Unemployment in 1993:
| Scranton: | 8.6% |
| Pennsylvania: | 6.9% |
Unemployment in 1992:
| Scranton: | 8.8% |
| Pennsylvania: | 7.5% |
Unemployment in 1991:
| Scranton: | 8.5% |
| Pennsylvania: | 6.9% |
Unemployment in 1990:
| Scranton: | 7.4% |
| Pennsylvania: | 5.5% |
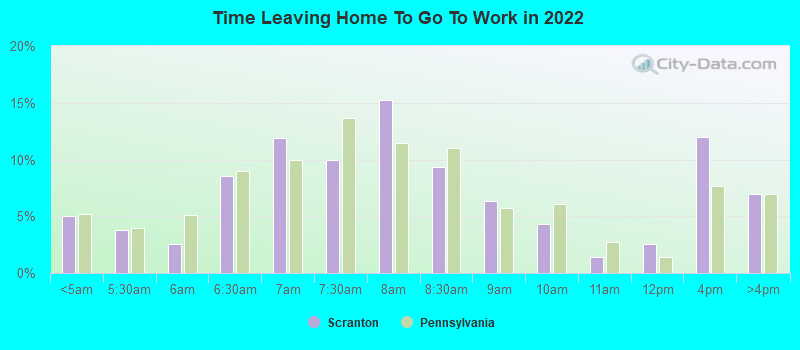
Time leaving home to go to work
12:00 a.m. to 4:59 a.m.:
| Scranton: | 5.1% (1,575) |
| Pennsylvania: | 5.2% (278,903) |
5:00 a.m. to 5:29 a.m.:
| Scranton: | 3.8% (1,175) |
| Pennsylvania: | 3.9% (210,362) |
5:30 a.m. to 5:59 a.m.:
| Scranton: | 2.6% (794) |
| Pennsylvania: | 5.1% (274,242) |
6:00 a.m. to 6:29 a.m.:
| Scranton: | 8.6% (2,665) |
| Pennsylvania: | 9.0% (480,402) |
6:30 a.m. to 6:59 a.m.:
| Scranton: | 11.9% (3,687) |
| Pennsylvania: | 10.0% (532,059) |
7:00 a.m. to 7:29 a.m.:
| Scranton: | 10.0% (3,109) |
| Pennsylvania: | 13.6% (726,980) |
7:30 a.m. to 7:59 a.m.:
| Scranton: | 15.2% (4,728) |
| Pennsylvania: | 11.5% (611,627) |
8:00 a.m. to 8:29 a.m.:
| Scranton: | 9.3% (2,907) |
| Pennsylvania: | 11.0% (585,665) |
8:30 a.m. to 8:59 a.m.:
| Scranton: | 6.3% (1,971) |
| Pennsylvania: | 5.7% (302,857) |
9:00 a.m. to 9:59 a.m.:
| Scranton: | 4.4% (1,356) |
| Pennsylvania: | 6.1% (324,576) |
10:00 a.m. to 10:59 a.m.:
| Scranton: | 1.4% (441) |
| Pennsylvania: | 2.7% (146,376) |
11:00 a.m. to 11:59 a.m.:
| Scranton: | 2.6% (798) |
| Pennsylvania: | 1.4% (75,840) |
12:00 p.m. to 3:59 p.m.:
| Scranton: | 12.0% (3,719) |
| Pennsylvania: | 7.6% (407,255) |
4:00 p.m. to 11:59 p.m.:
| Scranton: | 7.0% (2,167) |
| Pennsylvania: | 6.9% (369,524) |

<5am:
| Scranton: | 2.5% (791) |
| Pennsylvania: | 3.1% (172,304) |
5:30am:
| Scranton: | 1.6% (498) |
| Pennsylvania: | 2.7% (150,168) |
6am:
| Scranton: | 3.2% (1,040) |
| Pennsylvania: | 4.4% (245,004) |
6:30am:
| Scranton: | 6.3% (2,030) |
| Pennsylvania: | 8.6% (478,636) |
7am:
| Scranton: | 10.7% (3,435) |
| Pennsylvania: | 10.8% (599,808) |
7:30am:
| Scranton: | 8.5% (2,710) |
| Pennsylvania: | 13.7% (759,372) |
8am:
| Scranton: | 16.3% (5,225) |
| Pennsylvania: | 14.9% (826,968) |
8:30am:
| Scranton: | 12.8% (4,112) |
| Pennsylvania: | 10.6% (588,440) |
9am:
| Scranton: | 7.2% (2,291) |
| Pennsylvania: | 5.5% (304,765) |
10am:
| Scranton: | 6.0% (1,913) |
| Pennsylvania: | 5.1% (280,812) |
11am:
| Scranton: | 2.6% (820) |
| Pennsylvania: | 2.1% (114,676) |
12pm:
| Scranton: | 1.1% (368) |
| Pennsylvania: | 1.0% (57,867) |
4pm:
| Scranton: | 9.3% (2,992) |
| Pennsylvania: | 7.3% (404,775) |
>4pm:
| Scranton: | 10.4% (3,319) |
| Pennsylvania: | 7.3% (408,070) |

12:00 a.m. to 4:59 a.m. - Males:
| Scranton: | 5.2% (816) |
| Pennsylvania: | 7.2% (203,028) |
5:00 a.m. to 5:29 a.m. - Males:
| Scranton: | 4.8% (749) |
| Pennsylvania: | 5.6% (157,829) |
5:30 a.m. to 5:59 a.m. - Males:
| Scranton: | 4.0% (619) |
| Pennsylvania: | 6.4% (180,791) |
6:00 a.m. to 6:29 a.m. - Males:
| Scranton: | 7.9% (1,237) |
| Pennsylvania: | 10.5% (296,669) |
6:30 a.m. to 6:59 a.m. - Males:
| Scranton: | 13.5% (2,108) |
| Pennsylvania: | 10.4% (293,727) |
7:00 a.m. to 7:29 a.m. - Males:
| Scranton: | 10.3% (1,610) |
| Pennsylvania: | 12.6% (356,257) |
7:30 a.m. to 7:59 a.m. - Males:
| Scranton: | 14.7% (2,298) |
| Pennsylvania: | 9.5% (268,895) |
8:00 a.m. to 8:29 a.m. - Males:
| Scranton: | 7.1% (1,105) |
| Pennsylvania: | 9.7% (274,966) |
8:30 a.m. to 8:59 a.m. - Males:
| Scranton: | 4.9% (769) |
| Pennsylvania: | 4.9% (137,370) |
9:00 a.m. to 9:59 a.m. - Males:
| Scranton: | 4.9% (759) |
| Pennsylvania: | 5.1% (145,545) |
10:00 a.m. to 10:59 a.m. - Males:
| Scranton: | 1.2% (194) |
| Pennsylvania: | 2.3% (66,088) |
11:00 a.m. to 11:59 a.m. - Males:
| Scranton: | 3.0% (463) |
| Pennsylvania: | 1.3% (36,091) |
12:00 p.m. to 3:59 p.m. - Males:
| Scranton: | 10.2% (1,594) |
| Pennsylvania: | 7.4% (210,601) |
4:00 p.m. to 11:59 p.m. - Males:
| Scranton: | 8.4% (1,306) |
| Pennsylvania: | 7.1% (202,203) |

12:00 a.m. to 4:59 a.m. - Females:
| Scranton: | 4.9% (759) |
| Pennsylvania: | 3.0% (75,875) |
5:00 a.m. to 5:29 a.m. - Females:
| Scranton: | 2.8% (426) |
| Pennsylvania: | 2.1% (52,533) |
5:30 a.m. to 5:59 a.m. - Females:
| Scranton: | 1.1% (175) |
| Pennsylvania: | 3.7% (93,451) |
6:00 a.m. to 6:29 a.m. - Females:
| Scranton: | 9.2% (1,428) |
| Pennsylvania: | 7.4% (183,733) |
6:30 a.m. to 6:59 a.m. - Females:
| Scranton: | 10.2% (1,579) |
| Pennsylvania: | 9.5% (238,332) |
7:00 a.m. to 7:29 a.m. - Females:
| Scranton: | 9.7% (1,499) |
| Pennsylvania: | 14.8% (370,723) |
7:30 a.m. to 7:59 a.m. - Females:
| Scranton: | 15.7% (2,430) |
| Pennsylvania: | 13.7% (342,732) |
8:00 a.m. to 8:29 a.m. - Females:
| Scranton: | 11.7% (1,802) |
| Pennsylvania: | 12.4% (310,699) |
8:30 a.m. to 8:59 a.m. - Females:
| Scranton: | 7.8% (1,202) |
| Pennsylvania: | 6.6% (165,487) |
9:00 a.m. to 9:59 a.m. - Females:
| Scranton: | 3.9% (597) |
| Pennsylvania: | 7.2% (179,031) |
10:00 a.m. to 10:59 a.m. - Females:
| Scranton: | 1.6% (247) |
| Pennsylvania: | 3.2% (80,288) |
11:00 a.m. to 11:59 a.m. - Females:
| Scranton: | 2.2% (335) |
| Pennsylvania: | 1.6% (39,749) |
12:00 p.m. to 3:59 p.m. - Females:
| Scranton: | 13.7% (2,125) |
| Pennsylvania: | 7.9% (196,654) |
4:00 p.m. to 11:59 p.m. - Females:
| Scranton: | 5.6% (861) |
| Pennsylvania: | 6.7% (167,321) |
Travel time to work
Percentage of workers working in this county: 81.9%
Number of people working at home: 2,372 (6.9% of all workers)
Daytime population change due to commuting: +9,736 (+12.7%)
Workers who live and work in this city: 18,046 (56.3%)
Number of people working at home: 2,372 (6.9% of all workers)
Daytime population change due to commuting: +9,736 (+12.7%)
Workers who live and work in this city: 18,046 (56.3%)

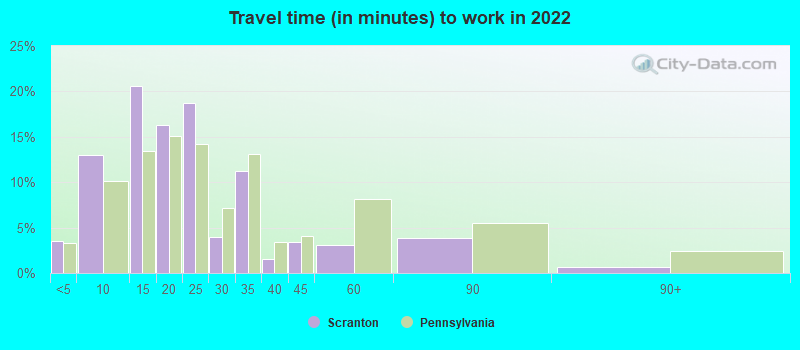

Less than 5 minutes:
| Scranton: | 3.5% (1,184) |
| Pennsylvania: | 3.3% (176,091) |
5 to 9 minutes:
| Scranton: | 13.0% (4,444) |
| Pennsylvania: | 10.2% (536,363) |
10 to 14 minutes:
| Scranton: | 20.6% (7,007) |
| Pennsylvania: | 13.4% (709,149) |
15 to 19 minutes:
| Scranton: | 16.4% (5,576) |
| Pennsylvania: | 15.1% (795,392) |
20 to 24 minutes:
| Scranton: | 18.7% (6,377) |
| Pennsylvania: | 14.2% (750,120) |
25 to 29 minutes:
| Scranton: | 4.0% (1,363) |
| Pennsylvania: | 7.1% (376,011) |
30 to 34 minutes:
| Scranton: | 11.3% (3,837) |
| Pennsylvania: | 13.1% (689,933) |
35 to 39 minutes:
| Scranton: | 1.6% (543) |
| Pennsylvania: | 3.4% (181,099) |
40 to 44 minutes:
| Scranton: | 3.4% (1,149) |
| Pennsylvania: | 4.0% (211,803) |
45 to 59 minutes:
| Scranton: | 3.1% (1,066) |
| Pennsylvania: | 8.1% (429,639) |
60 to 89 minutes:
| Scranton: | 3.8% (1,306) |
| Pennsylvania: | 5.5% (292,390) |
90 or more minutes:
| Scranton: | 0.7% (242) |
| Pennsylvania: | 2.4% (127,300) |


Less than 5 minutes:
| Scranton: | 4.4% (1,396) |
| Pennsylvania: | 3.5% (196,492) |
5 to 9 minutes:
| Scranton: | 17.1% (5,476) |
| Pennsylvania: | 11.1% (615,919) |
10 to 14 minutes:
| Scranton: | 27.2% (8,711) |
| Pennsylvania: | 14.9% (825,199) |
15 to 19 minutes:
| Scranton: | 21.3% (6,829) |
| Pennsylvania: | 15.0% (836,006) |
20 to 24 minutes:
| Scranton: | 11.9% (3,801) |
| Pennsylvania: | 14.1% (782,790) |
25 to 29 minutes:
| Scranton: | 3.5% (1,120) |
| Pennsylvania: | 5.9% (327,459) |
30 to 34 minutes:
| Scranton: | 5.2% (1,658) |
| Pennsylvania: | 11.8% (655,811) |
35 to 39 minutes:
| Scranton: | 0.8% (269) |
| Pennsylvania: | 2.7% (148,906) |
40 to 44 minutes:
| Scranton: | 1.1% (351) |
| Pennsylvania: | 3.4% (187,483) |
45 to 59 minutes:
| Scranton: | 2.2% (716) |
| Pennsylvania: | 7.3% (407,516) |
60 to 89 minutes:
| Scranton: | 2.1% (687) |
| Pennsylvania: | 4.8% (265,759) |
90 or more minutes:
| Scranton: | 1.7% (530) |
| Pennsylvania: | 2.6% (142,325) |

Less than 5 minutes - Males:
| Scranton: | 3.0% (517) |
| Pennsylvania: | 3.2% (90,117) |
5 to 9 minutes - Males:
| Scranton: | 15.1% (2,555) |
| Pennsylvania: | 9.4% (263,803) |
10 to 14 minutes - Males:
| Scranton: | 17.8% (3,013) |
| Pennsylvania: | 12.3% (344,337) |
15 to 19 minutes - Males:
| Scranton: | 16.7% (2,841) |
| Pennsylvania: | 14.4% (402,062) |
20 to 24 minutes - Males:
| Scranton: | 17.7% (2,997) |
| Pennsylvania: | 13.6% (380,953) |
25 to 29 minutes - Males:
| Scranton: | 2.9% (499) |
| Pennsylvania: | 6.9% (193,555) |
30 to 34 minutes - Males:
| Scranton: | 13.4% (2,272) |
| Pennsylvania: | 13.7% (383,132) |
35 to 39 minutes - Males:
| Scranton: | 0.2% (29) |
| Pennsylvania: | 3.6% (102,122) |
40 to 44 minutes - Males:
| Scranton: | 5.4% (922) |
| Pennsylvania: | 4.3% (120,376) |
45 to 59 minutes - Males:
| Scranton: | 3.5% (589) |
| Pennsylvania: | 9.0% (251,766) |
60 to 89 minutes - Males:
| Scranton: | 3.4% (569) |
| Pennsylvania: | 6.5% (183,289) |
90 or more minutes - Males:
| Scranton: | 1.0% (162) |
| Pennsylvania: | 3.0% (85,115) |

Less than 5 minutes - Females:
| Scranton: | 3.9% (667) |
| Pennsylvania: | 3.5% (85,974) |
5 to 9 minutes - Females:
| Scranton: | 11.0% (1,889) |
| Pennsylvania: | 11.0% (272,560) |
10 to 14 minutes - Females:
| Scranton: | 23.3% (3,994) |
| Pennsylvania: | 14.7% (364,812) |
15 to 19 minutes - Females:
| Scranton: | 16.0% (2,735) |
| Pennsylvania: | 15.9% (393,330) |
20 to 24 minutes - Females:
| Scranton: | 19.7% (3,380) |
| Pennsylvania: | 14.9% (369,167) |
25 to 29 minutes - Females:
| Scranton: | 5.0% (864) |
| Pennsylvania: | 7.4% (182,456) |
30 to 34 minutes - Females:
| Scranton: | 9.1% (1,565) |
| Pennsylvania: | 12.4% (306,801) |
35 to 39 minutes - Females:
| Scranton: | 3.0% (514) |
| Pennsylvania: | 3.2% (78,977) |
40 to 44 minutes - Females:
| Scranton: | 1.3% (227) |
| Pennsylvania: | 3.7% (91,427) |
45 to 59 minutes - Females:
| Scranton: | 2.8% (477) |
| Pennsylvania: | 7.2% (177,873) |
60 to 89 minutes - Females:
| Scranton: | 4.3% (737) |
| Pennsylvania: | 4.4% (109,101) |
90 or more minutes - Females:
| Scranton: | 0.5% (80) |
| Pennsylvania: | 1.7% (42,185) |
Means of transportation to work
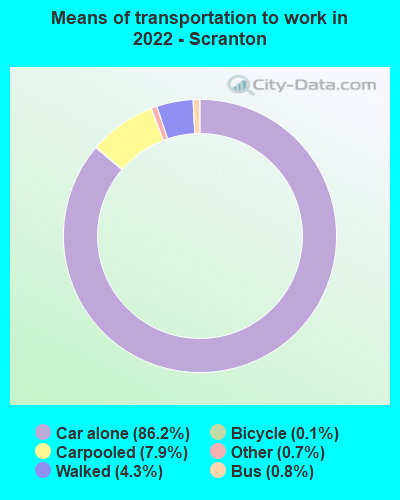
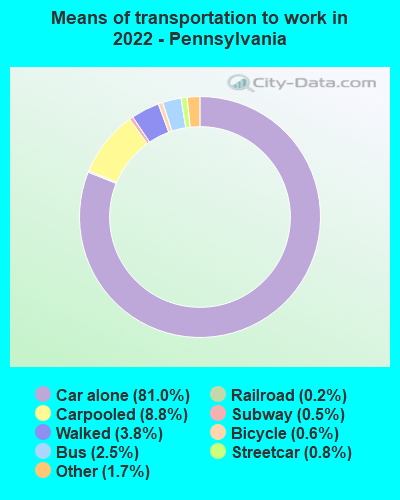
Drove car alone:
| Scranton: | 86.2% (31,318) |
| Pennsylvania: | 81.0% (1,982,533) |
Carpooled:
| Scranton: | 7.9% (2,880) |
| Pennsylvania: | 8.8% (224,687) |
Bus:
| Scranton: | 0.8% (273) |
| Pennsylvania: | 2.5% (70,902) |
Long-distance train or commuter rail:
| Scranton: | 0.0% (2) |
| Pennsylvania: | 0.5% (12,692) |
Bicycle:
| Scranton: | 0.1% (49) |
| Pennsylvania: | 0.6% (11,632) |
Walked:
| Scranton: | 4.3% (1,562) |
| Pennsylvania: | 3.8% (101,672) |
Other means:
| Scranton: | 0.7% (247) |
| Pennsylvania: | 1.7% (40,804) |


Drove car alone:
| Scranton: | 74.2% (23,773) |
| Pennsylvania: | 76.5% (4,247,836) |
Carpooled:
| Scranton: | 14.8% (4,752) |
| Pennsylvania: | 10.4% (577,364) |
Bus or trolley bus:
| Scranton: | 1.4% (460) |
| Pennsylvania: | 3.6% (198,036) |
Subway or elevated:
| Scranton: | 0.0% (6) |
| Pennsylvania: | 0.6% (34,724) |
Taxicab:
| Scranton: | 0.4% (114) |
| Pennsylvania: | 0.1% (4,870) |
Motorcycle:
| Scranton: | 0.0% (10) |
| Pennsylvania: | 0.1% (3,235) |
Bicycle:
| Scranton: | 0.1% (36) |
| Pennsylvania: | 0.3% (14,001) |
Walked:
| Scranton: | 6.9% (2,217) |
| Pennsylvania: | 4.1% (229,725) |
Other means:
| Scranton: | 0.5% (176) |
| Pennsylvania: | 0.5% (29,805) |

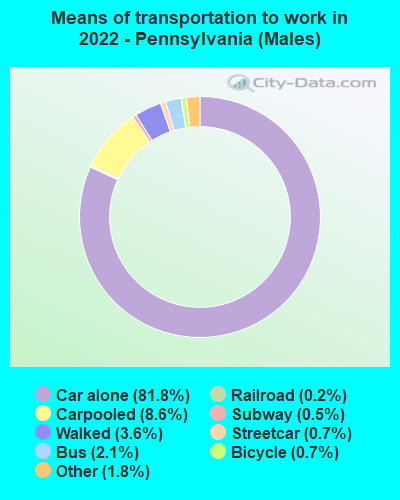
Drove car alone - Males:
| Scranton: | 85.9% (15,153) |
| Pennsylvania: | 81.8% (1,982,533) |
Carpooled - Males:
| Scranton: | 7.9% (1,400) |
| Pennsylvania: | 8.6% (224,687) |
Bus - Males:
| Scranton: | 0.7% (120) |
| Pennsylvania: | 2.1% (70,902) |
Long-distance train or commuter rail - Males:
| Scranton: | 0.0% (2) |
| Pennsylvania: | 0.5% (12,692) |
Bicycle - Males:
| Scranton: | 0.3% (49) |
| Pennsylvania: | 0.7% (11,632) |
Walked - Males:
| Scranton: | 4.2% (744) |
| Pennsylvania: | 3.6% (101,672) |
Other means - Males:
| Scranton: | 0.9% (163) |
| Pennsylvania: | 1.8% (40,804) |

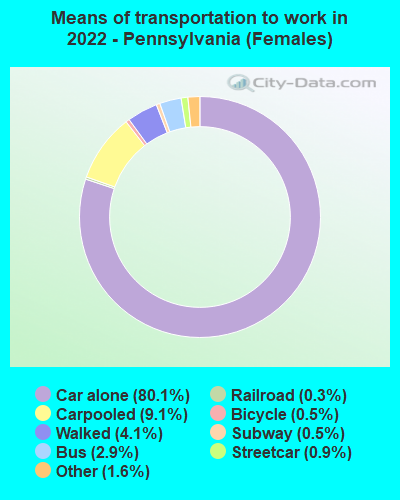
Drove car alone - Females:
| Scranton: | 86.4% (16,168) |
| Pennsylvania: | 80.1% (1,982,533) |
Carpooled - Females:
| Scranton: | 7.9% (1,480) |
| Pennsylvania: | 9.1% (224,687) |
Bus - Females:
| Scranton: | 0.8% (152) |
| Pennsylvania: | 2.9% (70,902) |
Walked - Females:
| Scranton: | 4.4% (818) |
| Pennsylvania: | 4.1% (101,672) |
Other means - Females:
| Scranton: | 0.5% (84) |
| Pennsylvania: | 1.6% (40,804) |
Private vehicle occupancy

Drove alone:
| Scranton: | 82.5% (23,875) |
| Pennsylvania: | 90.2% (4,322,003) |
In 2 person carpool:
| Scranton: | 14.5% (4,209) |
| Pennsylvania: | 7.7% (367,639) |
In 3 person carpool:
| Scranton: | 1.2% (355) |
| Pennsylvania: | 1.2% (57,942) |
In 4 person carpool:
| Scranton: | 0.5% (148) |
| Pennsylvania: | 0.5% (23,156) |
In 5-6 person carpool:
| Scranton: | 1.2% (354) |
| Pennsylvania: | 0.3% (13,205) |
In 7+ person carpool:
| Scranton: | 0.0% (8) |
| Pennsylvania: | 0.1% (7,065) |

Drove alone:
| Scranton: | 83.3% (23,773) |
| Pennsylvania: | 88.0% (4,247,836) |
In 2 person carpool:
| Scranton: | 13.3% (3,793) |
| Pennsylvania: | 9.7% (470,174) |
In 3 person carpool:
| Scranton: | 1.9% (543) |
| Pennsylvania: | 1.4% (67,610) |
In 4 person carpool:
| Scranton: | 0.9% (266) |
| Pennsylvania: | 0.5% (22,718) |
In 5-6 person carpool:
| Scranton: | 0.2% (63) |
| Pennsylvania: | 0.2% (9,833) |
In 7+ person carpool:
| Scranton: | 0.3% (87) |
| Pennsylvania: | 0.1% (7,029) |
Class of workers
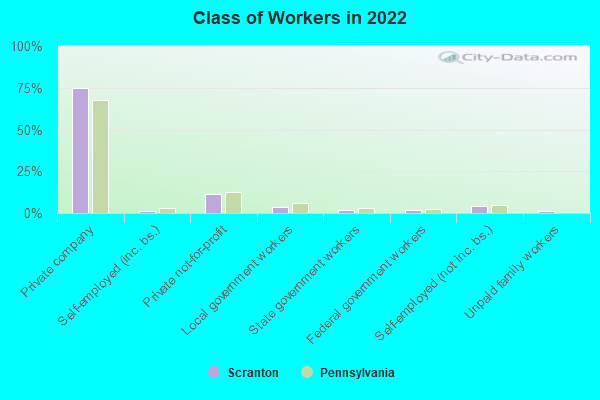
Employee of private company:
| Scranton: | 74.7% (26,225) |
| Pennsylvania: | 67.7% (4,333,849) |
Self-employed in own incorporated business:
| Scranton: | 1.0% (347) |
| Pennsylvania: | 3.2% (202,029) |
Private not-for-profit wage and salary workers:
| Scranton: | 11.7% (4,091) |
| Pennsylvania: | 12.7% (810,562) |
Local government workers:
| Scranton: | 3.8% (1,321) |
| Pennsylvania: | 6.2% (397,120) |
State government workers:
| Scranton: | 2.1% (724) |
| Pennsylvania: | 3.0% (193,490) |
Federal government workers:
| Scranton: | 1.7% (613) |
| Pennsylvania: | 2.1% (136,008) |
Self-employed workers in own not incorporated business:
| Scranton: | 4.1% (1,441) |
| Pennsylvania: | 5.0% (318,118) |
Unpaid family workers:
| Scranton: | 0.9% (333) |
| Pennsylvania: | 0.2% (11,066) |

Employee of private company:
| Scranton: | 69.5% (22,789) |
| Pennsylvania: | 69.7% (3,942,119) |
Self-employed in own incorporated business:
| Scranton: | 1.6% (533) |
| Pennsylvania: | 2.4% (134,871) |
Private not-for-profit wage and salary workers:
| Scranton: | 11.5% (3,766) |
| Pennsylvania: | 10.3% (580,382) |
Local government workers:
| Scranton: | 7.4% (2,423) |
| Pennsylvania: | 5.8% (326,222) |
State government workers:
| Scranton: | 3.2% (1,034) |
| Pennsylvania: | 3.2% (182,232) |
Federal government workers:
| Scranton: | 1.8% (596) |
| Pennsylvania: | 2.3% (130,634) |
Self-employed workers in own not incorporated business:
| Scranton: | 4.5% (1,482) |
| Pennsylvania: | 6.0% (339,631) |
Unpaid family workers:
| Scranton: | 0.5% (159) |
| Pennsylvania: | 0.3% (17,409) |

Employee of private company - Males:
| Scranton: | 77.7% (13,729) |
| Pennsylvania: | 71.5% (2,388,579) |
Self-employed in own incorporated business - Males:
| Scranton: | 1.1% (186) |
| Pennsylvania: | 4.0% (134,437) |
Private not-for-profit wage and salary workers - Males:
| Scranton: | 6.8% (1,203) |
| Pennsylvania: | 8.1% (270,498) |
Local government workers - Males:
| Scranton: | 4.7% (828) |
| Pennsylvania: | 5.0% (168,310) |
State government workers - Males:
| Scranton: | 1.5% (260) |
| Pennsylvania: | 2.9% (97,540) |
Federal government workers - Males:
| Scranton: | 1.8% (313) |
| Pennsylvania: | 2.2% (75,158) |
Self-employed workers in own not incorporated business - Males:
| Scranton: | 5.5% (969) |
| Pennsylvania: | 6.0% (199,421) |
Unpaid family workers - Males:
| Scranton: | 1.0% (170) |
| Pennsylvania: | 0.2% (6,704) |

Employee of private company - Females:
| Scranton: | 71.7% (12,496) |
| Pennsylvania: | 63.5% (1,945,270) |
Self-employed in own incorporated business - Females:
| Scranton: | 0.9% (161) |
| Pennsylvania: | 2.2% (67,592) |
Private not-for-profit wage and salary workers - Females:
| Scranton: | 16.6% (2,888) |
| Pennsylvania: | 17.6% (540,064) |
Local government workers - Females:
| Scranton: | 2.8% (493) |
| Pennsylvania: | 7.5% (228,810) |
State government workers - Females:
| Scranton: | 2.7% (464) |
| Pennsylvania: | 3.1% (95,950) |
Federal government workers - Females:
| Scranton: | 1.7% (300) |
| Pennsylvania: | 2.0% (60,850) |
Self-employed workers in own not incorporated business - Females:
| Scranton: | 2.7% (472) |
| Pennsylvania: | 3.9% (118,697) |
Unpaid family workers - Females:
| Scranton: | 0.9% (163) |
| Pennsylvania: | 0.1% (4,362) |