Work and Jobs in Snoqualmie Valley, Washington (WA) Detailed Stats
Occupations, Industries, Unemployment, Workers, Commute
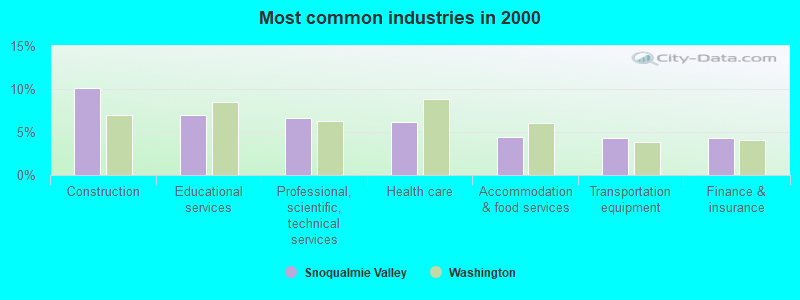
The most common industries in Snoqualmie Valley are: Construction (10.1% of civilian employees), Educational services (7.0% of civilian employees), Professional, scientific, technical services (6.7% of civilian employees). 71.4% of workers are employees of private companies, which is 7.6% greater than the rate of 66.0% across the entire state of Washington.
Most common industries
Most common industries | |||
|---|---|---|---|
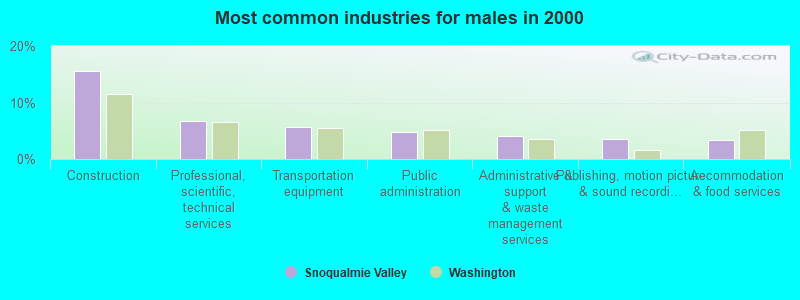
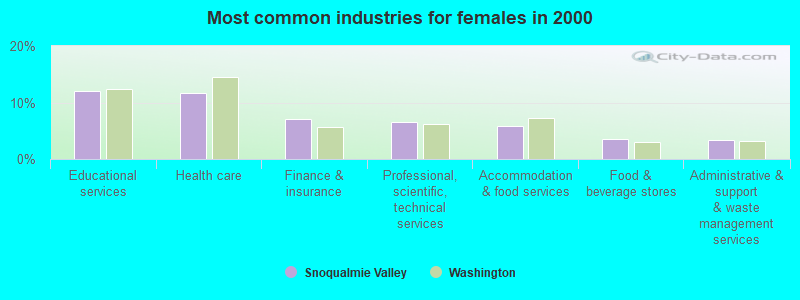
Industry | All | Males | Females |
| Construction | 10.1% (1,990) | 15.5% (1,725) | 3.1% (265) |
| Educational services | 7.0% (1,368) | 3.1% (341) | 12.0% (1,027) |
| Professional, scientific, and technical services | 6.7% (1,310) | 6.7% (748) | 6.6% (562) |
| Health care | 6.2% (1,216) | 2.0% (220) | 11.6% (996) |
| Accommodation and food services | 4.5% (879) | 3.4% (380) | 5.8% (499) |
| Transportation equipment | 4.3% (851) | 5.7% (632) | 2.6% (219) |
| Finance and insurance | 4.3% (848) | 2.2% (248) | 7.0% (600) |
| Public administration | 4.1% (804) | 4.9% (539) | 3.1% (265) |
| Administrative and support and waste management services | 3.7% (727) | 4.0% (445) | 3.3% (282) |
| Food and beverage stores | 3.2% (638) | 3.0% (337) | 3.5% (301) |
| Broadcasting and telecommunications | 2.9% (576) | 3.1% (345) | 2.7% (231) |
| Publishing, and motion picture and sound recording industries | 2.7% (522) | 3.6% (401) | 1.4% (121) |
| Real estate and rental and leasing | 2.2% (426) | 2.6% (292) | 1.6% (134) |
| Computer and electronic products | 2.0% (389) | 2.2% (248) | 1.6% (141) |
| Arts, entertainment, and recreation | 1.9% (364) | 1.8% (201) | 1.9% (163) |
| Miscellaneous manufacturing | 1.7% (343) | 1.8% (196) | 1.7% (147) |
| Social assistance | 1.7% (335) | 0.6% (64) | 3.2% (271) |
| Agriculture, forestry, fishing and hunting | 1.7% (334) | 2.5% (279) | 0.6% (55) |
| Motor vehicle and parts dealers | 1.4% (273) | 1.8% (202) | 0.8% (71) |
| Other transportation, and support activities, and couriers | 1.4% (271) | 1.7% (193) | 0.9% (78) |
| Radio, TV, and computer stores | 1.4% (268) | 1.6% (176) | 1.1% (92) |
| Clothing and accessories, including shoe, stores | 1.3% (253) | 1.0% (109) | 1.7% (144) |
| Repair and maintenance | 1.2% (245) | 1.9% (213) | 0.4% (32) |
| Building material and garden equipment and supplies dealers | 1.2% (243) | 1.5% (169) | 0.9% (74) |
| Department and other general merchandise stores | 1.2% (236) | 0.8% (84) | 1.8% (152) |
| Data processing, libraries, and other information services | 1.1% (212) | 1.0% (107) | 1.2% (105) |
| Religious, grantmaking, civic, professional, and similar organizations | 1.0% (206) | 0.9% (104) | 1.2% (102) |
| Personal and laundry services | 1.0% (189) | 0.4% (43) | 1.7% (146) |
| Printing and related support activities | 0.9% (175) | 1.1% (121) | 0.6% (54) |
| Groceries and related products merchant wholesalers | 0.9% (175) | 0.9% (97) | 0.9% (78) |
| Utilities | 0.9% (174) | 1.1% (117) | 0.7% (57) |
| Metal and metal products | 0.7% (143) | 1.1% (120) | 0.3% (23) |
| Other direct selling establishments | 0.7% (131) | 0.6% (64) | 0.8% (67) |
| Wood products | 0.6% (124) | 0.9% (105) | 0.2% (19) |
| Food | 0.6% (124) | 0.8% (84) | 0.5% (40) |
| Professional and commercial equipment and supplies merchant wholesalers | 0.6% (124) | 0.9% (98) | 0.3% (26) |
| Machinery | 0.6% (124) | 0.8% (93) | 0.4% (31) |
| Private households | 0.6% (119) | 0.0% (4) | 1.3% (115) |
| Miscellaneous nondurable goods merchant wholesalers | 0.5% (108) | 0.6% (71) | 0.4% (37) |
| Lumber and other construction materials merchant wholesalers | 0.5% (105) | 0.8% (84) | 0.2% (21) |
| Used merchandise, gift, novelty, and souvenir, and other miscellaneous stores | 0.5% (103) | 0.1% (12) | 1.1% (91) |
| Air transportation | 0.5% (97) | 0.5% (59) | 0.4% (38) |
| Furniture and home furnishings, and household appliance stores | 0.4% (85) | 0.3% (30) | 0.6% (55) |
| Beverage and tobacco products | 0.4% (83) | 0.7% (83) | 0.0% (0) |
| Truck transportation | 0.4% (83) | 0.7% (80) | 0.0% (3) |
| Apparel, fabrics, and notions merchant wholesalers | 0.4% (79) | 0.0% (0) | 0.9% (79) |
| Machinery, equipment, and supplies merchant wholesalers | 0.4% (77) | 0.3% (34) | 0.5% (43) |
| Sporting goods, camera, and hobby and toy stores | 0.4% (73) | 0.6% (63) | 0.1% (10) |
| U. S. Postal service | 0.4% (69) | 0.3% (38) | 0.4% (31) |
| Gasoline stations | 0.3% (61) | 0.4% (45) | 0.2% (16) |
| Nonmetallic mineral products | 0.3% (59) | 0.5% (56) | 0.0% (3) |
| Furniture and related product manufacturing | 0.3% (59) | 0.5% (58) | 0.0% (1) |
| Electrical and electronic goods merchant wholesalers | 0.3% (58) | 0.3% (36) | 0.3% (22) |
| Pharmacies and drug stores | 0.3% (55) | 0.1% (11) | 0.5% (44) |
| Electrical equipment, appliances, and components | 0.3% (52) | 0.3% (37) | 0.2% (15) |
| Miscellaneous durable goods merchant wholesalers | 0.2% (49) | 0.1% (15) | 0.4% (34) |
| Water transportation | 0.2% (42) | 0.4% (42) | 0.0% (0) |
| Rail transportation | 0.2% (41) | 0.4% (41) | 0.0% (0) |
| Electronic shopping and mail-order houses | 0.2% (39) | 0.2% (23) | 0.2% (16) |
| Office supplies and stationery stores | 0.2% (36) | 0.2% (23) | 0.2% (13) |
| Textile mills and textile products | 0.2% (30) | 0.2% (17) | 0.2% (13) |
| Chemicals | 0.2% (30) | 0.2% (22) | 0.1% (8) |
| Management of companies and enterprises | 0.1% (28) | 0.2% (25) | 0.0% (3) |
| Warehousing and storage | 0.1% (26) | 0.1% (10) | 0.2% (16) |
| Hardware, plumbing and heating equipment, and supplies merchant wholesalers | 0.1% (25) | 0.2% (25) | 0.0% (0) |
| Alcoholic beverages merchant wholesalers | 0.1% (23) | 0.1% (11) | 0.1% (12) |
| Paper | 0.1% (23) | 0.1% (11) | 0.1% (12) |
| Paper and paper products merchant wholesalers | 0.1% (22) | 0.1% (8) | 0.2% (14) |
| Recyclable material merchant wholesalers | 0.1% (22) | 0.2% (22) | 0.0% (0) |
| Plastics and rubber products | 0.1% (22) | 0.1% (6) | 0.2% (16) |
| Jewelry, luggage, and leather goods stores | 0.1% (21) | 0.0% (0) | 0.2% (21) |
| Book stores and news dealers | 0.1% (21) | 0.1% (7) | 0.2% (14) |
| Farm supplies merchant wholesalers | 0.1% (17) | 0.2% (17) | 0.0% (0) |
Unemployment in Snoqualmie Valley
- Unemployment by race in 2000
- Unemployment rate for White non-Hispanic residents
- 3.6%Males
- 2.7%Females
- Unemployment rate for American Indian and Alaska Native residents
- 19.7%Males
- 13.3%Females
- Unemployment rate for Asian residents
- 5.0%Males
- 8.5%Females
- Unemployment rate for two or more race residents
- 3.9%Males
- 3.1%Females
- Unemployment rate for Hispanic or Latino residents
- 1.9%Males
- 2.2%Females
Time leaving home to go to work

<5am:
| Snoqualmie Valley: | 4.4% (849) |
| Washington: | 4.2% (115,997) |
5:30am:
| Snoqualmie Valley: | 4.6% (882) |
| Washington: | 3.7% (102,868) |
6am:
| Snoqualmie Valley: | 5.3% (1,013) |
| Washington: | 5.3% (147,812) |
6:30am:
| Snoqualmie Valley: | 12.2% (2,344) |
| Washington: | 8.9% (248,462) |
7am:
| Snoqualmie Valley: | 12.8% (2,466) |
| Washington: | 10.3% (288,005) |
7:30am:
| Snoqualmie Valley: | 14.3% (2,752) |
| Washington: | 13.5% (375,030) |
8am:
| Snoqualmie Valley: | 9.3% (1,796) |
| Washington: | 13.4% (372,576) |
8:30am:
| Snoqualmie Valley: | 8.4% (1,629) |
| Washington: | 9.0% (252,058) |
9am:
| Snoqualmie Valley: | 4.5% (869) |
| Washington: | 5.1% (141,936) |
10am:
| Snoqualmie Valley: | 5.8% (1,117) |
| Washington: | 5.8% (161,204) |
11am:
| Snoqualmie Valley: | 2.2% (415) |
| Washington: | 2.5% (70,123) |
12pm:
| Snoqualmie Valley: | 1.3% (257) |
| Washington: | 1.3% (35,612) |
4pm:
| Snoqualmie Valley: | 5.9% (1,131) |
| Washington: | 6.8% (190,565) |
>4pm:
| Snoqualmie Valley: | 3.9% (757) |
| Washington: | 5.8% (162,401) |
Travel time to work


Less than 5 minutes:
| Snoqualmie Valley: | 2.9% (562) |
| Washington: | 3.3% (91,132) |
5 to 9 minutes:
| Snoqualmie Valley: | 6.6% (1,276) |
| Washington: | 10.3% (286,517) |
10 to 14 minutes:
| Snoqualmie Valley: | 6.7% (1,287) |
| Washington: | 14.1% (391,606) |
15 to 19 minutes:
| Snoqualmie Valley: | 6.5% (1,244) |
| Washington: | 15.0% (418,990) |
20 to 24 minutes:
| Snoqualmie Valley: | 7.6% (1,466) |
| Washington: | 14.2% (394,209) |
25 to 29 minutes:
| Snoqualmie Valley: | 5.1% (992) |
| Washington: | 5.8% (162,590) |
30 to 34 minutes:
| Snoqualmie Valley: | 15.9% (3,058) |
| Washington: | 12.5% (348,311) |
35 to 39 minutes:
| Snoqualmie Valley: | 6.5% (1,254) |
| Washington: | 2.6% (73,592) |
40 to 44 minutes:
| Snoqualmie Valley: | 9.4% (1,817) |
| Washington: | 3.4% (95,182) |
45 to 59 minutes:
| Snoqualmie Valley: | 17.8% (3,424) |
| Washington: | 7.0% (195,343) |
60 to 89 minutes:
| Snoqualmie Valley: | 7.5% (1,451) |
| Washington: | 4.7% (131,691) |
90 or more minutes:
| Snoqualmie Valley: | 2.3% (446) |
| Washington: | 2.7% (75,486) |
Means of transportation to work


Drove car alone:
| Snoqualmie Valley: | 78.4% (15,110) |
| Washington: | 73.3% (2,040,833) |
Carpooled:
| Snoqualmie Valley: | 12.3% (2,373) |
| Washington: | 12.8% (357,742) |
Bus or trolley bus:
| Snoqualmie Valley: | 1.3% (259) |
| Washington: | 4.5% (124,450) |
Ferryboat:
| Snoqualmie Valley: | 0.0% (8) |
| Washington: | 0.3% (8,923) |
Motorcycle:
| Snoqualmie Valley: | 0.1% (28) |
| Washington: | 0.2% (4,353) |
Bicycle:
| Snoqualmie Valley: | 0.1% (13) |
| Washington: | 0.6% (16,205) |
Walked:
| Snoqualmie Valley: | 1.9% (372) |
| Washington: | 3.2% (89,739) |
Other means:
| Snoqualmie Valley: | 0.6% (114) |
| Washington: | 0.7% (19,499) |
Private vehicle occupancy

Drove alone:
| Snoqualmie Valley: | 86.4% (15,110) |
| Washington: | 85.1% (2,040,833) |
In 2 person carpool:
| Snoqualmie Valley: | 11.2% (1,960) |
| Washington: | 11.8% (282,638) |
In 3 person carpool:
| Snoqualmie Valley: | 1.7% (292) |
| Washington: | 1.9% (44,791) |
In 4 person carpool:
| Snoqualmie Valley: | 0.5% (80) |
| Washington: | 0.6% (14,195) |
In 5-6 person carpool:
| Snoqualmie Valley: | 0.2% (27) |
| Washington: | 0.3% (7,914) |
In 7+ person carpool:
| Snoqualmie Valley: | 0.1% (14) |
| Washington: | 0.3% (8,204) |
Class of workers
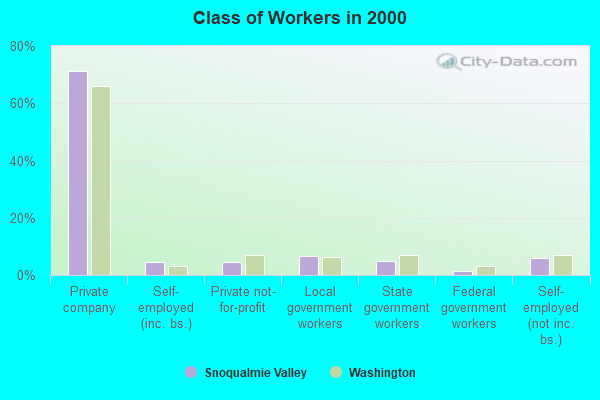
Employee of private company:
| Snoqualmie Valley: | 71.4% (14,038) |
| Washington: | 66.0% (1,843,000) |
Self-employed in own incorporated business:
| Snoqualmie Valley: | 4.5% (881) |
| Washington: | 3.2% (90,102) |
Private not-for-profit wage and salary workers:
| Snoqualmie Valley: | 4.7% (922) |
| Washington: | 6.9% (191,927) |
Local government workers:
| Snoqualmie Valley: | 6.6% (1,297) |
| Washington: | 6.4% (178,161) |
State government workers:
| Snoqualmie Valley: | 5.0% (975) |
| Washington: | 6.9% (192,408) |
Federal government workers:
| Snoqualmie Valley: | 1.4% (285) |
| Washington: | 3.2% (89,153) |
Self-employed workers in own not incorporated business:
| Snoqualmie Valley: | 6.0% (1,190) |
| Washington: | 7.2% (199,827) |
Unpaid family workers:
| Snoqualmie Valley: | 0.4% (83) |
| Washington: | 0.3% (9,144) |

Employee of private company - Males:
| Snoqualmie Valley: | 74.8% (8,311) |
| Washington: | 69.7% (1,044,674) |
Self-employed in own incorporated business - Males:
| Snoqualmie Valley: | 5.7% (629) |
| Washington: | 4.3% (64,169) |
Private not-for-profit wage and salary workers - Males:
| Snoqualmie Valley: | 2.7% (299) |
| Washington: | 4.2% (63,257) |
Local government workers - Males:
| Snoqualmie Valley: | 6.6% (729) |
| Washington: | 5.3% (79,844) |
State government workers - Males:
| Snoqualmie Valley: | 2.8% (308) |
| Washington: | 5.1% (76,834) |
Federal government workers - Males:
| Snoqualmie Valley: | 1.4% (155) |
| Washington: | 3.5% (52,763) |
Self-employed workers in own not incorporated business - Males:
| Snoqualmie Valley: | 5.8% (650) |
| Washington: | 7.6% (114,199) |
Unpaid family workers - Males:
| Snoqualmie Valley: | 0.3% (32) |
| Washington: | 0.3% (3,889) |

Employee of private company - Females:
| Snoqualmie Valley: | 66.9% (5,727) |
| Washington: | 61.7% (798,326) |
Self-employed in own incorporated business - Females:
| Snoqualmie Valley: | 2.9% (252) |
| Washington: | 2.0% (25,933) |
Private not-for-profit wage and salary workers - Females:
| Snoqualmie Valley: | 7.3% (623) |
| Washington: | 9.9% (128,670) |
Local government workers - Females:
| Snoqualmie Valley: | 6.6% (568) |
| Washington: | 7.6% (98,317) |
State government workers - Females:
| Snoqualmie Valley: | 7.8% (667) |
| Washington: | 8.9% (115,574) |
Federal government workers - Females:
| Snoqualmie Valley: | 1.5% (130) |
| Washington: | 2.8% (36,390) |
Self-employed workers in own not incorporated business - Females:
| Snoqualmie Valley: | 6.3% (540) |
| Washington: | 6.6% (85,628) |
Unpaid family workers - Females:
| Snoqualmie Valley: | 0.6% (51) |
| Washington: | 0.4% (5,255) |