Work and Jobs in Vancouver, Washington (WA) Detailed Stats
Occupations, Industries, Unemployment, Workers, Commute
Settings
X


Recent posts about work in Vancouver, Washington on our local forum with over 2,400,000 registered users:

Latest news about work in Vancouver, WA collected exclusively by city-data.com from local newspapers, TV, and radio stations
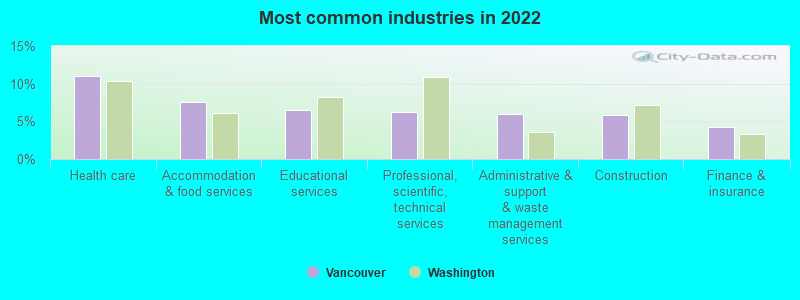
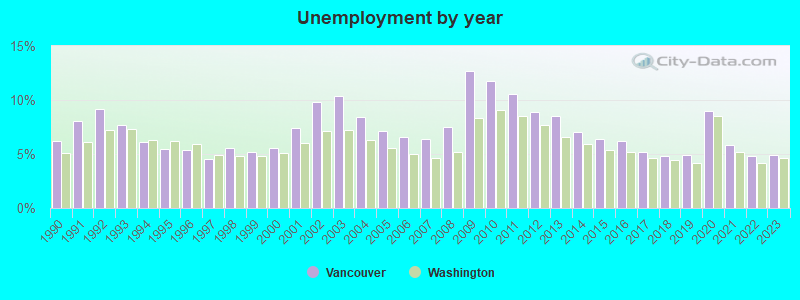
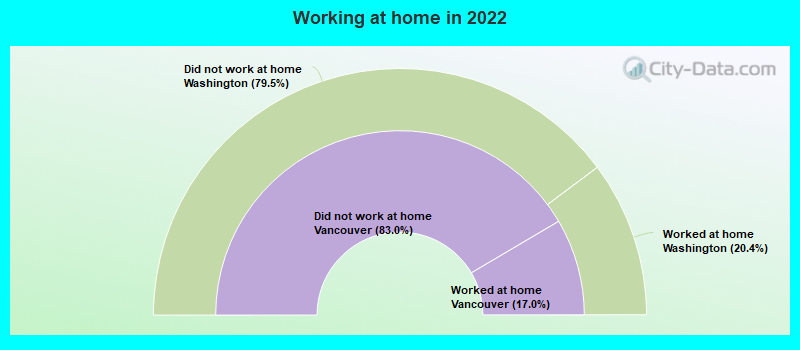
The unemployment rate in 2023 in Vancouver, WA was 4.9%, which was 6.1% greater than the unemployment rate of 4.6% across the entire state of Washington. Compared to the unemployment rate of 8.5% in 2013, this represents a decrease of 73.5%. According to 2022 data, the most common industries in Vancouver are: Health care (11.0% of civilian employees), Accommodation & food services (7.6% of civilian employees), Educational services (6.6% of civilian employees). 73.7% of workers work in Clark County and 17.0% of all workers work at home. 69.6% of workers are employees of private companies, which is 5.1% greater than the rate of 66.0% across the entire state of Washington.
Whole page based on the data from 2000 / 2022 when the population of Vancouver, Washington was 143,560 / 194,509
Whole page based on the data from 2000 / 2022 when the population of Vancouver, Washington was 143,560 / 194,509
Most common industries


Most common industries | Most common industries | |||||
|---|---|---|---|---|---|---|
Industry | All | Males | Females | All | Males | Females |
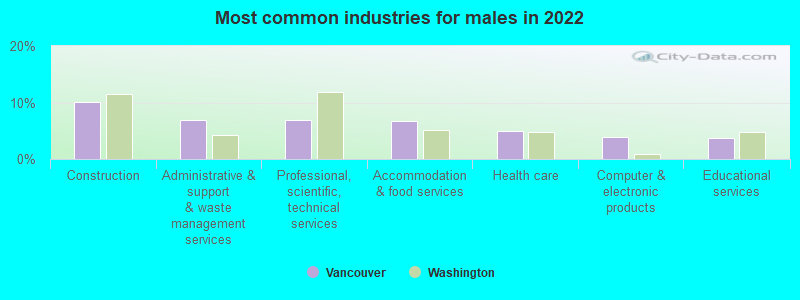
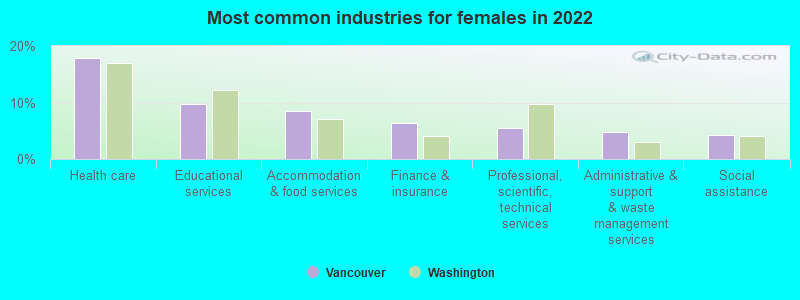
| Health care | 11.0% (9,645) | 5.0% (2,321) | 17.9% (7,324) | 8.3% (5,649) | 2.9% (1,062) | 14.6% (4,587) |
| Accommodation and food services | 7.6% (6,674) | 6.8% (3,178) | 8.6% (3,496) | 7.4% (4,996) | 5.5% (1,995) | 9.6% (3,001) |
| Educational services | 6.6% (5,740) | 3.7% (1,747) | 9.8% (3,993) | 6.4% (4,358) | 3.4% (1,250) | 9.9% (3,108) |
| Professional, scientific, and technical services | 6.3% (5,508) | 6.9% (3,236) | 5.6% (2,272) | 4.4% (3,003) | 4.4% (1,582) | 4.5% (1,421) |
| Administrative and support and waste management services | 6.0% (5,231) | 7.0% (3,253) | 4.8% (1,978) | 3.8% (2,573) | 3.9% (1,406) | 3.7% (1,167) |
| Construction | 5.9% (5,166) | 10.1% (4,726) | 1.1% (440) | 6.7% (4,564) | 11.2% (4,051) | 1.6% (513) |
| Finance and insurance | 4.3% (3,741) | 2.5% (1,150) | 6.3% (2,591) | 3.7% (2,529) | 2.2% (792) | 5.5% (1,737) |
| Public administration | 3.1% (2,701) | 3.1% (1,435) | 3.1% (1,266) | 3.5% (2,364) | 3.1% (1,144) | 3.9% (1,220) |
| Computer and electronic products | 3.0% (2,617) | 4.0% (1,851) | 1.9% (766) | 4.9% (3,288) | 5.9% (2,141) | 3.7% (1,147) |
| Food and beverage stores | 2.5% (2,233) | 1.9% (899) | 3.3% (1,334) | 2.3% (1,535) | 2.3% (820) | 2.3% (715) |
| Social assistance | 2.5% (2,176) | 0.9% (419) | 4.3% (1,757) | 1.8% (1,244) | 0.5% (176) | 3.4% (1,068) |
| Other transportation, and support activities, and couriers | 2.3% (2,024) | 3.0% (1,404) | 1.5% (620) | 1.9% (1,286) | 2.6% (935) | 1.1% (351) |
| Real estate and rental and leasing | 2.3% (2,021) | 2.3% (1,073) | 2.3% (948) | 2.5% (1,716) | 2.4% (863) | 2.7% (853) |
| Arts, entertainment, and recreation | 2.1% (1,825) | 1.9% (874) | 2.3% (951) | 1.1% (739) | 1.1% (398) | 1.1% (341) |
| Department and other general merchandise stores | 2.1% (1,803) | 1.9% (889) | 2.2% (914) | 2.0% (1,377) | 1.3% (470) | 2.9% (907) |
| Truck transportation | 2.0% (1,760) | 3.0% (1,415) | 0.8% (345) | 2.0% (1,356) | 3.2% (1,164) | 0.6% (192) |
| Personal and laundry services | 1.9% (1,633) | 1.0% (483) | 2.8% (1,150) | 1.3% (899) | 0.5% (187) | 2.3% (712) |
| Repair and maintenance | 1.7% (1,460) | 2.8% (1,306) | 0.4% (154) | 1.5% (1,020) | 2.5% (900) | 0.4% (120) |
| Transportation equipment | 1.5% (1,310) | 2.0% (914) | 1.0% (396) | 1.9% (1,254) | 2.7% (968) | 0.9% (286) |
| Broadcasting and telecommunications | 1.5% (1,304) | 1.6% (726) | 1.4% (578) | 1.7% (1,136) | 1.7% (625) | 1.6% (511) |
| Metal and metal products | 1.2% (1,050) | 2.1% (1,000) | 0.1% (50) | 2.0% (1,370) | 3.2% (1,159) | 0.7% (211) |
| Motor vehicle and parts dealers | 1.2% (1,011) | 1.8% (841) | 0.4% (170) | 1.7% (1,128) | 2.4% (867) | 0.8% (261) |
| Air transportation | 1.1% (951) | 1.2% (556) | 1.0% (395) | 1.9% (1,291) | 2.2% (798) | 1.6% (493) |
| Religious, grantmaking, civic, professional, and similar organizations | 1.1% (933) | 0.6% (277) | 1.6% (656) | 1.3% (859) | 1.1% (411) | 1.4% (448) |
| Building material and garden equipment and supplies dealers | 1.1% (921) | 1.5% (710) | 0.5% (211) | 0.9% (597) | 1.2% (442) | 0.5% (155) |
| Private households | 1.0% (905) | 0.3% (157) | 1.8% (748) | 0.6% (373) | 0.1% (43) | 1.1% (330) |
| Food | 0.9% (776) | 1.1% (505) | 0.7% (271) | 0.8% (571) | 1.0% (351) | 0.7% (220) |
| Chemicals | 0.9% (753) | 1.2% (542) | 0.5% (211) | 0.5% (369) | 0.6% (225) | 0.5% (144) |
| Utilities | 0.8% (723) | 1.3% (598) | 0.3% (125) | 0.8% (549) | 0.8% (294) | 0.8% (255) |
| Groceries and related products merchant wholesalers | 0.8% (714) | 1.1% (523) | 0.5% (191) | 0.6% (384) | 0.9% (334) | 0.2% (50) |
| Clothing and accessories, including shoe, stores | 0.8% (685) | 0.3% (158) | 1.3% (527) | 0.4% (272) | 0.2% (90) | 0.6% (182) |
| Miscellaneous manufacturing | 0.8% (664) | 0.9% (399) | 0.6% (265) | 1.2% (783) | 1.3% (477) | 1.0% (306) |
| Paper | 0.7% (616) | 1.1% (511) | 0.3% (105) | 1.4% (964) | 1.9% (680) | 0.9% (284) |
| Used merchandise, gift, novelty, and souvenir, and other miscellaneous stores | 0.7% (615) | 0.4% (185) | 1.1% (430) | 0.7% (501) | 0.5% (187) | 1.0% (314) |
| Machinery | 0.7% (609) | 0.9% (404) | 0.5% (205) | 0.8% (560) | 1.3% (463) | 0.3% (97) |
| Radio, TV, and computer stores | 0.7% (589) | 1.0% (491) | 0.2% (98) | 1.0% (670) | 1.0% (379) | 0.9% (291) |
| Publishing, and motion picture and sound recording industries | 0.6% (525) | 0.8% (388) | 0.3% (137) | 0.9% (580) | 0.9% (333) | 0.8% (247) |
| U. S. Postal service | 0.6% (494) | 0.8% (355) | 0.3% (139) | 0.5% (359) | 0.6% (206) | 0.5% (153) |
| Gasoline stations | 0.5% (467) | 0.5% (234) | 0.6% (233) | 0.3% (182) | 0.3% (91) | 0.3% (91) |
| Nonmetallic mineral products | 0.5% (444) | 0.8% (395) | 0.1% (49) | 0.5% (371) | 0.9% (327) | 0.1% (44) |
| Pharmacies and drug stores | 0.5% (437) | 0.4% (197) | 0.6% (240) | 0.4% (277) | 0.2% (62) | 0.7% (215) |
| Wood products | 0.5% (421) | 0.8% (382) | 0.1% (39) | 0.4% (279) | 0.7% (258) | 0.1% (21) |
| Health and personal care, except drug, stores | 0.4% (394) | 0.3% (134) | 0.6% (260) | 0.2% (122) | 0.1% (33) | 0.3% (89) |
| Agriculture, forestry, fishing and hunting | 0.4% (352) | 0.6% (280) | 0.2% (72) | 0.6% (423) | 0.8% (305) | 0.4% (118) |
| Other direct selling establishments | 0.4% (327) | 0.2% (95) | 0.6% (232) | 0.6% (436) | 0.7% (254) | 0.6% (182) |
| Sporting goods, camera, and hobby and toy stores | 0.3% (273) | 0.4% (166) | 0.3% (107) | 0.5% (364) | 0.5% (164) | 0.6% (200) |
| Machinery, equipment, and supplies merchant wholesalers | 0.3% (271) | 0.4% (185) | 0.2% (86) | 0.8% (519) | 1.0% (366) | 0.5% (153) |
| Printing and related support activities | 0.3% (241) | 0.4% (198) | 0.1% (43) | 0.5% (344) | 0.7% (253) | 0.3% (91) |
| Electrical equipment, appliances, and components | 0.3% (221) | 0.3% (125) | 0.2% (96) | 0.3% (235) | 0.5% (174) | 0.2% (61) |
| Electronic shopping and mail-order houses | 0.3% (220) | 0.3% (137) | 0.2% (83) | 0.2% (134) | 0.2% (70) | 0.2% (64) |
| Furniture and home furnishings, and household appliance stores | 0.2% (211) | 0.3% (123) | 0.2% (88) | 0.7% (496) | 0.9% (322) | 0.6% (174) |
| Furniture and related product manufacturing | 0.2% (210) | 0.4% (186) | 0.1% (24) | 0.4% (298) | 0.7% (254) | 0.1% (44) |
| Book stores and news dealers | 0.2% (205) | 0.3% (161) | 0.1% (44) | 0.1% (85) | 0.1% (42) | 0.1% (43) |
| Hardware, plumbing and heating equipment, and supplies merchant wholesalers | 0.2% (182) | 0.3% (123) | 0.1% (59) | 0.2% (108) | 0.3% (99) | 0.0% (9) |
| Rail transportation | 0.2% (181) | 0.4% (181) | 0.0% (0) | 0.4% (268) | 0.7% (246) | 0.1% (22) |
| Plastics and rubber products | 0.2% (161) | 0.3% (142) | 0.0% (19) | 0.4% (287) | 0.6% (201) | 0.3% (86) |
| Apparel | 0.2% (154) | 0.3% (138) | 0.0% (16) | 0.4% (255) | 0.3% (91) | 0.5% (164) |
| Recyclable material merchant wholesalers | 0.2% (148) | 0.1% (25) | 0.3% (123) | 0.1% (65) | 0.1% (53) | 0.0% (12) |
| Apparel, fabrics, and notions merchant wholesalers | 0.2% (138) | 0.2% (82) | 0.1% (56) | 0.1% (89) | 0.2% (55) | 0.1% (34) |
| Miscellaneous nondurable goods merchant wholesalers | 0.2% (133) | 0.2% (104) | 0.1% (29) | 0.2% (159) | 0.3% (104) | 0.2% (55) |
| Motor vehicles, parts and supplies merchant wholesalers | 0.1% (130) | 0.2% (91) | 0.1% (39) | 0.3% (228) | 0.3% (124) | 0.3% (104) |
| Water transportation | 0.1% (130) | 0.2% (102) | 0.1% (28) | 0.0% (17) | 0.0% (17) | 0.0% (0) |
| Jewelry, luggage, and leather goods stores | 0.1% (119) | 0.0% (0) | 0.3% (119) | 0.1% (85) | 0.1% (40) | 0.1% (45) |
| Lumber and other construction materials merchant wholesalers | 0.1% (117) | 0.3% (117) | 0.0% (0) | 0.2% (152) | 0.3% (124) | 0.1% (28) |
| Warehousing and storage | 0.1% (104) | 0.2% (79) | 0.1% (25) | 0.1% (49) | 0.1% (33) | 0.1% (16) |
| Drugs, sundries, and chemical and allied products merchant wholesalers | 0.1% (86) | 0.1% (70) | 0.0% (16) | 0.2% (144) | 0.3% (110) | 0.1% (34) |
| Beverage and tobacco products | 0.1% (82) | 0.1% (41) | 0.1% (41) | 0.1% (47) | 0.1% (37) | 0.0% (10) |
| Textile mills and textile products | 0.1% (80) | 0.1% (55) | 0.1% (25) | 0.4% (293) | 0.5% (175) | 0.4% (118) |
| Professional and commercial equipment and supplies merchant wholesalers | 0.1% (77) | 0.0% (16) | 0.1% (61) | 0.3% (223) | 0.4% (135) | 0.3% (88) |
| Fuel dealers | 0.1% (70) | 0.1% (70) | 0.0% (0) | 0.0% (17) | 0.0% (0) | 0.1% (17) |
| Data processing, libraries, and other information services | 0.1% (66) | 0.0% (22) | 0.1% (44) | 0.3% (221) | 0.3% (98) | 0.4% (123) |
| Electrical and electronic goods merchant wholesalers | 0.1% (66) | 0.1% (66) | 0.0% (0) | 0.6% (420) | 0.7% (264) | 0.5% (156) |
| Metals and minerals, except petroleum, merchant wholesalers | 0.1% (44) | 0.1% (34) | 0.0% (10) | 0.1% (95) | 0.2% (77) | 0.1% (18) |
| Mining, quarrying, and oil and gas extraction | 0.0% (42) | 0.1% (42) | 0.0% (0) | 0.1% (83) | 0.2% (71) | 0.0% (12) |
| Miscellaneous durable goods merchant wholesalers | 0.0% (36) | 0.1% (26) | 0.0% (10) | 0.2% (120) | 0.3% (107) | 0.0% (13) |
| Alcoholic beverages merchant wholesalers | 0.0% (34) | 0.1% (34) | 0.0% (0) | 0.2% (107) | 0.2% (90) | 0.1% (17) |
| Music stores | 0.0% (23) | 0.0% (23) | 0.0% (0) | 0.1% (97) | 0.2% (75) | 0.1% (22) |
| Paper and paper products merchant wholesalers | 0.0% (10) | 0.0% (0) | 0.0% (10) | 0.2% (110) | 0.2% (70) | 0.1% (40) |
Unemployment in Vancouver
- Unemployment by race in 2022
- Unemployment rate for White non-Hispanic residents
- 7.8%Males
- 5.7%Females
- Unemployment rate for Black residents
- 3.8%Males
- 1.7%Females
- Unemployment rate for American Indian and Alaska Native residents
- 2.0%Males
- 9.4%Females
- Unemployment rate for Asian residents
- 1.7%Males
- 3.4%Females
- Unemployment rate for other race residents
- 2.5%Males
- 1.6%Females
- Unemployment rate for two or more race residents
- 14.7%Males
- 4.6%Females
- Unemployment rate for Hispanic or Latino residents
- 14.0%Males
- 7.0%Females
- Unemployment by race in 2000
- Unemployment rate for White non-Hispanic residents
- 6.3%Males
- 5.9%Females
- Unemployment rate for Black residents
- 11.6%Males
- 10.9%Females
- Unemployment rate for American Indian and Alaska Native residents
- 8.4%Males
- 17.4%Females
- Unemployment rate for Asian residents
- 4.7%Males
- 8.0%Females
- Unemployment rate for other race residents
- 10.4%Males
- 9.7%Females
- Unemployment rate for two or more race residents
- 9.3%Males
- 14.3%Females
- Unemployment rate for Hispanic or Latino residents
- 8.2%Males
- 9.1%Females
Unemployment in 2023:
| Vancouver: | 4.9% |
| Washington: | 4.6% |
Unemployment in 2022:
| Vancouver: | 4.8% |
| Washington: | 4.2% |
Unemployment in 2021:
| Vancouver: | 5.8% |
| Washington: | 5.2% |
Unemployment in 2020:
| Vancouver: | 9.0% |
| Washington: | 8.5% |
Unemployment in 2019:
| Vancouver: | 4.9% |
| Washington: | 4.2% |
Unemployment in 2018:
| Vancouver: | 4.8% |
| Washington: | 4.4% |
Unemployment in 2017:
| Vancouver: | 5.2% |
| Washington: | 4.6% |
Unemployment in 2016:
| Vancouver: | 6.2% |
| Washington: | 5.2% |
Unemployment in 2015:
| Vancouver: | 6.4% |
| Washington: | 5.4% |
Unemployment in 2014:
| Vancouver: | 7.0% |
| Washington: | 5.9% |
Unemployment in 2013:
| Vancouver: | 8.5% |
| Washington: | 6.6% |
Unemployment in 2012:
| Vancouver: | 8.9% |
| Washington: | 7.7% |
Unemployment in 2011:
| Vancouver: | 10.6% |
| Washington: | 8.5% |
Unemployment in 2010:
| Vancouver: | 11.8% |
| Washington: | 9.1% |
Unemployment in 2009:
| Vancouver: | 12.7% |
| Washington: | 8.3% |
Unemployment in 2008:
| Vancouver: | 7.5% |
| Washington: | 5.2% |
Unemployment in 2007:
| Vancouver: | 6.4% |
| Washington: | 4.6% |
Unemployment in 2006:
| Vancouver: | 6.6% |
| Washington: | 5.0% |
Unemployment in 2005:
| Vancouver: | 7.1% |
| Washington: | 5.6% |
Unemployment in 2004:
| Vancouver: | 8.4% |
| Washington: | 6.3% |
Unemployment in 2003:
| Vancouver: | 10.4% |
| Washington: | 7.2% |
Unemployment in 2002:
| Vancouver: | 9.8% |
| Washington: | 7.1% |
Unemployment in 2001:
| Vancouver: | 7.4% |
| Washington: | 6.0% |
Unemployment in 2000:
| Vancouver: | 5.6% |
| Washington: | 5.1% |
Unemployment in 1999:
| Vancouver: | 5.2% |
| Washington: | 4.8% |
Unemployment in 1998:
| Vancouver: | 5.6% |
| Washington: | 4.8% |
Unemployment in 1997:
| Vancouver: | 4.5% |
| Washington: | 4.9% |
Unemployment in 1996:
| Vancouver: | 5.4% |
| Washington: | 5.9% |
Unemployment in 1995:
| Vancouver: | 5.5% |
| Washington: | 6.2% |
Unemployment in 1994:
| Vancouver: | 6.1% |
| Washington: | 6.3% |
Unemployment in 1993:
| Vancouver: | 7.7% |
| Washington: | 7.3% |
Unemployment in 1992:
| Vancouver: | 9.2% |
| Washington: | 7.2% |
Unemployment in 1991:
| Vancouver: | 8.1% |
| Washington: | 6.1% |
Unemployment in 1990:
| Vancouver: | 6.2% |
| Washington: | 5.1% |
Time leaving home to go to work
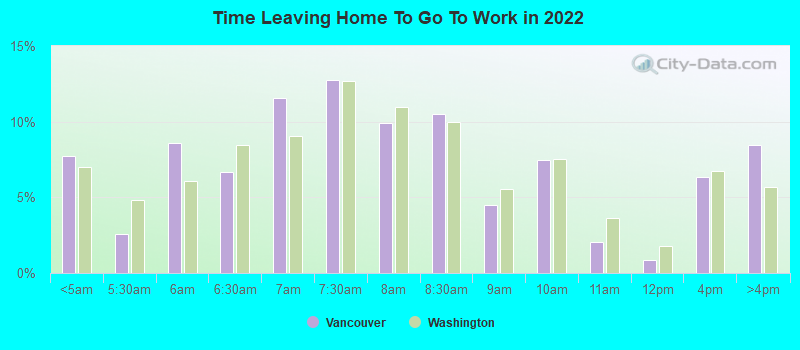
12:00 a.m. to 4:59 a.m.:
| Vancouver: | 7.8% (6,122) |
| Washington: | 7.0% (213,920) |
5:00 a.m. to 5:29 a.m.:
| Vancouver: | 2.6% (2,015) |
| Washington: | 4.8% (147,787) |
5:30 a.m. to 5:59 a.m.:
| Vancouver: | 8.6% (6,773) |
| Washington: | 6.1% (185,330) |
6:00 a.m. to 6:29 a.m.:
| Vancouver: | 6.7% (5,260) |
| Washington: | 8.4% (257,617) |
6:30 a.m. to 6:59 a.m.:
| Vancouver: | 11.6% (9,148) |
| Washington: | 9.1% (277,560) |
7:00 a.m. to 7:29 a.m.:
| Vancouver: | 12.8% (10,096) |
| Washington: | 12.7% (387,691) |
7:30 a.m. to 7:59 a.m.:
| Vancouver: | 9.9% (7,849) |
| Washington: | 11.0% (335,322) |
8:00 a.m. to 8:29 a.m.:
| Vancouver: | 10.5% (8,290) |
| Washington: | 10.0% (304,814) |
8:30 a.m. to 8:59 a.m.:
| Vancouver: | 4.5% (3,539) |
| Washington: | 5.5% (169,492) |
9:00 a.m. to 9:59 a.m.:
| Vancouver: | 7.5% (5,910) |
| Washington: | 7.6% (231,053) |
10:00 a.m. to 10:59 a.m.:
| Vancouver: | 2.0% (1,592) |
| Washington: | 3.7% (111,784) |
11:00 a.m. to 11:59 a.m.:
| Vancouver: | 0.9% (682) |
| Washington: | 1.8% (55,138) |
12:00 p.m. to 3:59 p.m.:
| Vancouver: | 6.4% (5,017) |
| Washington: | 6.7% (205,284) |
4:00 p.m. to 11:59 p.m.:
| Vancouver: | 8.4% (6,672) |
| Washington: | 5.7% (174,677) |

<5am:
| Vancouver: | 4.0% (2,650) |
| Washington: | 4.2% (115,997) |
5:30am:
| Vancouver: | 3.3% (2,223) |
| Washington: | 3.7% (102,868) |
6am:
| Vancouver: | 5.4% (3,591) |
| Washington: | 5.3% (147,812) |
6:30am:
| Vancouver: | 8.4% (5,608) |
| Washington: | 8.9% (248,462) |
7am:
| Vancouver: | 10.9% (7,287) |
| Washington: | 10.3% (288,005) |
7:30am:
| Vancouver: | 13.7% (9,165) |
| Washington: | 13.5% (375,030) |
8am:
| Vancouver: | 14.3% (9,570) |
| Washington: | 13.4% (372,576) |
8:30am:
| Vancouver: | 8.5% (5,724) |
| Washington: | 9.0% (252,058) |
9am:
| Vancouver: | 4.2% (2,841) |
| Washington: | 5.1% (141,936) |
10am:
| Vancouver: | 5.4% (3,624) |
| Washington: | 5.8% (161,204) |
11am:
| Vancouver: | 2.0% (1,349) |
| Washington: | 2.5% (70,123) |
12pm:
| Vancouver: | 1.1% (721) |
| Washington: | 1.3% (35,612) |
4pm:
| Vancouver: | 7.1% (4,757) |
| Washington: | 6.8% (190,565) |
>4pm:
| Vancouver: | 8.2% (5,489) |
| Washington: | 5.8% (162,401) |

12:00 a.m. to 4:59 a.m. - Males:
| Vancouver: | 10.2% (4,440) |
| Washington: | 9.3% (158,516) |
5:00 a.m. to 5:29 a.m. - Males:
| Vancouver: | 3.8% (1,636) |
| Washington: | 6.5% (110,295) |
5:30 a.m. to 5:59 a.m. - Males:
| Vancouver: | 7.8% (3,408) |
| Washington: | 7.1% (120,772) |
6:00 a.m. to 6:29 a.m. - Males:
| Vancouver: | 6.3% (2,728) |
| Washington: | 9.8% (166,050) |
6:30 a.m. to 6:59 a.m. - Males:
| Vancouver: | 15.1% (6,565) |
| Washington: | 9.3% (158,128) |
7:00 a.m. to 7:29 a.m. - Males:
| Vancouver: | 10.4% (4,518) |
| Washington: | 11.7% (198,720) |
7:30 a.m. to 7:59 a.m. - Males:
| Vancouver: | 9.0% (3,907) |
| Washington: | 9.6% (162,900) |
8:00 a.m. to 8:29 a.m. - Males:
| Vancouver: | 8.5% (3,685) |
| Washington: | 8.8% (149,907) |
8:30 a.m. to 8:59 a.m. - Males:
| Vancouver: | 5.9% (2,544) |
| Washington: | 4.5% (76,772) |
9:00 a.m. to 9:59 a.m. - Males:
| Vancouver: | 6.6% (2,883) |
| Washington: | 6.5% (111,251) |
10:00 a.m. to 10:59 a.m. - Males:
| Vancouver: | 1.3% (582) |
| Washington: | 2.9% (49,968) |
11:00 a.m. to 11:59 a.m. - Males:
| Vancouver: | 0.4% (180) |
| Washington: | 1.6% (27,588) |
12:00 p.m. to 3:59 p.m. - Males:
| Vancouver: | 6.6% (2,849) |
| Washington: | 6.8% (115,643) |
4:00 p.m. to 11:59 p.m. - Males:
| Vancouver: | 8.1% (3,532) |
| Washington: | 5.6% (95,440) |

12:00 a.m. to 4:59 a.m. - Females:
| Vancouver: | 4.7% (1,682) |
| Washington: | 4.1% (55,404) |
5:00 a.m. to 5:29 a.m. - Females:
| Vancouver: | 1.1% (379) |
| Washington: | 2.8% (37,492) |
5:30 a.m. to 5:59 a.m. - Females:
| Vancouver: | 9.5% (3,365) |
| Washington: | 4.8% (64,558) |
6:00 a.m. to 6:29 a.m. - Females:
| Vancouver: | 7.1% (2,532) |
| Washington: | 6.8% (91,567) |
6:30 a.m. to 6:59 a.m. - Females:
| Vancouver: | 7.3% (2,583) |
| Washington: | 8.8% (119,432) |
7:00 a.m. to 7:29 a.m. - Females:
| Vancouver: | 15.7% (5,578) |
| Washington: | 13.9% (188,971) |
7:30 a.m. to 7:59 a.m. - Females:
| Vancouver: | 11.1% (3,942) |
| Washington: | 12.7% (172,422) |
8:00 a.m. to 8:29 a.m. - Females:
| Vancouver: | 13.0% (4,605) |
| Washington: | 11.4% (154,907) |
8:30 a.m. to 8:59 a.m. - Females:
| Vancouver: | 2.8% (995) |
| Washington: | 6.8% (92,720) |
9:00 a.m. to 9:59 a.m. - Females:
| Vancouver: | 8.5% (3,027) |
| Washington: | 8.8% (119,802) |
10:00 a.m. to 10:59 a.m. - Females:
| Vancouver: | 2.8% (1,010) |
| Washington: | 4.6% (61,816) |
11:00 a.m. to 11:59 a.m. - Females:
| Vancouver: | 1.4% (502) |
| Washington: | 2.0% (27,550) |
12:00 p.m. to 3:59 p.m. - Females:
| Vancouver: | 6.1% (2,168) |
| Washington: | 6.6% (89,641) |
4:00 p.m. to 11:59 p.m. - Females:
| Vancouver: | 8.8% (3,140) |
| Washington: | 5.8% (79,237) |
Travel time to work
Percentage of workers working in this county: 73.7%
Number of people working at home: 16,140 (17.0% of all workers)
Daytime population change due to commuting: +7,469 (+5.2%)
Workers who live and work in this city: 31,806 (47.5%)
Number of people working at home: 16,140 (17.0% of all workers)
Daytime population change due to commuting: +7,469 (+5.2%)
Workers who live and work in this city: 31,806 (47.5%)

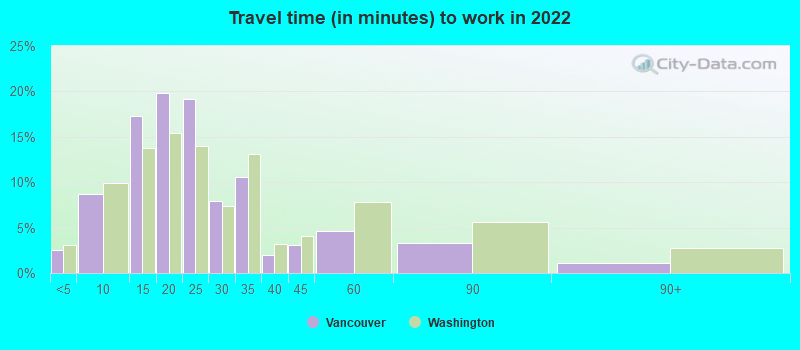
Less than 5 minutes:
| Vancouver: | 2.5% (2,308) |
| Washington: | 3.1% (93,865) |
5 to 9 minutes:
| Vancouver: | 8.8% (8,035) |
| Washington: | 9.9% (298,868) |
10 to 14 minutes:
| Vancouver: | 17.3% (15,838) |
| Washington: | 13.7% (416,060) |
15 to 19 minutes:
| Vancouver: | 19.8% (18,194) |
| Washington: | 15.4% (467,690) |
20 to 24 minutes:
| Vancouver: | 19.2% (17,623) |
| Washington: | 14.0% (423,366) |
25 to 29 minutes:
| Vancouver: | 7.9% (7,256) |
| Washington: | 7.3% (221,791) |
30 to 34 minutes:
| Vancouver: | 10.5% (9,662) |
| Washington: | 13.1% (396,980) |
35 to 39 minutes:
| Vancouver: | 2.0% (1,832) |
| Washington: | 3.2% (96,888) |
40 to 44 minutes:
| Vancouver: | 3.0% (2,787) |
| Washington: | 4.1% (123,302) |
45 to 59 minutes:
| Vancouver: | 4.6% (4,255) |
| Washington: | 7.8% (237,234) |
60 to 89 minutes:
| Vancouver: | 3.3% (2,997) |
| Washington: | 5.6% (169,056) |
90 or more minutes:
| Vancouver: | 1.1% (1,022) |
| Washington: | 2.7% (82,273) |


Less than 5 minutes:
| Vancouver: | 2.2% (1,506) |
| Washington: | 3.3% (91,132) |
5 to 9 minutes:
| Vancouver: | 10.0% (6,719) |
| Washington: | 10.3% (286,517) |
10 to 14 minutes:
| Vancouver: | 16.4% (10,980) |
| Washington: | 14.1% (391,606) |
15 to 19 minutes:
| Vancouver: | 19.0% (12,704) |
| Washington: | 15.0% (418,990) |
20 to 24 minutes:
| Vancouver: | 16.7% (11,212) |
| Washington: | 14.2% (394,209) |
25 to 29 minutes:
| Vancouver: | 6.0% (4,021) |
| Washington: | 5.8% (162,590) |
30 to 34 minutes:
| Vancouver: | 12.0% (8,027) |
| Washington: | 12.5% (348,311) |
35 to 39 minutes:
| Vancouver: | 1.9% (1,256) |
| Washington: | 2.6% (73,592) |
40 to 44 minutes:
| Vancouver: | 2.4% (1,596) |
| Washington: | 3.4% (95,182) |
45 to 59 minutes:
| Vancouver: | 5.3% (3,538) |
| Washington: | 7.0% (195,343) |
60 to 89 minutes:
| Vancouver: | 2.5% (1,696) |
| Washington: | 4.7% (131,691) |
90 or more minutes:
| Vancouver: | 2.0% (1,344) |
| Washington: | 2.7% (75,486) |

Less than 5 minutes - Males:
| Vancouver: | 2.0% (939) |
| Washington: | 3.0% (50,336) |
5 to 9 minutes - Males:
| Vancouver: | 8.3% (3,922) |
| Washington: | 8.8% (147,562) |
10 to 14 minutes - Males:
| Vancouver: | 14.1% (6,643) |
| Washington: | 12.7% (213,520) |
15 to 19 minutes - Males:
| Vancouver: | 21.1% (9,927) |
| Washington: | 14.9% (250,079) |
20 to 24 minutes - Males:
| Vancouver: | 18.3% (8,623) |
| Washington: | 13.7% (231,264) |
25 to 29 minutes - Males:
| Vancouver: | 10.0% (4,699) |
| Washington: | 7.3% (122,887) |
30 to 34 minutes - Males:
| Vancouver: | 11.2% (5,258) |
| Washington: | 13.5% (227,959) |
35 to 39 minutes - Males:
| Vancouver: | 2.3% (1,095) |
| Washington: | 3.4% (56,993) |
40 to 44 minutes - Males:
| Vancouver: | 3.3% (1,535) |
| Washington: | 4.6% (77,594) |
45 to 59 minutes - Males:
| Vancouver: | 4.5% (2,125) |
| Washington: | 8.5% (143,199) |
60 to 89 minutes - Males:
| Vancouver: | 3.6% (1,716) |
| Washington: | 6.3% (105,858) |
90 or more minutes - Males:
| Vancouver: | 1.4% (657) |
| Washington: | 3.3% (55,331) |

Less than 5 minutes - Females:
| Vancouver: | 3.1% (1,369) |
| Washington: | 3.2% (43,529) |
5 to 9 minutes - Females:
| Vancouver: | 9.2% (4,113) |
| Washington: | 11.3% (151,306) |
10 to 14 minutes - Females:
| Vancouver: | 20.6% (9,195) |
| Washington: | 15.1% (202,540) |
15 to 19 minutes - Females:
| Vancouver: | 18.5% (8,267) |
| Washington: | 16.2% (217,611) |
20 to 24 minutes - Females:
| Vancouver: | 20.1% (9,000) |
| Washington: | 14.3% (192,102) |
25 to 29 minutes - Females:
| Vancouver: | 5.7% (2,557) |
| Washington: | 7.4% (98,904) |
30 to 34 minutes - Females:
| Vancouver: | 9.9% (4,404) |
| Washington: | 12.6% (169,021) |
35 to 39 minutes - Females:
| Vancouver: | 1.6% (737) |
| Washington: | 3.0% (39,895) |
40 to 44 minutes - Females:
| Vancouver: | 2.8% (1,252) |
| Washington: | 3.4% (45,708) |
45 to 59 minutes - Females:
| Vancouver: | 4.8% (2,130) |
| Washington: | 7.0% (94,035) |
60 to 89 minutes - Females:
| Vancouver: | 2.9% (1,281) |
| Washington: | 4.7% (63,198) |
90 or more minutes - Females:
| Vancouver: | 0.8% (365) |
| Washington: | 2.0% (26,942) |
Means of transportation to work

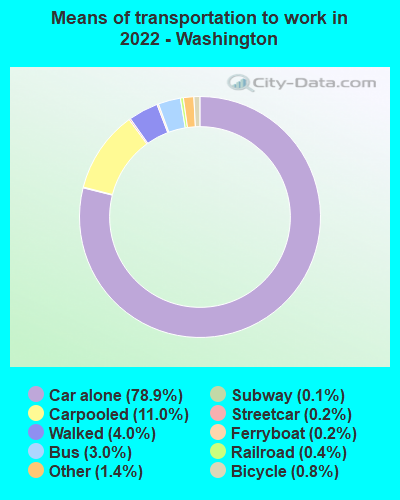
Drove car alone:
| Vancouver: | 85.4% (90,785) |
| Washington: | 78.9% (1,056,632) |
Carpooled:
| Vancouver: | 9.7% (10,349) |
| Washington: | 11.0% (157,303) |
Bus:
| Vancouver: | 1.4% (1,511) |
| Washington: | 3.0% (43,847) |
Subway or elevated rail:
| Vancouver: | 0.0% (38) |
| Washington: | 0.2% (1,769) |
Light rail, streetcar or trolley:
| Vancouver: | 0.0% (27) |
| Washington: | 0.4% (6,524) |
Bicycle:
| Vancouver: | 0.4% (373) |
| Washington: | 0.8% (6,274) |
Walked:
| Vancouver: | 1.6% (1,710) |
| Washington: | 4.0% (52,284) |
Other means:
| Vancouver: | 1.4% (1,464) |
| Washington: | 1.4% (15,651) |


Drove car alone:
| Vancouver: | 76.9% (51,565) |
| Washington: | 73.3% (2,040,833) |
Carpooled:
| Vancouver: | 12.6% (8,450) |
| Washington: | 12.8% (357,742) |
Bus or trolley bus:
| Vancouver: | 3.5% (2,341) |
| Washington: | 4.5% (124,450) |
Streetcar or trolley car:
| Vancouver: | 0.1% (65) |
| Washington: | 0.0% (589) |
Subway or elevated:
| Vancouver: | 0.1% (50) |
| Washington: | 0.0% (598) |
Railroad:
| Vancouver: | 0.0% (8) |
| Washington: | 0.0% (301) |
Taxicab:
| Vancouver: | 0.0% (7) |
| Washington: | 0.1% (1,417) |
Motorcycle:
| Vancouver: | 0.1% (75) |
| Washington: | 0.2% (4,353) |
Bicycle:
| Vancouver: | 0.5% (317) |
| Washington: | 0.6% (16,205) |
Walked:
| Vancouver: | 1.8% (1,225) |
| Washington: | 3.2% (89,739) |
Other means:
| Vancouver: | 0.7% (496) |
| Washington: | 0.7% (19,499) |

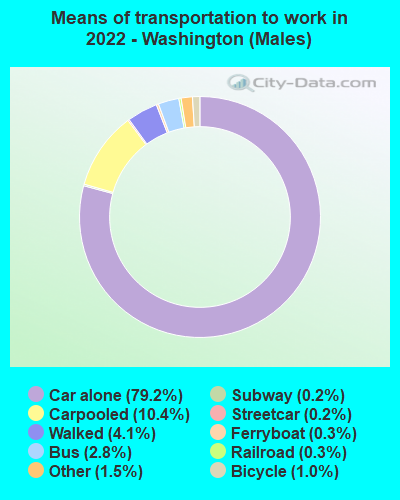
Drove car alone - Males:
| Vancouver: | 85.5% (46,784) |
| Washington: | 79.2% (1,056,632) |
Carpooled - Males:
| Vancouver: | 9.0% (4,921) |
| Washington: | 10.4% (157,303) |
Bus - Males:
| Vancouver: | 1.3% (686) |
| Washington: | 2.8% (43,847) |
Light rail, streetcar or trolley - Males:
| Vancouver: | 0.0% (27) |
| Washington: | 0.3% (6,524) |
Bicycle - Males:
| Vancouver: | 0.5% (273) |
| Washington: | 1.0% (6,274) |
Walked - Males:
| Vancouver: | 1.7% (947) |
| Washington: | 4.1% (52,284) |
Other means - Males:
| Vancouver: | 1.9% (1,064) |
| Washington: | 1.5% (15,651) |

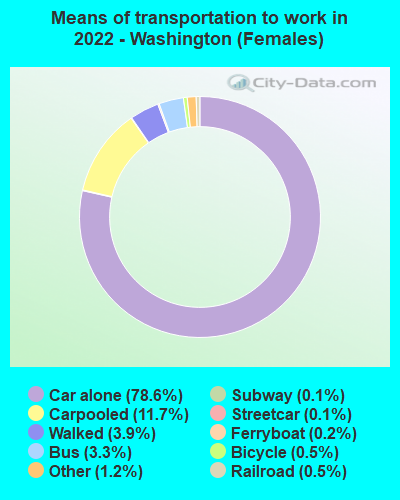
Drove car alone - Females:
| Vancouver: | 85.4% (43,956) |
| Washington: | 78.6% (1,056,632) |
Carpooled - Females:
| Vancouver: | 10.5% (5,401) |
| Washington: | 11.7% (157,303) |
Bus - Females:
| Vancouver: | 1.6% (819) |
| Washington: | 3.3% (43,847) |
Subway or elevated rail - Females:
| Vancouver: | 0.1% (37) |
| Washington: | 0.1% (1,769) |
Bicycle - Females:
| Vancouver: | 0.2% (105) |
| Washington: | 0.5% (6,274) |
Walked - Females:
| Vancouver: | 1.5% (766) |
| Washington: | 3.9% (52,284) |
Other means - Females:
| Vancouver: | 0.8% (416) |
| Washington: | 1.2% (15,651) |
Private vehicle occupancy

Drove alone:
| Vancouver: | 89.3% (65,139) |
| Washington: | 87.8% (2,415,775) |
In 2 person carpool:
| Vancouver: | 7.3% (5,329) |
| Washington: | 9.2% (252,715) |
In 3 person carpool:
| Vancouver: | 2.2% (1,639) |
| Washington: | 1.6% (44,943) |
In 4 person carpool:
| Vancouver: | 0.6% (434) |
| Washington: | 0.6% (17,361) |
In 5-6 person carpool:
| Vancouver: | 0.1% (101) |
| Washington: | 0.4% (10,530) |
In 7+ person carpool:
| Vancouver: | 0.4% (276) |
| Washington: | 0.3% (9,435) |

Drove alone:
| Vancouver: | 85.9% (51,565) |
| Washington: | 85.1% (2,040,833) |
In 2 person carpool:
| Vancouver: | 11.9% (7,125) |
| Washington: | 11.8% (282,638) |
In 3 person carpool:
| Vancouver: | 1.4% (855) |
| Washington: | 1.9% (44,791) |
In 4 person carpool:
| Vancouver: | 0.5% (308) |
| Washington: | 0.6% (14,195) |
In 5-6 person carpool:
| Vancouver: | 0.2% (105) |
| Washington: | 0.3% (7,914) |
In 7+ person carpool:
| Vancouver: | 0.1% (57) |
| Washington: | 0.3% (8,204) |
Class of workers
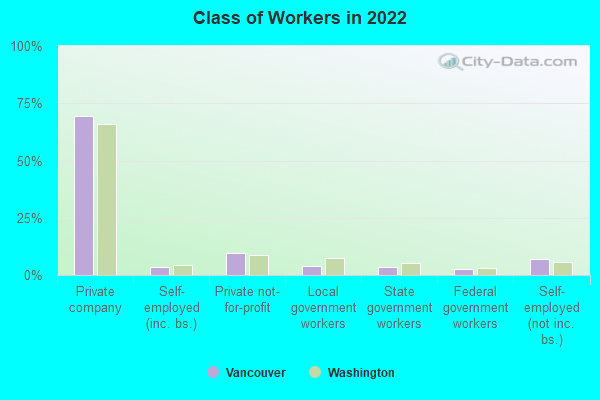
Employee of private company:
| Vancouver: | 69.6% (67,035) |
| Washington: | 66.0% (2,552,907) |
Self-employed in own incorporated business:
| Vancouver: | 3.4% (3,263) |
| Washington: | 4.2% (161,426) |
Private not-for-profit wage and salary workers:
| Vancouver: | 9.6% (9,287) |
| Washington: | 8.6% (330,637) |
Local government workers:
| Vancouver: | 4.0% (3,817) |
| Washington: | 7.3% (281,034) |
State government workers:
| Vancouver: | 3.7% (3,539) |
| Washington: | 5.2% (201,670) |
Federal government workers:
| Vancouver: | 2.8% (2,729) |
| Washington: | 3.1% (118,044) |
Self-employed workers in own not incorporated business:
| Vancouver: | 6.9% (6,653) |
| Washington: | 5.5% (212,937) |

Employee of private company:
| Vancouver: | 74.4% (50,363) |
| Washington: | 66.0% (1,843,000) |
Self-employed in own incorporated business:
| Vancouver: | 2.6% (1,738) |
| Washington: | 3.2% (90,102) |
Private not-for-profit wage and salary workers:
| Vancouver: | 6.0% (4,044) |
| Washington: | 6.9% (191,927) |
Local government workers:
| Vancouver: | 5.7% (3,846) |
| Washington: | 6.4% (178,161) |
State government workers:
| Vancouver: | 3.7% (2,487) |
| Washington: | 6.9% (192,408) |
Federal government workers:
| Vancouver: | 2.1% (1,441) |
| Washington: | 3.2% (89,153) |
Self-employed workers in own not incorporated business:
| Vancouver: | 5.4% (3,637) |
| Washington: | 7.2% (199,827) |
Unpaid family workers:
| Vancouver: | 0.2% (164) |
| Washington: | 0.3% (9,144) |

Employee of private company - Males:
| Vancouver: | 76.6% (39,199) |
| Washington: | 71.1% (1,491,511) |
Self-employed in own incorporated business - Males:
| Vancouver: | 3.8% (1,968) |
| Washington: | 4.9% (103,049) |
Private not-for-profit wage and salary workers - Males:
| Vancouver: | 4.9% (2,497) |
| Washington: | 5.5% (116,374) |
Local government workers - Males:
| Vancouver: | 2.7% (1,398) |
| Washington: | 5.4% (114,033) |
State government workers - Males:
| Vancouver: | 1.6% (829) |
| Washington: | 4.1% (84,969) |
Federal government workers - Males:
| Vancouver: | 2.1% (1,096) |
| Washington: | 3.4% (70,622) |
Self-employed workers in own not incorporated business - Males:
| Vancouver: | 8.1% (4,160) |
| Washington: | 5.4% (113,810) |

Employee of private company - Females:
| Vancouver: | 61.6% (27,836) |
| Washington: | 60.0% (1,061,396) |
Self-employed in own incorporated business - Females:
| Vancouver: | 2.9% (1,295) |
| Washington: | 3.3% (58,377) |
Private not-for-profit wage and salary workers - Females:
| Vancouver: | 15.0% (6,790) |
| Washington: | 12.1% (214,263) |
Local government workers - Females:
| Vancouver: | 5.4% (2,419) |
| Washington: | 9.4% (167,001) |
State government workers - Females:
| Vancouver: | 6.0% (2,710) |
| Washington: | 6.6% (116,701) |
Federal government workers - Females:
| Vancouver: | 3.6% (1,633) |
| Washington: | 2.7% (47,422) |
Self-employed workers in own not incorporated business - Females:
| Vancouver: | 5.5% (2,493) |
| Washington: | 5.6% (99,127) |