Work and Jobs in Wawayanda, New York (NY) Detailed Stats
Occupations, Industries, Unemployment, Workers, Commute
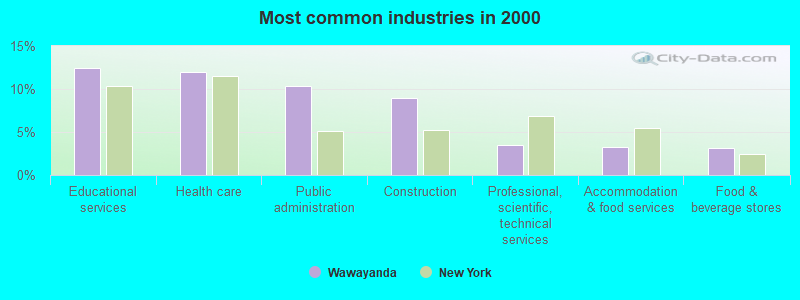
The most common industries in Wawayanda are: Educational services (12.4% of civilian employees), Health care (12.0% of civilian employees), Public administration (10.3% of civilian employees). 55.2% of workers are employees of private companies, which is 15.4% less than the rate of 63.7% across the entire state of New York.
Most common industries
Most common industries | |||
|---|---|---|---|
Industry | All | Males | Females |
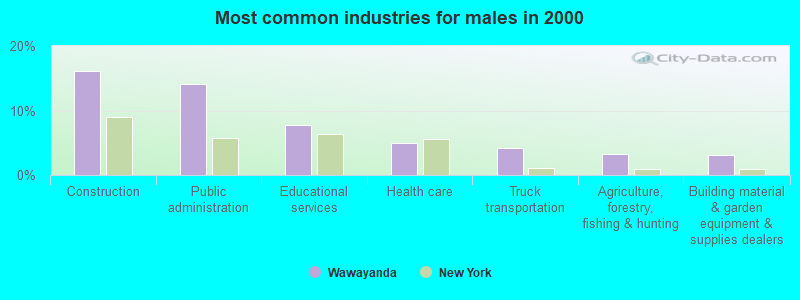
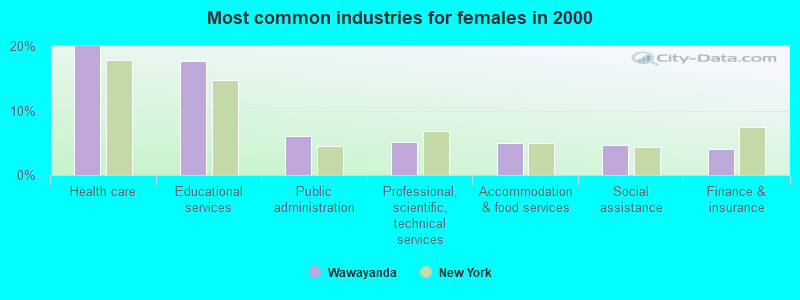
| Educational services | 12.4% (367) | 7.8% (122) | 17.7% (245) |
| Health care | 12.0% (355) | 5.0% (78) | 20.0% (277) |
| Public administration | 10.3% (304) | 14.1% (221) | 6.0% (83) |
| Construction | 9.0% (265) | 16.2% (253) | 0.9% (12) |
| Professional, scientific, and technical services | 3.5% (103) | 2.0% (31) | 5.2% (72) |
| Accommodation and food services | 3.3% (97) | 1.9% (29) | 4.9% (68) |
| Food and beverage stores | 3.2% (94) | 3.0% (47) | 3.4% (47) |
| Administrative and support and waste management services | 3.1% (92) | 3.0% (47) | 3.2% (45) |
| Finance and insurance | 2.9% (87) | 2.0% (31) | 4.0% (56) |
| Social assistance | 2.7% (79) | 1.0% (15) | 4.6% (64) |
| Truck transportation | 2.5% (75) | 4.2% (65) | 0.7% (10) |
| Motor vehicle and parts dealers | 1.9% (57) | 2.6% (41) | 1.2% (16) |
| Agriculture, forestry, fishing and hunting | 1.9% (57) | 3.3% (51) | 0.4% (6) |
| Real estate and rental and leasing | 1.8% (54) | 1.2% (19) | 2.5% (35) |
| Building material and garden equipment and supplies dealers | 1.6% (48) | 3.1% (48) | 0.0% (0) |
| Religious, grantmaking, civic, professional, and similar organizations | 1.6% (46) | 0.8% (13) | 2.4% (33) |
| Personal and laundry services | 1.5% (45) | 0.0% (0) | 3.2% (45) |
| Arts, entertainment, and recreation | 1.4% (42) | 1.3% (20) | 1.6% (22) |
| Miscellaneous manufacturing | 1.4% (40) | 1.3% (21) | 1.4% (19) |
| U. S. Postal service | 1.3% (39) | 1.3% (20) | 1.4% (19) |
| Professional and commercial equipment and supplies merchant wholesalers | 1.0% (29) | 1.9% (29) | 0.0% (0) |
| Utilities | 0.9% (26) | 1.7% (26) | 0.0% (0) |
| Chemicals | 0.8% (25) | 1.2% (18) | 0.5% (7) |
| Publishing, and motion picture and sound recording industries | 0.8% (25) | 0.7% (11) | 1.0% (14) |
| Nonmetallic mineral products | 0.8% (24) | 0.8% (13) | 0.8% (11) |
| Groceries and related products merchant wholesalers | 0.8% (24) | 1.5% (24) | 0.0% (0) |
| Clothing and accessories, including shoe, stores | 0.8% (23) | 0.3% (5) | 1.3% (18) |
| Computer and electronic products | 0.8% (23) | 1.5% (23) | 0.0% (0) |
| Repair and maintenance | 0.8% (23) | 1.0% (16) | 0.5% (7) |
| Food | 0.7% (22) | 0.8% (12) | 0.7% (10) |
| Other direct selling establishments | 0.7% (22) | 0.0% (0) | 1.6% (22) |
| Paper | 0.7% (20) | 0.4% (6) | 1.0% (14) |
| Other transportation, and support activities, and couriers | 0.6% (19) | 0.8% (13) | 0.4% (6) |
| Pharmacies and drug stores | 0.6% (18) | 1.2% (18) | 0.0% (0) |
| Furniture and related product manufacturing | 0.6% (18) | 0.7% (11) | 0.5% (7) |
| Broadcasting and telecommunications | 0.6% (18) | 1.2% (18) | 0.0% (0) |
| Metal and metal products | 0.6% (17) | 1.1% (17) | 0.0% (0) |
| Electronic shopping and mail-order houses | 0.4% (13) | 0.8% (13) | 0.0% (0) |
| Electrical and electronic goods merchant wholesalers | 0.4% (13) | 0.4% (7) | 0.4% (6) |
| Department and other general merchandise stores | 0.4% (13) | 0.3% (5) | 0.6% (8) |
| Office supplies and stationery stores | 0.4% (13) | 0.0% (0) | 0.9% (13) |
| Leather and allied products | 0.4% (13) | 0.8% (13) | 0.0% (0) |
| Sporting goods, camera, and hobby and toy stores | 0.4% (12) | 0.0% (0) | 0.9% (12) |
| Data processing, libraries, and other information services | 0.4% (12) | 0.4% (6) | 0.4% (6) |
| Electrical equipment, appliances, and components | 0.4% (12) | 0.0% (0) | 0.9% (12) |
| Private households | 0.4% (12) | 0.0% (0) | 0.9% (12) |
| Radio, TV, and computer stores | 0.4% (11) | 0.7% (11) | 0.0% (0) |
| Air transportation | 0.3% (10) | 0.6% (10) | 0.0% (0) |
| Printing and related support activities | 0.3% (9) | 0.0% (0) | 0.6% (9) |
| Health and personal care, except drug, stores | 0.3% (8) | 0.5% (8) | 0.0% (0) |
| Textile mills and textile products | 0.2% (7) | 0.4% (7) | 0.0% (0) |
| Management of companies and enterprises | 0.2% (7) | 0.0% (0) | 0.5% (7) |
| Rail transportation | 0.2% (7) | 0.4% (7) | 0.0% (0) |
| Apparel, fabrics, and notions merchant wholesalers | 0.2% (7) | 0.4% (7) | 0.0% (0) |
| Machinery, equipment, and supplies merchant wholesalers | 0.2% (7) | 0.4% (7) | 0.0% (0) |
| Fuel dealers | 0.2% (6) | 0.4% (6) | 0.0% (0) |
| Wood products | 0.2% (6) | 0.4% (6) | 0.0% (0) |
| Hardware, plumbing and heating equipment, and supplies merchant wholesalers | 0.2% (6) | 0.0% (0) | 0.4% (6) |
| Transportation equipment | 0.2% (6) | 0.4% (6) | 0.0% (0) |
| Beverage and tobacco products | 0.2% (5) | 0.3% (5) | 0.0% (0) |
| Gasoline stations | 0.2% (5) | 0.0% (0) | 0.4% (5) |
| Furniture and home furnishings, and household appliance stores | 0.2% (5) | 0.3% (5) | 0.0% (0) |
| Lumber and other construction materials merchant wholesalers | 0.1% (4) | 0.3% (4) | 0.0% (0) |
Unemployment in Wawayanda
- Unemployment by race in 2000
- Unemployment rate for White non-Hispanic residents
- 6.0%Males
- 4.7%Females
- Unemployment rate for other race residents
- 40.9%Females
- Unemployment rate for two or more race residents
- 52.4%Males
- Unemployment rate for Hispanic or Latino residents
- 16.5%Males
- 11.5%Females
Time leaving home to go to work

<5am:
| Wawayanda: | 3.8% (109) |
| New York: | 2.4% (194,562) |
5:30am:
| Wawayanda: | 3.0% (87) |
| New York: | 2.1% (174,328) |
6am:
| Wawayanda: | 3.7% (108) |
| New York: | 3.1% (253,826) |
6:30am:
| Wawayanda: | 8.3% (239) |
| New York: | 7.0% (573,349) |
7am:
| Wawayanda: | 9.6% (279) |
| New York: | 8.6% (706,982) |
7:30am:
| Wawayanda: | 11.9% (345) |
| New York: | 14.0% (1,147,579) |
8am:
| Wawayanda: | 14.1% (409) |
| New York: | 14.8% (1,213,706) |
8:30am:
| Wawayanda: | 10.0% (290) |
| New York: | 13.9% (1,144,298) |
9am:
| Wawayanda: | 7.8% (225) |
| New York: | 7.5% (614,475) |
10am:
| Wawayanda: | 6.8% (196) |
| New York: | 7.2% (593,377) |
11am:
| Wawayanda: | 2.6% (75) |
| New York: | 2.7% (224,011) |
12pm:
| Wawayanda: | 0.5% (14) |
| New York: | 1.3% (105,049) |
4pm:
| Wawayanda: | 8.9% (257) |
| New York: | 6.3% (517,309) |
>4pm:
| Wawayanda: | 5.8% (168) |
| New York: | 6.1% (501,196) |
Travel time to work


Less than 5 minutes:
| Wawayanda: | 4.1% (118) |
| New York: | 2.7% (219,036) |
5 to 9 minutes:
| Wawayanda: | 7.8% (225) |
| New York: | 8.3% (680,270) |
10 to 14 minutes:
| Wawayanda: | 14.7% (425) |
| New York: | 11.6% (956,590) |
15 to 19 minutes:
| Wawayanda: | 18.6% (539) |
| New York: | 12.4% (1,020,084) |
20 to 24 minutes:
| Wawayanda: | 13.2% (381) |
| New York: | 12.3% (1,013,757) |
25 to 29 minutes:
| Wawayanda: | 3.3% (96) |
| New York: | 4.9% (399,384) |
30 to 34 minutes:
| Wawayanda: | 8.2% (236) |
| New York: | 12.9% (1,058,688) |
35 to 39 minutes:
| Wawayanda: | 3.1% (89) |
| New York: | 2.5% (203,722) |
40 to 44 minutes:
| Wawayanda: | 1.1% (31) |
| New York: | 4.1% (340,311) |
45 to 59 minutes:
| Wawayanda: | 8.1% (234) |
| New York: | 9.8% (806,556) |
60 to 89 minutes:
| Wawayanda: | 9.3% (268) |
| New York: | 10.3% (848,185) |
90 or more minutes:
| Wawayanda: | 5.5% (159) |
| New York: | 5.1% (417,464) |
Means of transportation to work


Drove car alone:
| Wawayanda: | 86.0% (2,488) |
| New York: | 56.3% (4,620,178) |
Carpooled:
| Wawayanda: | 5.6% (161) |
| New York: | 9.2% (756,918) |
Bus or trolley bus:
| Wawayanda: | 2.2% (65) |
| New York: | 5.8% (475,389) |
Railroad:
| Wawayanda: | 0.2% (5) |
| New York: | 2.8% (228,215) |
Walked:
| Wawayanda: | 2.6% (76) |
| New York: | 6.2% (511,721) |
Other means:
| Wawayanda: | 0.2% (6) |
| New York: | 0.5% (40,375) |
Private vehicle occupancy

Drove alone:
| Wawayanda: | 93.9% (2,488) |
| New York: | 85.9% (4,620,178) |
In 2 person carpool:
| Wawayanda: | 5.0% (133) |
| New York: | 11.0% (590,255) |
In 3 person carpool:
| Wawayanda: | 1.1% (28) |
| New York: | 1.8% (96,470) |
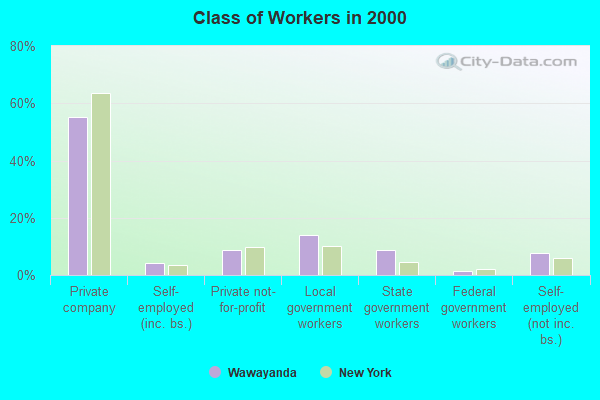
Class of workers
Employee of private company:
| Wawayanda: | 55.2% (1,629) |
| New York: | 63.7% (5,340,134) |
Self-employed in own incorporated business:
| Wawayanda: | 4.0% (119) |
| New York: | 3.4% (283,619) |
Private not-for-profit wage and salary workers:
| Wawayanda: | 8.8% (261) |
| New York: | 9.7% (810,356) |
Local government workers:
| Wawayanda: | 13.9% (409) |
| New York: | 10.2% (858,120) |
State government workers:
| Wawayanda: | 8.7% (256) |
| New York: | 4.6% (383,673) |
Federal government workers:
| Wawayanda: | 1.5% (45) |
| New York: | 2.2% (185,100) |
Self-employed workers in own not incorporated business:
| Wawayanda: | 7.9% (232) |
| New York: | 6.0% (501,068) |

Employee of private company - Males:
| Wawayanda: | 55.5% (869) |
| New York: | 66.2% (2,902,064) |
Self-employed in own incorporated business - Males:
| Wawayanda: | 6.8% (106) |
| New York: | 4.9% (215,651) |
Private not-for-profit wage and salary workers - Males:
| Wawayanda: | 4.3% (68) |
| New York: | 6.3% (277,787) |
Local government workers - Males:
| Wawayanda: | 15.6% (244) |
| New York: | 8.7% (380,426) |
State government workers - Males:
| Wawayanda: | 9.1% (142) |
| New York: | 4.1% (181,784) |
Federal government workers - Males:
| Wawayanda: | 1.3% (20) |
| New York: | 2.3% (102,647) |
Self-employed workers in own not incorporated business - Males:
| Wawayanda: | 7.4% (116) |
| New York: | 7.1% (312,497) |

Employee of private company - Females:
| Wawayanda: | 54.8% (760) |
| New York: | 60.9% (2,438,070) |
Self-employed in own incorporated business - Females:
| Wawayanda: | 0.9% (13) |
| New York: | 1.7% (67,968) |
Private not-for-profit wage and salary workers - Females:
| Wawayanda: | 13.9% (193) |
| New York: | 13.3% (532,569) |
Local government workers - Females:
| Wawayanda: | 11.9% (165) |
| New York: | 11.9% (477,694) |
State government workers - Females:
| Wawayanda: | 8.2% (114) |
| New York: | 5.0% (201,889) |
Federal government workers - Females:
| Wawayanda: | 1.8% (25) |
| New York: | 2.1% (82,453) |
Self-employed workers in own not incorporated business - Females:
| Wawayanda: | 8.4% (116) |
| New York: | 4.7% (188,571) |