Work and Jobs in Wheaton-Glenmont, Maryland (MD) Detailed Stats
Occupations, Industries, Unemployment, Workers, Commute

Recent posts about work in Wheaton-Glenmont, Maryland on our local forum with over 2,400,000 registered users:
 | Is Wheaton going downhill??? (81 replies) |
| Specialty Beer Stores? (10 replies) |
| Potential Move to DS area (2 replies) |
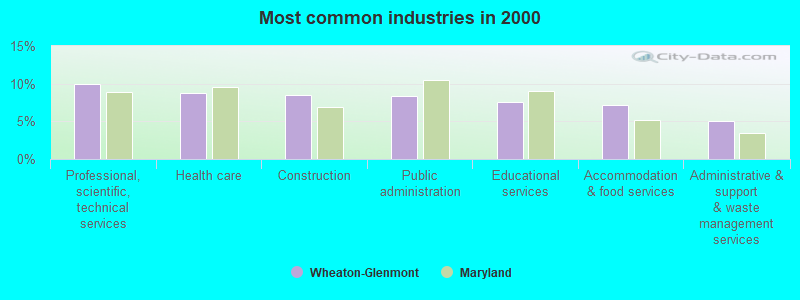
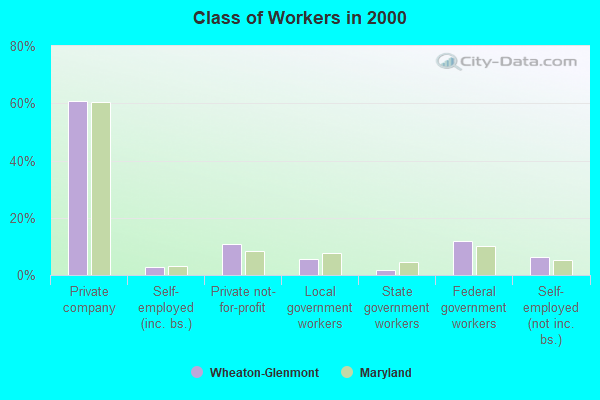
The most common industries in Wheaton-Glenmont are: Professional, scientific, technical services (10.0% of civilian employees), Health care (8.7% of civilian employees), Construction (8.5% of civilian employees). 60.7% of workers are employees of private companies, which is about the same as the rate of 60.5% across the entire state of Maryland.
Most common industries
Most common industries | |||
|---|---|---|---|
Industry | All | Males | Females |
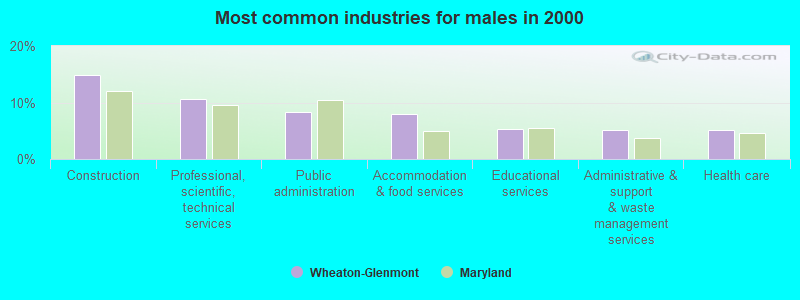
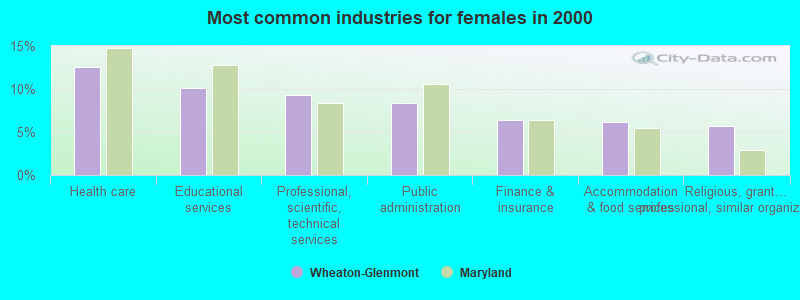
| Professional, scientific, and technical services | 10.0% (2,856) | 10.6% (1,557) | 9.3% (1,299) |
| Health care | 8.7% (2,504) | 5.1% (751) | 12.6% (1,753) |
| Construction | 8.5% (2,422) | 14.8% (2,186) | 1.7% (236) |
| Public administration | 8.3% (2,377) | 8.3% (1,218) | 8.3% (1,159) |
| Educational services | 7.6% (2,179) | 5.2% (772) | 10.1% (1,407) |
| Accommodation and food services | 7.1% (2,040) | 8.0% (1,179) | 6.2% (861) |
| Administrative and support and waste management services | 5.0% (1,440) | 5.1% (756) | 4.9% (684) |
| Finance and insurance | 4.7% (1,360) | 3.2% (468) | 6.4% (892) |
| Religious, grantmaking, civic, professional, and similar organizations | 4.6% (1,323) | 3.6% (528) | 5.7% (795) |
| Social assistance | 2.6% (742) | 0.3% (49) | 5.0% (693) |
| Private households | 2.4% (685) | 0.2% (31) | 4.7% (654) |
| Food and beverage stores | 2.2% (641) | 2.7% (404) | 1.7% (237) |
| Personal and laundry services | 2.0% (586) | 1.2% (174) | 3.0% (412) |
| Real estate and rental and leasing | 2.0% (576) | 1.8% (268) | 2.2% (308) |
| Broadcasting and telecommunications | 2.0% (572) | 2.4% (357) | 1.5% (215) |
| Arts, entertainment, and recreation | 1.9% (531) | 2.1% (303) | 1.6% (228) |
| Publishing, and motion picture and sound recording industries | 1.4% (389) | 1.7% (247) | 1.0% (142) |
| Other transportation, and support activities, and couriers | 1.3% (376) | 2.1% (306) | 0.5% (70) |
| Repair and maintenance | 1.3% (370) | 2.1% (313) | 0.4% (57) |
| Data processing, libraries, and other information services | 1.3% (368) | 1.5% (221) | 1.1% (147) |
| Motor vehicle and parts dealers | 1.2% (345) | 1.8% (263) | 0.6% (82) |
| Department and other general merchandise stores | 1.1% (324) | 0.8% (119) | 1.5% (205) |
| Computer and electronic products | 0.8% (230) | 0.9% (133) | 0.7% (97) |
| Radio, TV, and computer stores | 0.7% (202) | 1.1% (166) | 0.3% (36) |
| Clothing and accessories, including shoe, stores | 0.7% (193) | 0.4% (65) | 0.9% (128) |
| Other direct selling establishments | 0.7% (188) | 0.5% (70) | 0.8% (118) |
| Printing and related support activities | 0.6% (185) | 1.1% (165) | 0.1% (20) |
| Miscellaneous manufacturing | 0.6% (174) | 0.8% (117) | 0.4% (57) |
| Building material and garden equipment and supplies dealers | 0.6% (172) | 0.8% (118) | 0.4% (54) |
| U. S. Postal service | 0.6% (164) | 0.9% (127) | 0.3% (37) |
| Used merchandise, gift, novelty, and souvenir, and other miscellaneous stores | 0.5% (145) | 0.5% (72) | 0.5% (73) |
| Food | 0.5% (133) | 0.5% (74) | 0.4% (59) |
| Furniture and home furnishings, and household appliance stores | 0.4% (128) | 0.7% (100) | 0.2% (28) |
| Pharmacies and drug stores | 0.4% (116) | 0.2% (26) | 0.6% (90) |
| Truck transportation | 0.4% (107) | 0.7% (103) | 0.0% (4) |
| Sporting goods, camera, and hobby and toy stores | 0.3% (97) | 0.2% (33) | 0.5% (64) |
| Professional and commercial equipment and supplies merchant wholesalers | 0.3% (94) | 0.5% (79) | 0.1% (15) |
| Utilities | 0.3% (91) | 0.5% (68) | 0.2% (23) |
| Transportation equipment | 0.3% (87) | 0.4% (54) | 0.2% (33) |
| Metal and metal products | 0.3% (83) | 0.5% (69) | 0.1% (14) |
| Miscellaneous nondurable goods merchant wholesalers | 0.3% (77) | 0.2% (28) | 0.4% (49) |
| Health and personal care, except drug, stores | 0.3% (76) | 0.1% (22) | 0.4% (54) |
| Electrical and electronic goods merchant wholesalers | 0.3% (75) | 0.4% (62) | 0.1% (13) |
| Chemicals | 0.3% (72) | 0.3% (39) | 0.2% (33) |
| Gasoline stations | 0.2% (69) | 0.3% (45) | 0.2% (24) |
| Furniture and related product manufacturing | 0.2% (60) | 0.3% (46) | 0.1% (14) |
| Retail florists | 0.2% (55) | 0.1% (12) | 0.3% (43) |
| Jewelry, luggage, and leather goods stores | 0.2% (53) | 0.2% (36) | 0.1% (17) |
| Air transportation | 0.2% (52) | 0.2% (30) | 0.2% (22) |
| Groceries and related products merchant wholesalers | 0.2% (49) | 0.3% (49) | 0.0% (0) |
| Warehousing and storage | 0.1% (33) | 0.1% (17) | 0.1% (16) |
| Book stores and news dealers | 0.1% (31) | 0.2% (24) | 0.1% (7) |
| Electronic shopping and mail-order houses | 0.1% (30) | 0.1% (15) | 0.1% (15) |
| Motor vehicles, parts and supplies merchant wholesalers | 0.1% (28) | 0.2% (28) | 0.0% (0) |
| Mining, quarrying, and oil and gas extraction | 0.1% (26) | 0.1% (16) | 0.1% (10) |
| Machinery | 0.1% (20) | 0.1% (20) | 0.0% (0) |
| Vending machine operators | 0.1% (17) | 0.1% (17) | 0.0% (0) |
Unemployment in Wheaton-Glenmont
- Unemployment by race in 2000
- Unemployment rate for White non-Hispanic residents
- 2.4%Males
- 3.0%Females
- Unemployment rate for Black residents
- 5.6%Males
- 6.2%Females
- Unemployment rate for Asian residents
- 1.9%Males
- 3.9%Females
- Unemployment rate for other race residents
- 5.0%Males
- 8.9%Females
- Unemployment rate for two or more race residents
- 2.6%Males
- 1.9%Females
- Unemployment rate for Hispanic or Latino residents
- 4.3%Males
- 9.4%Females
Time leaving home to go to work

<5am:
| Wheaton-Glenmont: | 2.2% (620) |
| Maryland: | 3.0% (77,561) |
5:30am:
| Wheaton-Glenmont: | 2.7% (773) |
| Maryland: | 3.2% (81,972) |
6am:
| Wheaton-Glenmont: | 4.2% (1,203) |
| Maryland: | 4.7% (120,768) |
6:30am:
| Wheaton-Glenmont: | 7.6% (2,150) |
| Maryland: | 9.1% (235,203) |
7am:
| Wheaton-Glenmont: | 8.7% (2,458) |
| Maryland: | 10.3% (267,702) |
7:30am:
| Wheaton-Glenmont: | 17.2% (4,860) |
| Maryland: | 14.9% (386,941) |
8am:
| Wheaton-Glenmont: | 14.2% (4,015) |
| Maryland: | 14.3% (370,838) |
8:30am:
| Wheaton-Glenmont: | 14.6% (4,121) |
| Maryland: | 11.6% (300,061) |
9am:
| Wheaton-Glenmont: | 6.6% (1,867) |
| Maryland: | 6.0% (154,337) |
10am:
| Wheaton-Glenmont: | 6.9% (1,951) |
| Maryland: | 5.9% (151,747) |
11am:
| Wheaton-Glenmont: | 2.7% (764) |
| Maryland: | 2.2% (56,218) |
12pm:
| Wheaton-Glenmont: | 1.2% (346) |
| Maryland: | 1.0% (26,260) |
4pm:
| Wheaton-Glenmont: | 4.6% (1,294) |
| Maryland: | 5.3% (136,187) |
>4pm:
| Wheaton-Glenmont: | 4.0% (1,132) |
| Maryland: | 5.4% (139,172) |
Travel time to work
Daytime population change due to commuting: -18,009 (-31.2%)
Workers who live and work in this place: 2,343 (8.3%)
Workers who live and work in this place: 2,343 (8.3%)


Less than 5 minutes:
| Wheaton-Glenmont: | 1.0% (285) |
| Maryland: | 1.8% (47,843) |
5 to 9 minutes:
| Wheaton-Glenmont: | 3.0% (838) |
| Maryland: | 6.6% (169,884) |
10 to 14 minutes:
| Wheaton-Glenmont: | 6.1% (1,715) |
| Maryland: | 10.5% (271,204) |
15 to 19 minutes:
| Wheaton-Glenmont: | 10.8% (3,053) |
| Maryland: | 12.4% (320,679) |
20 to 24 minutes:
| Wheaton-Glenmont: | 12.2% (3,454) |
| Maryland: | 13.0% (337,452) |
25 to 29 minutes:
| Wheaton-Glenmont: | 5.9% (1,682) |
| Maryland: | 6.1% (158,702) |
30 to 34 minutes:
| Wheaton-Glenmont: | 19.0% (5,374) |
| Maryland: | 14.5% (375,140) |
35 to 39 minutes:
| Wheaton-Glenmont: | 4.3% (1,216) |
| Maryland: | 3.5% (91,893) |
40 to 44 minutes:
| Wheaton-Glenmont: | 6.3% (1,784) |
| Maryland: | 4.8% (123,823) |
45 to 59 minutes:
| Wheaton-Glenmont: | 16.3% (4,603) |
| Maryland: | 11.3% (291,586) |
60 to 89 minutes:
| Wheaton-Glenmont: | 9.4% (2,667) |
| Maryland: | 8.6% (223,613) |
90 or more minutes:
| Wheaton-Glenmont: | 3.1% (883) |
| Maryland: | 3.6% (93,148) |
Means of transportation to work


Drove car alone:
| Wheaton-Glenmont: | 63.4% (17,963) |
| Maryland: | 73.7% (1,910,917) |
Carpooled:
| Wheaton-Glenmont: | 13.6% (3,845) |
| Maryland: | 12.4% (320,992) |
Bus or trolley bus:
| Wheaton-Glenmont: | 8.0% (2,263) |
| Maryland: | 3.6% (93,111) |
Streetcar or trolley car:
| Wheaton-Glenmont: | 0.0% (4) |
| Maryland: | 0.1% (1,619) |
Subway or elevated:
| Wheaton-Glenmont: | 9.1% (2,578) |
| Maryland: | 2.9% (75,090) |
Railroad:
| Wheaton-Glenmont: | 0.3% (86) |
| Maryland: | 0.4% (10,568) |
Ferryboat:
| Wheaton-Glenmont: | 0.0% (8) |
| Maryland: | 0.0% (144) |
Taxicab:
| Wheaton-Glenmont: | 0.3% (96) |
| Maryland: | 0.3% (6,714) |
Bicycle:
| Wheaton-Glenmont: | 0.3% (74) |
| Maryland: | 0.2% (4,843) |
Walked:
| Wheaton-Glenmont: | 1.7% (490) |
| Maryland: | 2.5% (64,852) |
Other means:
| Wheaton-Glenmont: | 0.5% (147) |
| Maryland: | 0.6% (14,621) |
Private vehicle occupancy

Drove alone:
| Wheaton-Glenmont: | 82.4% (17,963) |
| Maryland: | 85.6% (1,910,917) |
In 2 person carpool:
| Wheaton-Glenmont: | 13.2% (2,882) |
| Maryland: | 11.2% (249,591) |
In 3 person carpool:
| Wheaton-Glenmont: | 2.4% (526) |
| Maryland: | 1.9% (43,068) |
In 4 person carpool:
| Wheaton-Glenmont: | 1.0% (226) |
| Maryland: | 0.7% (15,540) |
In 5-6 person carpool:
| Wheaton-Glenmont: | 0.6% (136) |
| Maryland: | 0.3% (6,773) |
In 7+ person carpool:
| Wheaton-Glenmont: | 0.3% (75) |
| Maryland: | 0.3% (6,020) |
Class of workers
Employee of private company:
| Wheaton-Glenmont: | 60.7% (17,394) |
| Maryland: | 60.5% (1,579,238) |
Self-employed in own incorporated business:
| Wheaton-Glenmont: | 2.6% (756) |
| Maryland: | 3.2% (82,204) |
Private not-for-profit wage and salary workers:
| Wheaton-Glenmont: | 10.9% (3,128) |
| Maryland: | 8.4% (219,162) |
Local government workers:
| Wheaton-Glenmont: | 5.7% (1,624) |
| Maryland: | 7.9% (204,895) |
State government workers:
| Wheaton-Glenmont: | 1.7% (481) |
| Maryland: | 4.4% (114,670) |
Federal government workers:
| Wheaton-Glenmont: | 11.9% (3,401) |
| Maryland: | 10.0% (262,046) |
Self-employed workers in own not incorporated business:
| Wheaton-Glenmont: | 6.3% (1,801) |
| Maryland: | 5.4% (140,769) |
Unpaid family workers:
| Wheaton-Glenmont: | 0.2% (62) |
| Maryland: | 0.2% (5,473) |

Employee of private company - Males:
| Wheaton-Glenmont: | 64.3% (9,488) |
| Maryland: | 64.1% (851,203) |
Self-employed in own incorporated business - Males:
| Wheaton-Glenmont: | 4.0% (593) |
| Maryland: | 4.5% (59,935) |
Private not-for-profit wage and salary workers - Males:
| Wheaton-Glenmont: | 7.8% (1,155) |
| Maryland: | 5.6% (74,545) |
Local government workers - Males:
| Wheaton-Glenmont: | 4.2% (626) |
| Maryland: | 6.0% (80,099) |
State government workers - Males:
| Wheaton-Glenmont: | 1.7% (251) |
| Maryland: | 3.8% (49,893) |
Federal government workers - Males:
| Wheaton-Glenmont: | 12.0% (1,774) |
| Maryland: | 9.9% (131,256) |
Self-employed workers in own not incorporated business - Males:
| Wheaton-Glenmont: | 5.7% (837) |
| Maryland: | 6.0% (79,372) |
Unpaid family workers - Males:
| Wheaton-Glenmont: | 0.2% (23) |
| Maryland: | 0.2% (2,117) |

Employee of private company - Females:
| Wheaton-Glenmont: | 56.9% (7,906) |
| Maryland: | 56.9% (728,035) |
Self-employed in own incorporated business - Females:
| Wheaton-Glenmont: | 1.2% (163) |
| Maryland: | 1.7% (22,269) |
Private not-for-profit wage and salary workers - Females:
| Wheaton-Glenmont: | 14.2% (1,973) |
| Maryland: | 11.3% (144,617) |
Local government workers - Females:
| Wheaton-Glenmont: | 7.2% (998) |
| Maryland: | 9.7% (124,796) |
State government workers - Females:
| Wheaton-Glenmont: | 1.7% (230) |
| Maryland: | 5.1% (64,777) |
Federal government workers - Females:
| Wheaton-Glenmont: | 11.7% (1,627) |
| Maryland: | 10.2% (130,790) |
Self-employed workers in own not incorporated business - Females:
| Wheaton-Glenmont: | 6.9% (964) |
| Maryland: | 4.8% (61,397) |
Unpaid family workers - Females:
| Wheaton-Glenmont: | 0.3% (39) |
| Maryland: | 0.3% (3,356) |