Work and Jobs in Wheeling, Illinois (IL) Detailed Stats
Occupations, Industries, Unemployment, Workers, Commute
Settings
X


Recent posts about work in Wheeling, Illinois on our local forum with over 2,400,000 registered users:
 | Relocating for a new job in Wheeling, IL (12 replies) |
| Questionable new GreatSchools rankings (29 replies) |
| Job in Wheeling; Need to move from Naperville (3 replies) |
| new job in riverwoods from denver (10 replies) |
| New job in Wheeling: which school? (19 replies) |
| Libertyville OR Highwood? (28 replies) |
Latest news about work in Wheeling, IL collected exclusively by city-data.com from local newspapers, TV, and radio stations
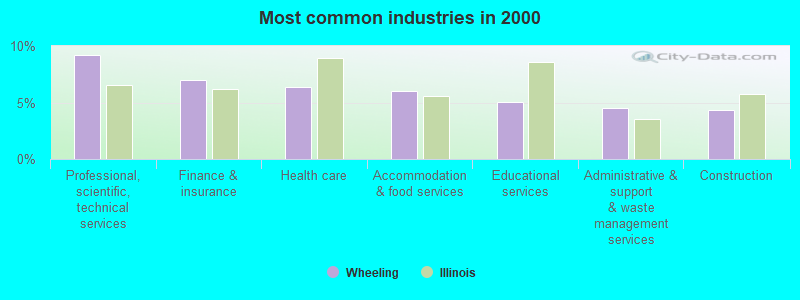
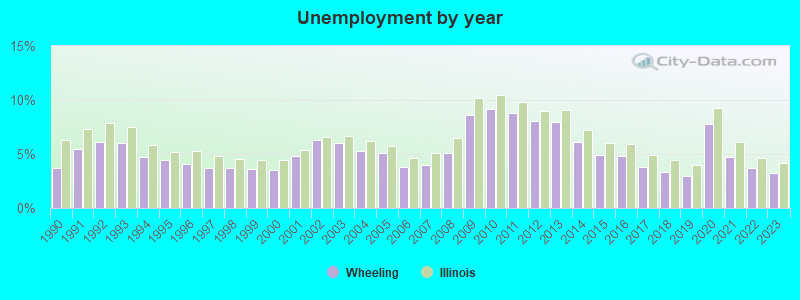
The unemployment rate in 2023 in Wheeling, IL was 3.2%, which was 31.2% less than the unemployment rate of 4.2% across the entire state of Illinois. Compared to the unemployment rate of 8.0% in 2013, this represents a decrease of 150.0%. The most common industries in Wheeling are: Professional, scientific, technical services (9.2% of civilian employees), Finance & insurance (7.0% of civilian employees), Health care (6.3% of civilian employees). 72.4% of workers work in Cook County and 9.2% of all workers work at home. 76.7% of workers are employees of private companies, which is 11.0% greater than the rate of 68.3% across the entire state of Illinois.
Whole page based on the data from 2000 / 2022 when the population of Wheeling, Illinois was 34,496 / 37,961
Whole page based on the data from 2000 / 2022 when the population of Wheeling, Illinois was 34,496 / 37,961
Most common industries
Most common industries | |||
|---|---|---|---|
Industry | All | Males | Females |
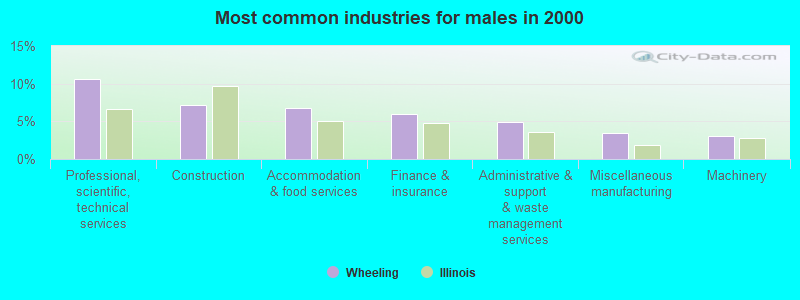
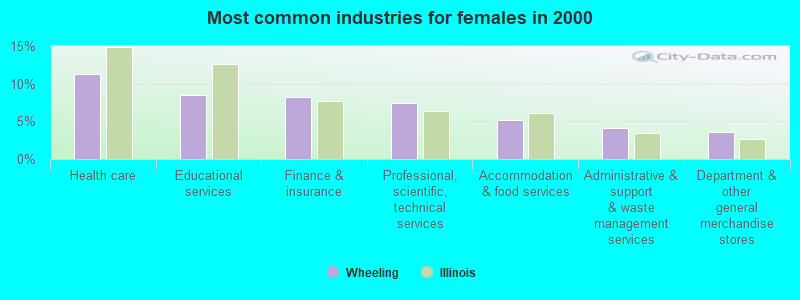
| Professional, scientific, and technical services | 9.2% (1,780) | 10.6% (1,120) | 7.5% (660) |
| Finance and insurance | 7.0% (1,356) | 5.9% (625) | 8.3% (731) |
| Health care | 6.3% (1,224) | 2.2% (230) | 11.3% (994) |
| Accommodation and food services | 6.1% (1,171) | 6.8% (715) | 5.2% (456) |
| Educational services | 5.1% (978) | 2.2% (230) | 8.5% (748) |
| Administrative and support and waste management services | 4.5% (871) | 4.9% (514) | 4.1% (357) |
| Construction | 4.3% (840) | 7.2% (756) | 1.0% (84) |
| Miscellaneous manufacturing | 3.1% (605) | 3.4% (362) | 2.8% (243) |
| Machinery | 2.8% (538) | 3.1% (323) | 2.4% (215) |
| Metal and metal products | 2.7% (517) | 2.8% (294) | 2.5% (223) |
| Computer and electronic products | 2.4% (472) | 2.8% (295) | 2.0% (177) |
| Department and other general merchandise stores | 2.2% (421) | 1.0% (104) | 3.6% (317) |
| Other transportation, and support activities, and couriers | 2.0% (388) | 2.4% (257) | 1.5% (131) |
| Food and beverage stores | 1.7% (324) | 1.8% (191) | 1.5% (133) |
| Repair and maintenance | 1.6% (317) | 2.6% (271) | 0.5% (46) |
| Printing and related support activities | 1.6% (308) | 2.0% (210) | 1.1% (98) |
| Personal and laundry services | 1.6% (307) | 0.8% (89) | 2.5% (218) |
| Public administration | 1.5% (293) | 1.7% (174) | 1.4% (119) |
| Electrical equipment, appliances, and components | 1.5% (291) | 1.7% (175) | 1.3% (116) |
| Social assistance | 1.5% (290) | 0.3% (36) | 2.9% (254) |
| Chemicals | 1.5% (282) | 1.0% (107) | 2.0% (175) |
| Arts, entertainment, and recreation | 1.4% (274) | 1.5% (154) | 1.4% (120) |
| Religious, grantmaking, civic, professional, and similar organizations | 1.4% (273) | 1.1% (112) | 1.8% (161) |
| Plastics and rubber products | 1.4% (273) | 1.6% (165) | 1.2% (108) |
| Real estate and rental and leasing | 1.2% (234) | 1.4% (146) | 1.0% (88) |
| Radio, TV, and computer stores | 1.1% (218) | 1.4% (146) | 0.8% (72) |
| Pharmacies and drug stores | 1.1% (214) | 0.7% (78) | 1.5% (136) |
| Motor vehicle and parts dealers | 1.1% (210) | 1.8% (185) | 0.3% (25) |
| Broadcasting and telecommunications | 1.0% (199) | 1.1% (116) | 0.9% (83) |
| Food | 1.0% (190) | 1.0% (110) | 0.9% (80) |
| Publishing, and motion picture and sound recording industries | 1.0% (186) | 0.7% (69) | 1.3% (117) |
| Data processing, libraries, and other information services | 0.9% (176) | 0.8% (88) | 1.0% (88) |
| Machinery, equipment, and supplies merchant wholesalers | 0.9% (172) | 0.9% (93) | 0.9% (79) |
| U. S. Postal service | 0.9% (169) | 1.3% (140) | 0.3% (29) |
| Electronic shopping and mail-order houses | 0.9% (169) | 0.6% (68) | 1.1% (101) |
| Professional and commercial equipment and supplies merchant wholesalers | 0.8% (153) | 0.9% (98) | 0.6% (55) |
| Truck transportation | 0.8% (153) | 1.4% (146) | 0.1% (7) |
| Clothing and accessories, including shoe, stores | 0.7% (144) | 0.6% (59) | 1.0% (85) |
| Paper | 0.7% (143) | 0.8% (83) | 0.7% (60) |
| Used merchandise, gift, novelty, and souvenir, and other miscellaneous stores | 0.7% (140) | 0.7% (69) | 0.8% (71) |
| Furniture and home furnishings, and household appliance stores | 0.7% (136) | 0.7% (78) | 0.7% (58) |
| Building material and garden equipment and supplies dealers | 0.7% (128) | 1.0% (105) | 0.3% (23) |
| Groceries and related products merchant wholesalers | 0.6% (113) | 0.8% (86) | 0.3% (27) |
| Other direct selling establishments | 0.6% (107) | 0.8% (86) | 0.2% (21) |
| Air transportation | 0.5% (103) | 0.8% (86) | 0.2% (17) |
| Transportation equipment | 0.5% (98) | 0.6% (58) | 0.5% (40) |
| Utilities | 0.5% (94) | 0.6% (59) | 0.4% (35) |
| Miscellaneous nondurable goods merchant wholesalers | 0.5% (90) | 0.5% (48) | 0.5% (42) |
| Furniture and related product manufacturing | 0.5% (90) | 0.6% (58) | 0.4% (32) |
| Management of companies and enterprises | 0.4% (71) | 0.3% (32) | 0.4% (39) |
| Miscellaneous durable goods merchant wholesalers | 0.4% (69) | 0.6% (63) | 0.1% (6) |
| Office supplies and stationery stores | 0.3% (66) | 0.2% (26) | 0.5% (40) |
| Private households | 0.3% (64) | 0.1% (7) | 0.6% (57) |
| Electrical and electronic goods merchant wholesalers | 0.3% (62) | 0.5% (55) | 0.1% (7) |
| Health and personal care, except drug, stores | 0.3% (57) | 0.4% (38) | 0.2% (19) |
| Sewing, needlework, and piece goods stores | 0.3% (51) | 0.2% (25) | 0.3% (26) |
| Jewelry, luggage, and leather goods stores | 0.3% (50) | 0.1% (14) | 0.4% (36) |
| Sporting goods, camera, and hobby and toy stores | 0.2% (46) | 0.2% (19) | 0.3% (27) |
| Agriculture, forestry, fishing and hunting | 0.2% (43) | 0.2% (26) | 0.2% (17) |
| Hardware, plumbing and heating equipment, and supplies merchant wholesalers | 0.2% (43) | 0.3% (28) | 0.2% (15) |
| Nonmetallic mineral products | 0.2% (42) | 0.3% (35) | 0.1% (7) |
| Gasoline stations | 0.2% (35) | 0.3% (28) | 0.1% (7) |
| Music stores | 0.2% (35) | 0.3% (27) | 0.1% (8) |
| Wood products | 0.2% (34) | 0.2% (24) | 0.1% (10) |
| Drugs, sundries, and chemical and allied products merchant wholesalers | 0.2% (29) | 0.3% (29) | 0.0% (0) |
| Textile mills and textile products | 0.2% (29) | 0.1% (14) | 0.2% (15) |
| Book stores and news dealers | 0.1% (28) | 0.2% (24) | 0.0% (4) |
| Paper and paper products merchant wholesalers | 0.1% (26) | 0.1% (8) | 0.2% (18) |
| Apparel | 0.1% (26) | 0.0% (0) | 0.3% (26) |
| Warehousing and storage | 0.1% (24) | 0.2% (24) | 0.0% (0) |
| Petroleum and coal products | 0.1% (22) | 0.1% (11) | 0.1% (11) |
| Apparel, fabrics, and notions merchant wholesalers | 0.1% (21) | 0.0% (0) | 0.2% (21) |
| Alcoholic beverages merchant wholesalers | 0.1% (21) | 0.2% (21) | 0.0% (0) |
| Metals and minerals, except petroleum, merchant wholesalers | 0.1% (13) | 0.1% (13) | 0.0% (0) |
Unemployment in Wheeling
- Unemployment by race in 2022
- Unemployment rate for White non-Hispanic residents
- 4.0%Males
- 3.6%Females
- Unemployment rate for Black residents
- 19.1%Females
- Unemployment rate for Asian residents
- 1.9%Males
- 4.5%Females
- Unemployment rate for other race residents
- 6.0%Males
- 4.8%Females
- Unemployment rate for two or more race residents
- 7.8%Males
- 1.8%Females
- Unemployment rate for Hispanic or Latino residents
- 6.3%Males
- 3.7%Females
- Unemployment by race in 2000
- Unemployment rate for White non-Hispanic residents
- 1.8%Males
- 2.0%Females
- Unemployment rate for Black residents
- 2.9%Males
- 3.0%Females
- Unemployment rate for Asian residents
- 3.2%Males
- 2.8%Females
- Unemployment rate for other race residents
- 5.6%Males
- 8.9%Females
- Unemployment rate for two or more race residents
- 3.5%Males
- 12.7%Females
- Unemployment rate for Hispanic or Latino residents
- 5.4%Males
- 4.8%Females
Unemployment in 2023:
| Wheeling: | 3.2% |
| Illinois: | 4.2% |
Unemployment in 2022:
| Wheeling: | 3.7% |
| Illinois: | 4.6% |
Unemployment in 2021:
| Wheeling: | 4.7% |
| Illinois: | 6.1% |
Unemployment in 2020:
| Wheeling: | 7.8% |
| Illinois: | 9.3% |
Unemployment in 2019:
| Wheeling: | 3.0% |
| Illinois: | 4.0% |
Unemployment in 2018:
| Wheeling: | 3.3% |
| Illinois: | 4.4% |
Unemployment in 2017:
| Wheeling: | 3.8% |
| Illinois: | 4.9% |
Unemployment in 2016:
| Wheeling: | 4.8% |
| Illinois: | 5.9% |
Unemployment in 2015:
| Wheeling: | 4.9% |
| Illinois: | 6.0% |
Unemployment in 2014:
| Wheeling: | 6.1% |
| Illinois: | 7.2% |
Unemployment in 2013:
| Wheeling: | 8.0% |
| Illinois: | 9.1% |
Unemployment in 2012:
| Wheeling: | 8.1% |
| Illinois: | 9.0% |
Unemployment in 2011:
| Wheeling: | 8.8% |
| Illinois: | 9.8% |
Unemployment in 2010:
| Wheeling: | 9.2% |
| Illinois: | 10.5% |
Unemployment in 2009:
| Wheeling: | 8.6% |
| Illinois: | 10.2% |
Unemployment in 2008:
| Wheeling: | 5.1% |
| Illinois: | 6.5% |
Unemployment in 2007:
| Wheeling: | 4.0% |
| Illinois: | 5.1% |
Unemployment in 2006:
| Wheeling: | 3.8% |
| Illinois: | 4.6% |
Unemployment in 2005:
| Wheeling: | 5.1% |
| Illinois: | 5.7% |
Unemployment in 2004:
| Wheeling: | 5.3% |
| Illinois: | 6.2% |
Unemployment in 2003:
| Wheeling: | 6.0% |
| Illinois: | 6.7% |
Unemployment in 2002:
| Wheeling: | 6.3% |
| Illinois: | 6.6% |
Unemployment in 2001:
| Wheeling: | 4.8% |
| Illinois: | 5.4% |
Unemployment in 2000:
| Wheeling: | 3.5% |
| Illinois: | 4.4% |
Unemployment in 1999:
| Wheeling: | 3.6% |
| Illinois: | 4.4% |
Unemployment in 1998:
| Wheeling: | 3.7% |
| Illinois: | 4.5% |
Unemployment in 1997:
| Wheeling: | 3.7% |
| Illinois: | 4.8% |
Unemployment in 1996:
| Wheeling: | 4.1% |
| Illinois: | 5.3% |
Unemployment in 1995:
| Wheeling: | 4.4% |
| Illinois: | 5.2% |
Unemployment in 1994:
| Wheeling: | 4.7% |
| Illinois: | 5.8% |
Unemployment in 1993:
| Wheeling: | 6.0% |
| Illinois: | 7.5% |
Unemployment in 1992:
| Wheeling: | 6.1% |
| Illinois: | 7.9% |
Unemployment in 1991:
| Wheeling: | 5.5% |
| Illinois: | 7.3% |
Unemployment in 1990:
| Wheeling: | 3.7% |
| Illinois: | 6.3% |
Time leaving home to go to work
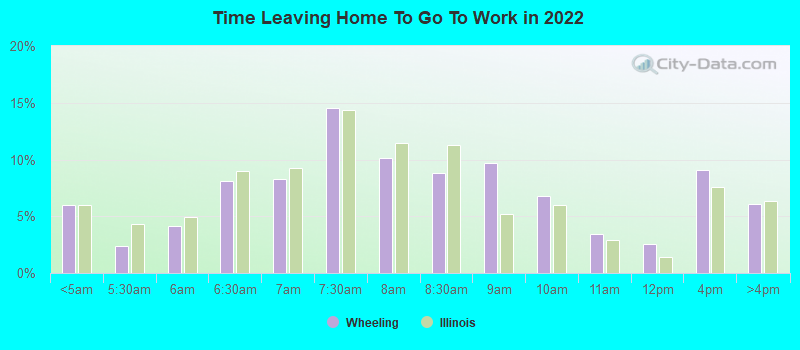
12:00 a.m. to 4:59 a.m.:
| Wheeling: | 6.0% (1,107) |
| Illinois: | 6.0% (313,385) |
5:00 a.m. to 5:29 a.m.:
| Wheeling: | 2.3% (436) |
| Illinois: | 4.3% (226,583) |
5:30 a.m. to 5:59 a.m.:
| Wheeling: | 4.2% (776) |
| Illinois: | 4.9% (254,951) |
6:00 a.m. to 6:29 a.m.:
| Wheeling: | 8.1% (1,503) |
| Illinois: | 8.9% (466,416) |
6:30 a.m. to 6:59 a.m.:
| Wheeling: | 8.3% (1,541) |
| Illinois: | 9.3% (484,300) |
7:00 a.m. to 7:29 a.m.:
| Wheeling: | 14.5% (2,693) |
| Illinois: | 14.3% (746,798) |
7:30 a.m. to 7:59 a.m.:
| Wheeling: | 10.1% (1,876) |
| Illinois: | 11.5% (597,236) |
8:00 a.m. to 8:29 a.m.:
| Wheeling: | 8.8% (1,637) |
| Illinois: | 11.2% (585,810) |
8:30 a.m. to 8:59 a.m.:
| Wheeling: | 9.7% (1,801) |
| Illinois: | 5.2% (271,981) |
9:00 a.m. to 9:59 a.m.:
| Wheeling: | 6.8% (1,260) |
| Illinois: | 6.0% (310,820) |
10:00 a.m. to 10:59 a.m.:
| Wheeling: | 3.4% (637) |
| Illinois: | 2.9% (153,745) |
11:00 a.m. to 11:59 a.m.:
| Wheeling: | 2.5% (472) |
| Illinois: | 1.4% (74,140) |
12:00 p.m. to 3:59 p.m.:
| Wheeling: | 9.0% (1,677) |
| Illinois: | 7.6% (397,128) |
4:00 p.m. to 11:59 p.m.:
| Wheeling: | 6.1% (1,124) |
| Illinois: | 6.3% (328,692) |

<5am:
| Wheeling: | 2.6% (486) |
| Illinois: | 3.6% (205,429) |
5:30am:
| Wheeling: | 2.5% (480) |
| Illinois: | 3.5% (199,483) |
6am:
| Wheeling: | 4.8% (914) |
| Illinois: | 4.8% (274,395) |
6:30am:
| Wheeling: | 9.5% (1,794) |
| Illinois: | 9.3% (532,224) |
7am:
| Wheeling: | 11.6% (2,203) |
| Illinois: | 10.3% (593,196) |
7:30am:
| Wheeling: | 14.8% (2,796) |
| Illinois: | 14.1% (808,399) |
8am:
| Wheeling: | 15.1% (2,860) |
| Illinois: | 14.5% (834,444) |
8:30am:
| Wheeling: | 11.4% (2,151) |
| Illinois: | 10.2% (588,282) |
9am:
| Wheeling: | 6.1% (1,151) |
| Illinois: | 4.6% (266,648) |
10am:
| Wheeling: | 5.5% (1,040) |
| Illinois: | 4.7% (269,854) |
11am:
| Wheeling: | 2.8% (528) |
| Illinois: | 2.1% (118,418) |
12pm:
| Wheeling: | 0.8% (158) |
| Illinois: | 1.0% (59,913) |
4pm:
| Wheeling: | 5.2% (979) |
| Illinois: | 7.4% (425,049) |
>4pm:
| Wheeling: | 5.4% (1,031) |
| Illinois: | 6.8% (393,506) |

12:00 a.m. to 4:59 a.m. - Males:
| Wheeling: | 8.2% (816) |
| Illinois: | 7.8% (217,984) |
5:00 a.m. to 5:29 a.m. - Males:
| Wheeling: | 3.2% (321) |
| Illinois: | 5.9% (165,953) |
5:30 a.m. to 5:59 a.m. - Males:
| Wheeling: | 4.5% (445) |
| Illinois: | 6.1% (170,969) |
6:00 a.m. to 6:29 a.m. - Males:
| Wheeling: | 8.2% (818) |
| Illinois: | 10.5% (292,003) |
6:30 a.m. to 6:59 a.m. - Males:
| Wheeling: | 9.0% (901) |
| Illinois: | 9.4% (261,362) |
7:00 a.m. to 7:29 a.m. - Males:
| Wheeling: | 15.5% (1,549) |
| Illinois: | 12.9% (360,098) |
7:30 a.m. to 7:59 a.m. - Males:
| Wheeling: | 7.8% (775) |
| Illinois: | 9.5% (265,464) |
8:00 a.m. to 8:29 a.m. - Males:
| Wheeling: | 8.4% (842) |
| Illinois: | 10.1% (280,890) |
8:30 a.m. to 8:59 a.m. - Males:
| Wheeling: | 8.1% (807) |
| Illinois: | 4.4% (122,100) |
9:00 a.m. to 9:59 a.m. - Males:
| Wheeling: | 5.4% (536) |
| Illinois: | 5.1% (141,789) |
10:00 a.m. to 10:59 a.m. - Males:
| Wheeling: | 2.9% (286) |
| Illinois: | 2.6% (72,802) |
11:00 a.m. to 11:59 a.m. - Males:
| Wheeling: | 1.9% (187) |
| Illinois: | 1.4% (38,018) |
12:00 p.m. to 3:59 p.m. - Males:
| Wheeling: | 9.8% (982) |
| Illinois: | 8.0% (224,733) |
4:00 p.m. to 11:59 p.m. - Males:
| Wheeling: | 7.1% (708) |
| Illinois: | 6.4% (179,820) |

12:00 a.m. to 4:59 a.m. - Females:
| Wheeling: | 3.4% (292) |
| Illinois: | 3.9% (95,401) |
5:00 a.m. to 5:29 a.m. - Females:
| Wheeling: | 1.3% (114) |
| Illinois: | 2.5% (60,630) |
5:30 a.m. to 5:59 a.m. - Females:
| Wheeling: | 3.9% (334) |
| Illinois: | 3.5% (83,982) |
6:00 a.m. to 6:29 a.m. - Females:
| Wheeling: | 8.0% (688) |
| Illinois: | 7.2% (174,413) |
6:30 a.m. to 6:59 a.m. - Females:
| Wheeling: | 7.4% (638) |
| Illinois: | 9.2% (222,938) |
7:00 a.m. to 7:29 a.m. - Females:
| Wheeling: | 13.1% (1,126) |
| Illinois: | 16.0% (386,700) |
7:30 a.m. to 7:59 a.m. - Females:
| Wheeling: | 12.8% (1,098) |
| Illinois: | 13.7% (331,772) |
8:00 a.m. to 8:29 a.m. - Females:
| Wheeling: | 9.3% (796) |
| Illinois: | 12.6% (304,920) |
8:30 a.m. to 8:59 a.m. - Females:
| Wheeling: | 11.5% (990) |
| Illinois: | 6.2% (149,881) |
9:00 a.m. to 9:59 a.m. - Females:
| Wheeling: | 8.4% (724) |
| Illinois: | 7.0% (169,031) |
10:00 a.m. to 10:59 a.m. - Females:
| Wheeling: | 4.1% (352) |
| Illinois: | 3.3% (80,943) |
11:00 a.m. to 11:59 a.m. - Females:
| Wheeling: | 3.2% (277) |
| Illinois: | 1.5% (36,122) |
12:00 p.m. to 3:59 p.m. - Females:
| Wheeling: | 8.1% (693) |
| Illinois: | 7.1% (172,395) |
4:00 p.m. to 11:59 p.m. - Females:
| Wheeling: | 4.9% (418) |
| Illinois: | 6.2% (148,872) |
Travel time to work
Percentage of workers working in this county: 72.4%
Number of people working at home: 1,997 (9.2% of all workers)
Daytime population change due to commuting: +3,406 (+9.9%)
Workers who live and work in this village: 2,902 (15.3%)
Number of people working at home: 1,997 (9.2% of all workers)
Daytime population change due to commuting: +3,406 (+9.9%)
Workers who live and work in this village: 2,902 (15.3%)

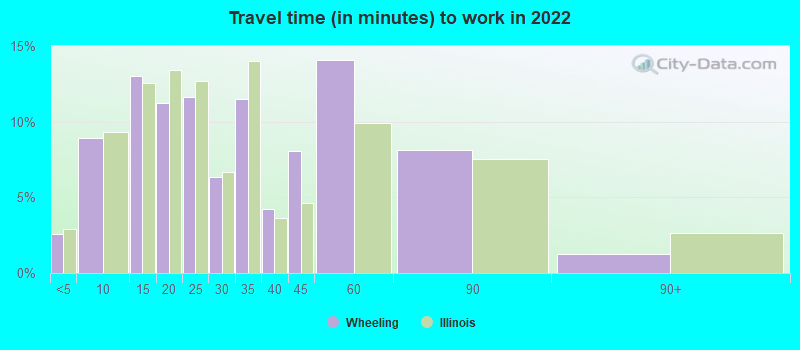

Less than 5 minutes:
| Wheeling: | 2.6% (470) |
| Illinois: | 2.9% (151,500) |
5 to 9 minutes:
| Wheeling: | 8.9% (1,626) |
| Illinois: | 9.3% (484,780) |
10 to 14 minutes:
| Wheeling: | 13.0% (2,369) |
| Illinois: | 12.6% (654,154) |
15 to 19 minutes:
| Wheeling: | 11.2% (2,049) |
| Illinois: | 13.4% (697,690) |
20 to 24 minutes:
| Wheeling: | 11.6% (2,114) |
| Illinois: | 12.7% (661,266) |
25 to 29 minutes:
| Wheeling: | 6.3% (1,153) |
| Illinois: | 6.6% (345,772) |
30 to 34 minutes:
| Wheeling: | 11.5% (2,095) |
| Illinois: | 14.0% (729,633) |
35 to 39 minutes:
| Wheeling: | 4.2% (774) |
| Illinois: | 3.6% (189,131) |
40 to 44 minutes:
| Wheeling: | 8.1% (1,471) |
| Illinois: | 4.6% (241,655) |
45 to 59 minutes:
| Wheeling: | 14.1% (2,563) |
| Illinois: | 9.9% (515,517) |
60 to 89 minutes:
| Wheeling: | 8.1% (1,484) |
| Illinois: | 7.5% (392,412) |
90 or more minutes:
| Wheeling: | 1.2% (227) |
| Illinois: | 2.7% (139,001) |


Less than 5 minutes:
| Wheeling: | 1.9% (351) |
| Illinois: | 3.2% (183,600) |
5 to 9 minutes:
| Wheeling: | 9.0% (1,709) |
| Illinois: | 10.2% (587,746) |
10 to 14 minutes:
| Wheeling: | 13.3% (2,512) |
| Illinois: | 12.9% (743,149) |
15 to 19 minutes:
| Wheeling: | 14.5% (2,738) |
| Illinois: | 13.0% (748,578) |
20 to 24 minutes:
| Wheeling: | 15.9% (3,004) |
| Illinois: | 12.2% (703,743) |
25 to 29 minutes:
| Wheeling: | 7.5% (1,415) |
| Illinois: | 5.2% (298,361) |
30 to 34 minutes:
| Wheeling: | 15.2% (2,870) |
| Illinois: | 12.9% (741,188) |
35 to 39 minutes:
| Wheeling: | 2.9% (554) |
| Illinois: | 2.9% (165,521) |
40 to 44 minutes:
| Wheeling: | 3.9% (737) |
| Illinois: | 4.3% (244,350) |
45 to 59 minutes:
| Wheeling: | 6.8% (1,290) |
| Illinois: | 9.6% (551,290) |
60 to 89 minutes:
| Wheeling: | 5.2% (991) |
| Illinois: | 7.5% (432,921) |
90 or more minutes:
| Wheeling: | 2.1% (400) |
| Illinois: | 2.9% (168,793) |

Less than 5 minutes - Males:
| Wheeling: | 1.3% (152) |
| Illinois: | 2.6% (74,189) |
5 to 9 minutes - Males:
| Wheeling: | 8.6% (995) |
| Illinois: | 8.4% (236,590) |
10 to 14 minutes - Males:
| Wheeling: | 13.5% (1,562) |
| Illinois: | 11.7% (327,032) |
15 to 19 minutes - Males:
| Wheeling: | 9.9% (1,152) |
| Illinois: | 12.6% (352,436) |
20 to 24 minutes - Males:
| Wheeling: | 10.6% (1,229) |
| Illinois: | 12.7% (354,987) |
25 to 29 minutes - Males:
| Wheeling: | 7.7% (893) |
| Illinois: | 6.6% (186,300) |
30 to 34 minutes - Males:
| Wheeling: | 10.7% (1,242) |
| Illinois: | 14.4% (404,047) |
35 to 39 minutes - Males:
| Wheeling: | 4.0% (463) |
| Illinois: | 3.8% (105,284) |
40 to 44 minutes - Males:
| Wheeling: | 8.9% (1,032) |
| Illinois: | 4.9% (137,110) |
45 to 59 minutes - Males:
| Wheeling: | 14.4% (1,673) |
| Illinois: | 10.7% (299,173) |
60 to 89 minutes - Males:
| Wheeling: | 10.0% (1,165) |
| Illinois: | 8.5% (238,838) |
90 or more minutes - Males:
| Wheeling: | 1.5% (169) |
| Illinois: | 3.1% (85,766) |

Less than 5 minutes - Females:
| Wheeling: | 5.0% (333) |
| Illinois: | 3.2% (77,311) |
5 to 9 minutes - Females:
| Wheeling: | 9.6% (638) |
| Illinois: | 10.3% (248,190) |
10 to 14 minutes - Females:
| Wheeling: | 12.4% (824) |
| Illinois: | 13.6% (327,122) |
15 to 19 minutes - Females:
| Wheeling: | 13.6% (897) |
| Illinois: | 14.4% (345,254) |
20 to 24 minutes - Females:
| Wheeling: | 13.4% (888) |
| Illinois: | 12.8% (306,279) |
25 to 29 minutes - Females:
| Wheeling: | 3.9% (255) |
| Illinois: | 6.6% (159,472) |
30 to 34 minutes - Females:
| Wheeling: | 12.9% (853) |
| Illinois: | 13.6% (325,586) |
35 to 39 minutes - Females:
| Wheeling: | 4.7% (314) |
| Illinois: | 3.5% (83,847) |
40 to 44 minutes - Females:
| Wheeling: | 6.4% (424) |
| Illinois: | 4.4% (104,545) |
45 to 59 minutes - Females:
| Wheeling: | 13.5% (896) |
| Illinois: | 9.0% (216,344) |
60 to 89 minutes - Females:
| Wheeling: | 4.9% (323) |
| Illinois: | 6.4% (153,574) |
90 or more minutes - Females:
| Wheeling: | 0.9% (57) |
| Illinois: | 2.2% (53,235) |
Means of transportation to work
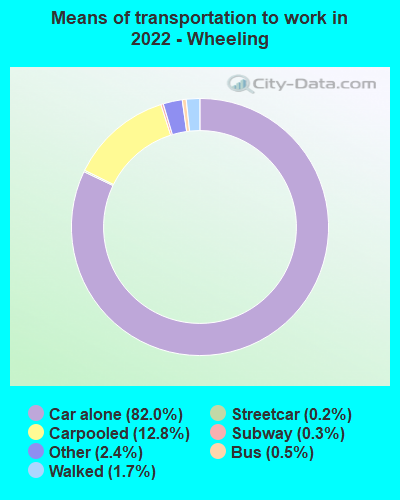
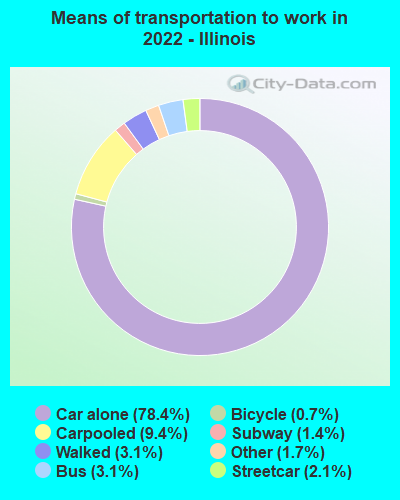
Drove car alone:
| Wheeling: | 82.0% (15,849) |
| Illinois: | 78.4% (1,864,540) |
Carpooled:
| Wheeling: | 12.8% (2,474) |
| Illinois: | 9.4% (240,564) |
Bus:
| Wheeling: | 0.5% (94) |
| Illinois: | 3.1% (85,770) |
Subway or elevated rail:
| Wheeling: | 0.2% (30) |
| Illinois: | 2.1% (52,750) |
Long-distance train or commuter rail:
| Wheeling: | 0.3% (68) |
| Illinois: | 1.4% (30,291) |
Bicycle:
| Wheeling: | 0.1% (15) |
| Illinois: | 0.7% (8,982) |
Walked:
| Wheeling: | 1.7% (320) |
| Illinois: | 3.1% (75,886) |
Other means:
| Wheeling: | 2.4% (473) |
| Illinois: | 1.7% (40,328) |

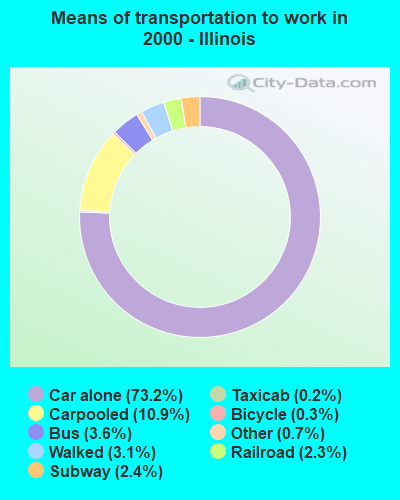
Drove car alone:
| Wheeling: | 79.9% (15,123) |
| Illinois: | 73.2% (4,207,339) |
Carpooled:
| Wheeling: | 12.5% (2,358) |
| Illinois: | 10.9% (625,411) |
Bus or trolley bus:
| Wheeling: | 0.3% (66) |
| Illinois: | 3.6% (207,517) |
Subway or elevated:
| Wheeling: | 0.2% (40) |
| Illinois: | 2.4% (137,996) |
Railroad:
| Wheeling: | 2.6% (490) |
| Illinois: | 2.3% (134,567) |
Ferryboat:
| Wheeling: | 0.0% (8) |
| Illinois: | 0.0% (522) |
Taxicab:
| Wheeling: | 0.1% (24) |
| Illinois: | 0.2% (14,101) |
Bicycle:
| Wheeling: | 0.5% (88) |
| Illinois: | 0.3% (18,406) |
Walked:
| Wheeling: | 1.8% (332) |
| Illinois: | 3.1% (180,119) |
Other means:
| Wheeling: | 0.2% (42) |
| Illinois: | 0.7% (37,823) |

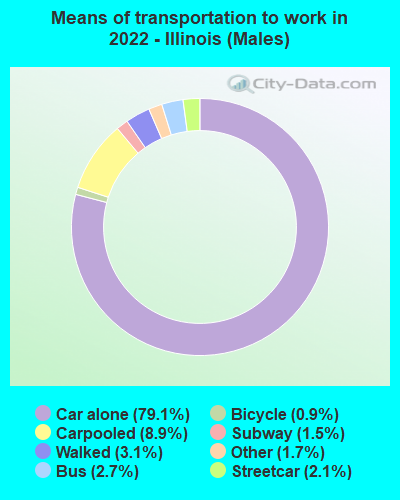
Drove car alone - Males:
| Wheeling: | 83.8% (10,213) |
| Illinois: | 79.1% (1,864,540) |
Carpooled - Males:
| Wheeling: | 13.0% (1,587) |
| Illinois: | 8.9% (240,564) |
Bus - Males:
| Wheeling: | 0.4% (45) |
| Illinois: | 2.7% (85,770) |
Subway or elevated rail - Males:
| Wheeling: | 0.1% (8) |
| Illinois: | 2.1% (52,750) |
Long-distance train or commuter rail - Males:
| Wheeling: | 0.5% (56) |
| Illinois: | 1.5% (30,291) |
Bicycle - Males:
| Wheeling: | 0.1% (8) |
| Illinois: | 0.9% (8,982) |
Walked - Males:
| Wheeling: | 1.8% (217) |
| Illinois: | 3.1% (75,886) |
Other means - Males:
| Wheeling: | 0.4% (54) |
| Illinois: | 1.7% (40,328) |

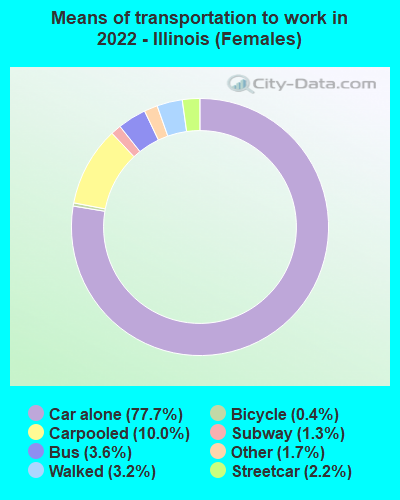
Drove car alone - Females:
| Wheeling: | 79.0% (5,608) |
| Illinois: | 77.7% (1,864,540) |
Carpooled - Females:
| Wheeling: | 12.4% (883) |
| Illinois: | 10.0% (240,564) |
Bus - Females:
| Wheeling: | 0.7% (49) |
| Illinois: | 3.6% (85,770) |
Subway or elevated rail - Females:
| Wheeling: | 0.3% (22) |
| Illinois: | 2.2% (52,750) |
Long-distance train or commuter rail - Females:
| Wheeling: | 0.2% (11) |
| Illinois: | 1.3% (30,291) |
Bicycle - Females:
| Wheeling: | 0.1% (7) |
| Illinois: | 0.4% (8,982) |
Walked - Females:
| Wheeling: | 1.4% (102) |
| Illinois: | 3.2% (75,886) |
Other means - Females:
| Wheeling: | 5.9% (421) |
| Illinois: | 1.7% (40,328) |
Private vehicle occupancy

Drove alone:
| Wheeling: | 84.4% (15,101) |
| Illinois: | 89.3% (4,089,987) |
In 2 person carpool:
| Wheeling: | 9.4% (1,690) |
| Illinois: | 7.9% (361,887) |
In 3 person carpool:
| Wheeling: | 3.8% (676) |
| Illinois: | 1.7% (77,481) |
In 4 person carpool:
| Wheeling: | 2.1% (384) |
| Illinois: | 0.7% (31,281) |
In 5-6 person carpool:
| Wheeling: | 0.2% (34) |
| Illinois: | 0.3% (13,813) |
In 7+ person carpool:
| Wheeling: | 0.1% (11) |
| Illinois: | 0.1% (6,460) |

Drove alone:
| Wheeling: | 86.5% (15,123) |
| Illinois: | 87.1% (4,207,339) |
In 2 person carpool:
| Wheeling: | 10.6% (1,857) |
| Illinois: | 10.0% (484,652) |
In 3 person carpool:
| Wheeling: | 1.9% (333) |
| Illinois: | 1.7% (84,139) |
In 4 person carpool:
| Wheeling: | 0.7% (123) |
| Illinois: | 0.6% (30,865) |
In 5-6 person carpool:
| Wheeling: | 0.3% (45) |
| Illinois: | 0.3% (15,487) |
Class of workers
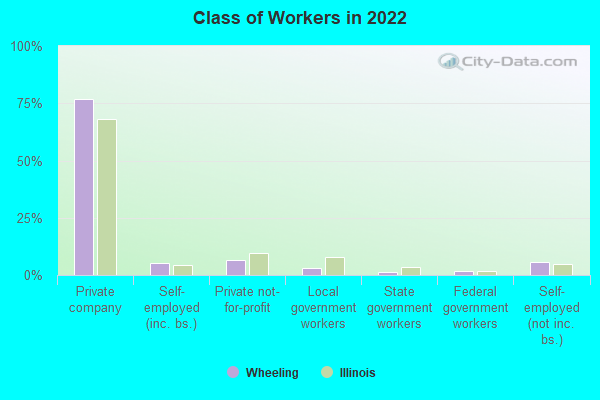
Employee of private company:
| Wheeling: | 76.7% (16,900) |
| Illinois: | 68.3% (4,298,982) |
Self-employed in own incorporated business:
| Wheeling: | 5.1% (1,125) |
| Illinois: | 4.3% (267,866) |
Private not-for-profit wage and salary workers:
| Wheeling: | 6.5% (1,442) |
| Illinois: | 9.5% (597,909) |
Local government workers:
| Wheeling: | 2.9% (629) |
| Illinois: | 7.8% (491,805) |
State government workers:
| Wheeling: | 1.1% (246) |
| Illinois: | 3.3% (207,590) |
Federal government workers:
| Wheeling: | 1.7% (365) |
| Illinois: | 1.9% (122,680) |
Self-employed workers in own not incorporated business:
| Wheeling: | 5.6% (1,244) |
| Illinois: | 4.7% (295,989) |
Unpaid family workers:
| Wheeling: | 0.3% (74) |
| Illinois: | 0.2% (10,986) |

Employee of private company:
| Wheeling: | 81.1% (15,667) |
| Illinois: | 70.3% (4,102,786) |
Self-employed in own incorporated business:
| Wheeling: | 2.4% (463) |
| Illinois: | 3.2% (184,981) |
Private not-for-profit wage and salary workers:
| Wheeling: | 5.6% (1,089) |
| Illinois: | 8.3% (484,163) |
Local government workers:
| Wheeling: | 4.5% (868) |
| Illinois: | 6.8% (395,132) |
State government workers:
| Wheeling: | 1.1% (207) |
| Illinois: | 3.8% (220,995) |
Federal government workers:
| Wheeling: | 1.4% (269) |
| Illinois: | 2.1% (121,776) |
Self-employed workers in own not incorporated business:
| Wheeling: | 3.7% (711) |
| Illinois: | 5.3% (307,691) |
Unpaid family workers:
| Wheeling: | 0.3% (55) |
| Illinois: | 0.3% (15,661) |

Employee of private company - Males:
| Wheeling: | 77.7% (9,189) |
| Illinois: | 72.3% (2,390,375) |
Self-employed in own incorporated business - Males:
| Wheeling: | 7.1% (841) |
| Illinois: | 5.4% (179,821) |
Private not-for-profit wage and salary workers - Males:
| Wheeling: | 4.5% (533) |
| Illinois: | 6.2% (205,628) |
Local government workers - Males:
| Wheeling: | 2.5% (300) |
| Illinois: | 5.9% (193,630) |
State government workers - Males:
| Wheeling: | 0.5% (63) |
| Illinois: | 3.0% (98,934) |
Federal government workers - Males:
| Wheeling: | 0.5% (63) |
| Illinois: | 2.0% (64,842) |
Self-employed workers in own not incorporated business - Males:
| Wheeling: | 6.7% (795) |
| Illinois: | 5.1% (167,665) |
Unpaid family workers - Males:
| Wheeling: | 0.3% (39) |
| Illinois: | 0.2% (6,269) |

Employee of private company - Females:
| Wheeling: | 75.6% (7,711) |
| Illinois: | 63.9% (1,908,607) |
Self-employed in own incorporated business - Females:
| Wheeling: | 2.8% (285) |
| Illinois: | 2.9% (88,045) |
Private not-for-profit wage and salary workers - Females:
| Wheeling: | 8.9% (909) |
| Illinois: | 13.1% (392,281) |
Local government workers - Females:
| Wheeling: | 3.2% (330) |
| Illinois: | 10.0% (298,175) |
State government workers - Females:
| Wheeling: | 1.8% (182) |
| Illinois: | 3.6% (108,656) |
Federal government workers - Females:
| Wheeling: | 3.0% (302) |
| Illinois: | 1.9% (57,838) |
Self-employed workers in own not incorporated business - Females:
| Wheeling: | 4.4% (449) |
| Illinois: | 4.3% (128,324) |
Unpaid family workers - Females:
| Wheeling: | 0.3% (35) |
| Illinois: | 0.2% (4,717) |