Work and Jobs in Zionsville, Indiana (IN) Detailed Stats
Occupations, Industries, Unemployment, Workers, Commute
Settings
X


Recent posts about work in Zionsville, Indiana on our local forum with over 2,400,000 registered users:
 | Commuting from Louisville to Indy (227 replies) |
| Senior housing near Zionsville (1 reply) |
| Is my impression of Indianapolis accurate? (167 replies) |
| Retired, live in Columbus, thinking about a move.... (10 replies) |
| Looking to Move to Indianapolis area (33 replies) |
| Life in Zionsville Indiana (15 replies) |
Latest news about work in Zionsville, IN collected exclusively by city-data.com from local newspapers, TV, and radio stations
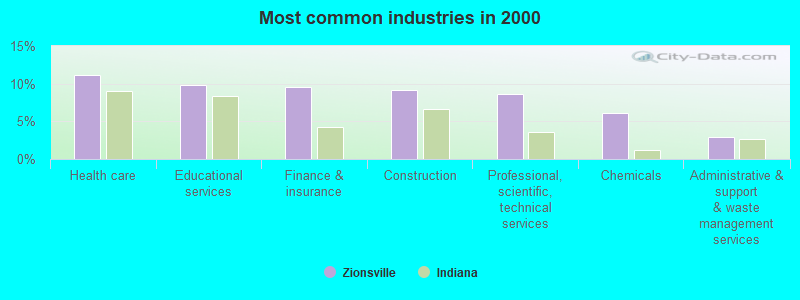
The most common industries in Zionsville are: Health care (11.1% of civilian employees), Educational services (9.8% of civilian employees), Finance & insurance (9.6% of civilian employees). 43.7% of workers work in Boone County and 23.9% of all workers work at home. 65.8% of workers are employees of private companies, which is 7.0% less than the rate of 70.4% across the entire state of Indiana.
Whole page based on the data from 2000 / 2022 when the population of Zionsville, Indiana was 8,775 / 32,100
Whole page based on the data from 2000 / 2022 when the population of Zionsville, Indiana was 8,775 / 32,100
Most common industries
Most common industries | |||
|---|---|---|---|
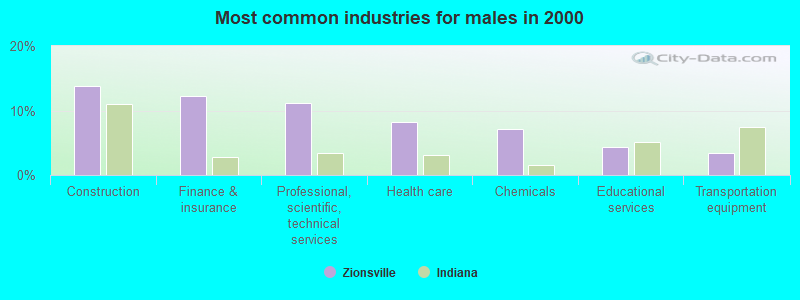
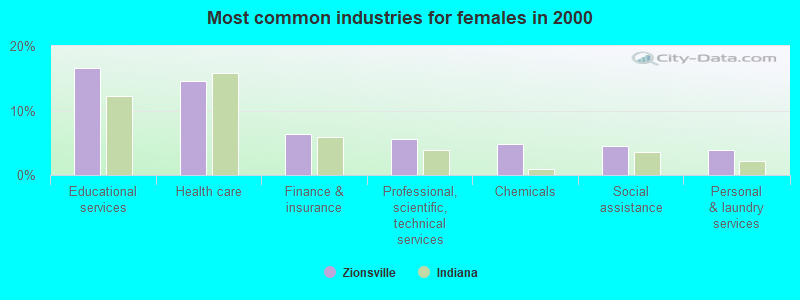
Industry | All | Males | Females |
| Health care | 11.1% (426) | 8.2% (174) | 14.6% (252) |
| Educational services | 9.8% (377) | 4.3% (91) | 16.6% (286) |
| Finance and insurance | 9.6% (368) | 12.2% (258) | 6.4% (110) |
| Construction | 9.1% (350) | 13.9% (293) | 3.3% (57) |
| Professional, scientific, and technical services | 8.6% (330) | 11.1% (235) | 5.5% (95) |
| Chemicals | 6.1% (235) | 7.2% (152) | 4.8% (83) |
| Administrative and support and waste management services | 3.0% (114) | 3.0% (63) | 3.0% (51) |
| Accommodation and food services | 2.5% (96) | 1.6% (33) | 3.7% (63) |
| Public administration | 2.5% (96) | 2.4% (50) | 2.7% (46) |
| Social assistance | 2.2% (86) | 0.4% (9) | 4.5% (77) |
| Transportation equipment | 2.1% (82) | 3.4% (72) | 0.6% (10) |
| Religious, grantmaking, civic, professional, and similar organizations | 2.1% (81) | 2.5% (53) | 1.6% (28) |
| Real estate and rental and leasing | 2.0% (78) | 1.9% (40) | 2.2% (38) |
| Personal and laundry services | 2.0% (75) | 0.4% (8) | 3.9% (67) |
| Arts, entertainment, and recreation | 2.0% (75) | 0.7% (15) | 3.5% (60) |
| Food | 1.7% (64) | 3.0% (64) | 0.0% (0) |
| Radio, TV, and computer stores | 1.6% (62) | 2.0% (42) | 1.2% (20) |
| Department and other general merchandise stores | 1.6% (62) | 2.0% (43) | 1.1% (19) |
| Machinery | 1.6% (62) | 2.9% (62) | 0.0% (0) |
| Used merchandise, gift, novelty, and souvenir, and other miscellaneous stores | 1.3% (49) | 0.0% (0) | 2.8% (49) |
| Truck transportation | 1.2% (45) | 1.1% (24) | 1.2% (21) |
| Miscellaneous manufacturing | 1.0% (38) | 0.8% (17) | 1.2% (21) |
| Air transportation | 1.0% (38) | 1.3% (28) | 0.6% (10) |
| Other transportation, and support activities, and couriers | 1.0% (37) | 1.2% (26) | 0.6% (11) |
| Repair and maintenance | 0.9% (35) | 0.7% (14) | 1.2% (21) |
| Drugs, sundries, and chemical and allied products merchant wholesalers | 0.9% (34) | 1.1% (23) | 0.6% (11) |
| Data processing, libraries, and other information services | 0.8% (30) | 0.4% (8) | 1.3% (22) |
| Nonmetallic mineral products | 0.8% (29) | 1.4% (29) | 0.0% (0) |
| Computer and electronic products | 0.8% (29) | 1.4% (29) | 0.0% (0) |
| Broadcasting and telecommunications | 0.8% (29) | 0.3% (6) | 1.3% (23) |
| Petroleum and petroleum products merchant wholesalers | 0.7% (25) | 0.4% (9) | 0.9% (16) |
| Utilities | 0.6% (23) | 0.7% (14) | 0.5% (9) |
| Jewelry, luggage, and leather goods stores | 0.5% (21) | 0.0% (0) | 1.2% (21) |
| Electrical equipment, appliances, and components | 0.5% (20) | 0.9% (20) | 0.0% (0) |
| Pharmacies and drug stores | 0.5% (19) | 0.0% (0) | 1.1% (19) |
| Plastics and rubber products | 0.5% (19) | 0.9% (19) | 0.0% (0) |
| Metal and metal products | 0.4% (17) | 0.3% (6) | 0.6% (11) |
| Furniture and related product manufacturing | 0.4% (15) | 0.7% (15) | 0.0% (0) |
| Motor vehicle and parts dealers | 0.4% (15) | 0.0% (0) | 0.9% (15) |
| Leather and allied products | 0.3% (13) | 0.0% (0) | 0.8% (13) |
| Machinery, equipment, and supplies merchant wholesalers | 0.3% (13) | 0.6% (13) | 0.0% (0) |
| Professional and commercial equipment and supplies merchant wholesalers | 0.3% (12) | 0.6% (12) | 0.0% (0) |
| Furniture and home furnishings, and household appliance stores | 0.3% (12) | 0.0% (0) | 0.7% (12) |
| Gasoline stations | 0.3% (10) | 0.0% (0) | 0.6% (10) |
| Groceries and related products merchant wholesalers | 0.3% (10) | 0.0% (0) | 0.6% (10) |
| Motor vehicles, parts and supplies merchant wholesalers | 0.2% (9) | 0.4% (9) | 0.0% (0) |
| Printing and related support activities | 0.2% (9) | 0.4% (9) | 0.0% (0) |
| Paper | 0.2% (9) | 0.0% (0) | 0.5% (9) |
| Food and beverage stores | 0.2% (9) | 0.4% (9) | 0.0% (0) |
| Retail florists | 0.2% (8) | 0.0% (0) | 0.5% (8) |
| Building material and garden equipment and supplies dealers | 0.2% (8) | 0.4% (8) | 0.0% (0) |
| Electrical and electronic goods merchant wholesalers | 0.2% (8) | 0.0% (0) | 0.5% (8) |
| Health and personal care, except drug, stores | 0.2% (7) | 0.0% (0) | 0.4% (7) |
| Clothing and accessories, including shoe, stores | 0.2% (6) | 0.0% (0) | 0.3% (6) |
| Recyclable material merchant wholesalers | 0.2% (6) | 0.3% (6) | 0.0% (0) |
| Music stores | 0.1% (5) | 0.2% (5) | 0.0% (0) |
Unemployment in Zionsville
- Unemployment by race in 2022
- Unemployment rate for White non-Hispanic residents
- 3.6%Males
- 4.0%Females
- Unemployment rate for Black residents
- 3.4%Males
- Unemployment rate for American Indian and Alaska Native residents
- 18.4%Females
- Unemployment rate for Asian residents
- 12.4%Males
- 4.3%Females
- Unemployment rate for two or more race residents
- 17.5%Females
- Unemployment rate for Hispanic or Latino residents
- 8.0%Males
- 3.7%Females
- Unemployment by race in 2000
- Unemployment rate for White non-Hispanic residents
- 1.6%Males
- 1.4%Females
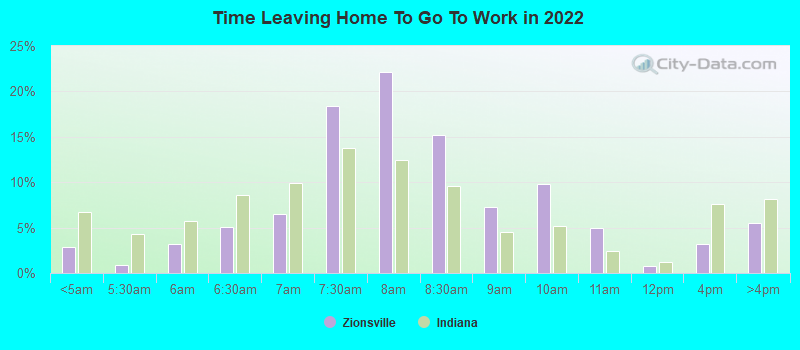
Time leaving home to go to work
12:00 a.m. to 4:59 a.m.:
| Zionsville: | 2.9% (344) |
| Indiana: | 6.7% (197,318) |
5:00 a.m. to 5:29 a.m.:
| Zionsville: | 0.9% (108) |
| Indiana: | 4.3% (127,615) |
5:30 a.m. to 5:59 a.m.:
| Zionsville: | 3.2% (378) |
| Indiana: | 5.8% (169,418) |
6:00 a.m. to 6:29 a.m.:
| Zionsville: | 5.1% (605) |
| Indiana: | 8.6% (252,586) |
6:30 a.m. to 6:59 a.m.:
| Zionsville: | 6.5% (763) |
| Indiana: | 9.9% (291,856) |
7:00 a.m. to 7:29 a.m.:
| Zionsville: | 18.3% (2,168) |
| Indiana: | 13.7% (404,491) |
7:30 a.m. to 7:59 a.m.:
| Zionsville: | 22.2% (2,623) |
| Indiana: | 12.5% (366,781) |
8:00 a.m. to 8:29 a.m.:
| Zionsville: | 15.2% (1,802) |
| Indiana: | 9.6% (282,430) |
8:30 a.m. to 8:59 a.m.:
| Zionsville: | 7.3% (864) |
| Indiana: | 4.5% (131,586) |
9:00 a.m. to 9:59 a.m.:
| Zionsville: | 9.8% (1,163) |
| Indiana: | 5.1% (150,938) |
10:00 a.m. to 10:59 a.m.:
| Zionsville: | 5.0% (590) |
| Indiana: | 2.4% (70,031) |
11:00 a.m. to 11:59 a.m.:
| Zionsville: | 0.7% (86) |
| Indiana: | 1.2% (34,805) |
12:00 p.m. to 3:59 p.m.:
| Zionsville: | 3.2% (376) |
| Indiana: | 7.6% (222,385) |
4:00 p.m. to 11:59 p.m.:
| Zionsville: | 5.5% (647) |
| Indiana: | 8.2% (241,194) |

<5am:
| Zionsville: | 1.1% (43) |
| Indiana: | 4.1% (120,308) |
5:30am:
| Zionsville: | 1.8% (69) |
| Indiana: | 3.8% (109,235) |
6am:
| Zionsville: | 4.1% (156) |
| Indiana: | 5.5% (161,364) |
6:30am:
| Zionsville: | 6.1% (231) |
| Indiana: | 9.0% (261,282) |
7am:
| Zionsville: | 10.9% (415) |
| Indiana: | 11.0% (321,138) |
7:30am:
| Zionsville: | 25.5% (966) |
| Indiana: | 13.7% (398,761) |
8am:
| Zionsville: | 14.2% (539) |
| Indiana: | 15.0% (435,403) |
8:30am:
| Zionsville: | 13.5% (513) |
| Indiana: | 8.0% (232,497) |
9am:
| Zionsville: | 3.3% (124) |
| Indiana: | 3.7% (108,019) |
10am:
| Zionsville: | 6.6% (249) |
| Indiana: | 4.0% (116,293) |
11am:
| Zionsville: | 1.0% (37) |
| Indiana: | 1.8% (53,238) |
12pm:
| Zionsville: | 0.9% (33) |
| Indiana: | 0.9% (26,782) |
4pm:
| Zionsville: | 4.6% (175) |
| Indiana: | 8.3% (241,886) |
>4pm:
| Zionsville: | 0.9% (33) |
| Indiana: | 8.3% (240,423) |

12:00 a.m. to 4:59 a.m. - Males:
| Zionsville: | 4.2% (276) |
| Indiana: | 8.7% (138,377) |
5:00 a.m. to 5:29 a.m. - Males:
| Zionsville: | 1.2% (78) |
| Indiana: | 5.5% (87,613) |
5:30 a.m. to 5:59 a.m. - Males:
| Zionsville: | 1.3% (85) |
| Indiana: | 6.8% (107,671) |
6:00 a.m. to 6:29 a.m. - Males:
| Zionsville: | 7.2% (480) |
| Indiana: | 10.3% (164,136) |
6:30 a.m. to 6:59 a.m. - Males:
| Zionsville: | 5.0% (335) |
| Indiana: | 10.3% (162,781) |
7:00 a.m. to 7:29 a.m. - Males:
| Zionsville: | 21.1% (1,405) |
| Indiana: | 12.1% (192,749) |
7:30 a.m. to 7:59 a.m. - Males:
| Zionsville: | 25.7% (1,712) |
| Indiana: | 11.1% (175,670) |
8:00 a.m. to 8:29 a.m. - Males:
| Zionsville: | 11.4% (758) |
| Indiana: | 8.3% (132,403) |
8:30 a.m. to 8:59 a.m. - Males:
| Zionsville: | 5.4% (357) |
| Indiana: | 3.4% (53,639) |
9:00 a.m. to 9:59 a.m. - Males:
| Zionsville: | 11.3% (749) |
| Indiana: | 4.2% (67,032) |
10:00 a.m. to 10:59 a.m. - Males:
| Zionsville: | 2.2% (144) |
| Indiana: | 2.0% (31,347) |
11:00 a.m. to 11:59 a.m. - Males:
| Zionsville: | 1.3% (89) |
| Indiana: | 1.1% (17,065) |
12:00 p.m. to 3:59 p.m. - Males:
| Zionsville: | 1.8% (122) |
| Indiana: | 7.8% (123,573) |
4:00 p.m. to 11:59 p.m. - Males:
| Zionsville: | 5.2% (349) |
| Indiana: | 8.4% (133,245) |

12:00 a.m. to 4:59 a.m. - Females:
| Zionsville: | 1.3% (68) |
| Indiana: | 4.3% (58,941) |
5:00 a.m. to 5:29 a.m. - Females:
| Zionsville: | 1.5% (75) |
| Indiana: | 2.9% (40,002) |
5:30 a.m. to 5:59 a.m. - Females:
| Zionsville: | 6.7% (344) |
| Indiana: | 4.6% (61,747) |
6:00 a.m. to 6:29 a.m. - Females:
| Zionsville: | 2.5% (130) |
| Indiana: | 6.5% (88,450) |
6:30 a.m. to 6:59 a.m. - Females:
| Zionsville: | 7.5% (386) |
| Indiana: | 9.5% (129,075) |
7:00 a.m. to 7:29 a.m. - Females:
| Zionsville: | 14.4% (739) |
| Indiana: | 15.6% (211,742) |
7:30 a.m. to 7:59 a.m. - Females:
| Zionsville: | 17.6% (907) |
| Indiana: | 14.1% (191,111) |
8:00 a.m. to 8:29 a.m. - Females:
| Zionsville: | 19.7% (1,016) |
| Indiana: | 11.1% (150,027) |
8:30 a.m. to 8:59 a.m. - Females:
| Zionsville: | 3.8% (194) |
| Indiana: | 5.7% (77,947) |
9:00 a.m. to 9:59 a.m. - Females:
| Zionsville: | 9.2% (472) |
| Indiana: | 6.2% (83,906) |
10:00 a.m. to 10:59 a.m. - Females:
| Zionsville: | 8.6% (443) |
| Indiana: | 2.9% (38,684) |
11:00 a.m. to 11:59 a.m. - Females:
| Zionsville: | 0.2% (11) |
| Indiana: | 1.3% (17,740) |
12:00 p.m. to 3:59 p.m. - Females:
| Zionsville: | 5.1% (263) |
| Indiana: | 7.3% (98,812) |
4:00 p.m. to 11:59 p.m. - Females:
| Zionsville: | 5.3% (275) |
| Indiana: | 8.0% (107,949) |
Travel time to work
Percentage of workers working in this county: 43.7%
Number of people working at home: 3,661 (23.9% of all workers)
Daytime population change due to commuting: -507 (-5.8%)
Workers who live and work in this town: 810 (21.3%)
Number of people working at home: 3,661 (23.9% of all workers)
Daytime population change due to commuting: -507 (-5.8%)
Workers who live and work in this town: 810 (21.3%)

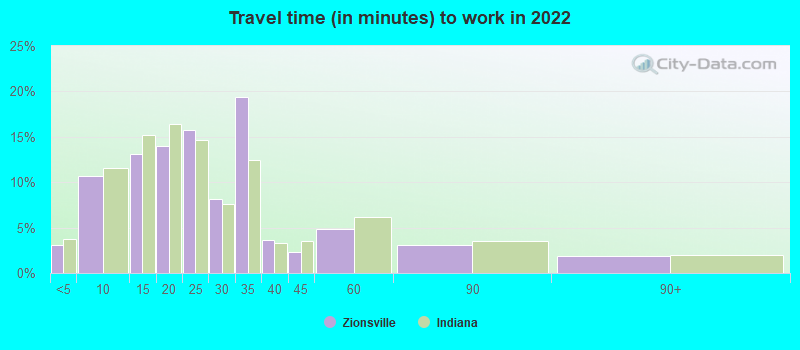

Less than 5 minutes:
| Zionsville: | 3.1% (271) |
| Indiana: | 3.8% (109,783) |
5 to 9 minutes:
| Zionsville: | 10.7% (944) |
| Indiana: | 11.5% (333,493) |
10 to 14 minutes:
| Zionsville: | 13.1% (1,160) |
| Indiana: | 15.2% (438,442) |
15 to 19 minutes:
| Zionsville: | 14.0% (1,236) |
| Indiana: | 16.4% (473,137) |
20 to 24 minutes:
| Zionsville: | 15.7% (1,393) |
| Indiana: | 14.7% (423,546) |
25 to 29 minutes:
| Zionsville: | 8.2% (724) |
| Indiana: | 7.6% (220,017) |
30 to 34 minutes:
| Zionsville: | 19.4% (1,715) |
| Indiana: | 12.4% (359,353) |
35 to 39 minutes:
| Zionsville: | 3.7% (323) |
| Indiana: | 3.4% (97,009) |
40 to 44 minutes:
| Zionsville: | 2.3% (202) |
| Indiana: | 3.5% (100,525) |
45 to 59 minutes:
| Zionsville: | 4.8% (426) |
| Indiana: | 6.1% (177,743) |
60 to 89 minutes:
| Zionsville: | 3.1% (273) |
| Indiana: | 3.5% (101,899) |
90 or more minutes:
| Zionsville: | 1.9% (168) |
| Indiana: | 1.9% (55,813) |


Less than 5 minutes:
| Zionsville: | 6.5% (245) |
| Indiana: | 4.0% (117,198) |
5 to 9 minutes:
| Zionsville: | 10.6% (404) |
| Indiana: | 12.8% (371,942) |
10 to 14 minutes:
| Zionsville: | 8.5% (323) |
| Indiana: | 16.5% (480,825) |
15 to 19 minutes:
| Zionsville: | 9.1% (344) |
| Indiana: | 16.1% (468,193) |
20 to 24 minutes:
| Zionsville: | 19.2% (730) |
| Indiana: | 14.7% (427,185) |
25 to 29 minutes:
| Zionsville: | 6.7% (256) |
| Indiana: | 6.0% (175,645) |
30 to 34 minutes:
| Zionsville: | 21.9% (832) |
| Indiana: | 11.1% (324,328) |
35 to 39 minutes:
| Zionsville: | 4.0% (152) |
| Indiana: | 2.4% (69,517) |
40 to 44 minutes:
| Zionsville: | 2.6% (97) |
| Indiana: | 2.7% (79,764) |
45 to 59 minutes:
| Zionsville: | 4.0% (150) |
| Indiana: | 5.4% (158,340) |
60 to 89 minutes:
| Zionsville: | 0.9% (36) |
| Indiana: | 3.3% (96,185) |
90 or more minutes:
| Zionsville: | 0.4% (14) |
| Indiana: | 2.0% (57,507) |

Less than 5 minutes - Males:
| Zionsville: | 3.9% (178) |
| Indiana: | 3.7% (57,433) |
5 to 9 minutes - Males:
| Zionsville: | 8.3% (376) |
| Indiana: | 10.0% (155,806) |
10 to 14 minutes - Males:
| Zionsville: | 13.4% (605) |
| Indiana: | 14.4% (223,073) |
15 to 19 minutes - Males:
| Zionsville: | 7.5% (341) |
| Indiana: | 15.3% (237,279) |
20 to 24 minutes - Males:
| Zionsville: | 22.6% (1,022) |
| Indiana: | 14.2% (220,011) |
25 to 29 minutes - Males:
| Zionsville: | 8.1% (367) |
| Indiana: | 7.7% (120,041) |
30 to 34 minutes - Males:
| Zionsville: | 18.9% (855) |
| Indiana: | 13.6% (211,029) |
35 to 39 minutes - Males:
| Zionsville: | 3.3% (149) |
| Indiana: | 3.6% (55,260) |
40 to 44 minutes - Males:
| Zionsville: | 3.7% (166) |
| Indiana: | 3.8% (58,795) |
45 to 59 minutes - Males:
| Zionsville: | 8.2% (373) |
| Indiana: | 6.9% (107,692) |
60 to 89 minutes - Males:
| Zionsville: | 4.0% (182) |
| Indiana: | 4.3% (67,025) |
90 or more minutes - Males:
| Zionsville: | 1.6% (74) |
| Indiana: | 2.5% (38,438) |

Less than 5 minutes - Females:
| Zionsville: | 2.1% (93) |
| Indiana: | 3.9% (52,350) |
5 to 9 minutes - Females:
| Zionsville: | 13.0% (567) |
| Indiana: | 13.3% (177,687) |
10 to 14 minutes - Females:
| Zionsville: | 12.5% (546) |
| Indiana: | 16.1% (215,369) |
15 to 19 minutes - Females:
| Zionsville: | 21.4% (933) |
| Indiana: | 17.6% (235,858) |
20 to 24 minutes - Females:
| Zionsville: | 8.7% (380) |
| Indiana: | 15.2% (203,535) |
25 to 29 minutes - Females:
| Zionsville: | 7.6% (334) |
| Indiana: | 7.5% (99,976) |
30 to 34 minutes - Females:
| Zionsville: | 19.0% (829) |
| Indiana: | 11.1% (148,324) |
35 to 39 minutes - Females:
| Zionsville: | 4.1% (178) |
| Indiana: | 3.1% (41,749) |
40 to 44 minutes - Females:
| Zionsville: | 4.4% (194) |
| Indiana: | 3.1% (41,730) |
45 to 59 minutes - Females:
| Zionsville: | 1.5% (67) |
| Indiana: | 5.2% (70,051) |
60 to 89 minutes - Females:
| Zionsville: | 2.2% (95) |
| Indiana: | 2.6% (34,874) |
90 or more minutes - Females:
| Zionsville: | 1.5% (66) |
| Indiana: | 1.3% (17,375) |
Means of transportation to work
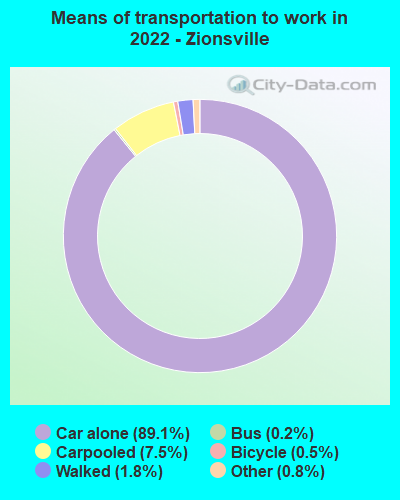
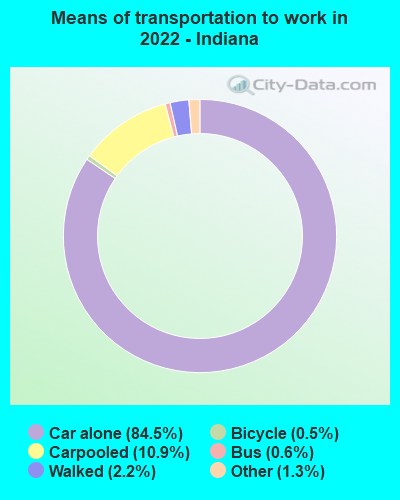
Drove car alone:
| Zionsville: | 89.1% (7,248) |
| Indiana: | 84.5% (1,130,372) |
Carpooled:
| Zionsville: | 7.5% (610) |
| Indiana: | 10.9% (153,860) |
Bus:
| Zionsville: | 0.2% (13) |
| Indiana: | 0.6% (7,885) |
Bicycle:
| Zionsville: | 0.5% (44) |
| Indiana: | 0.5% (2,387) |
Walked:
| Zionsville: | 1.8% (148) |
| Indiana: | 2.2% (30,143) |
Other means:
| Zionsville: | 0.8% (68) |
| Indiana: | 1.3% (13,773) |

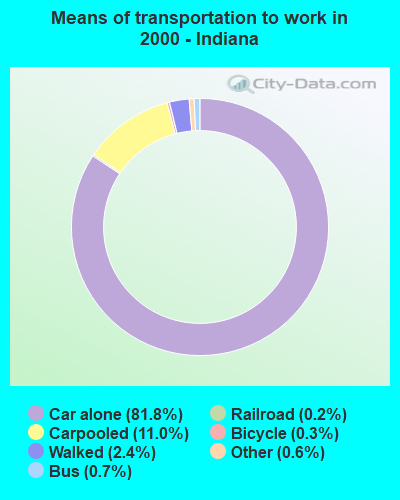
Drove car alone:
| Zionsville: | 88.0% (3,341) |
| Indiana: | 81.8% (2,379,989) |
Carpooled:
| Zionsville: | 3.8% (144) |
| Indiana: | 11.0% (320,910) |
Railroad:
| Zionsville: | 0.2% (6) |
| Indiana: | 0.2% (5,244) |
Bicycle:
| Zionsville: | 0.2% (8) |
| Indiana: | 0.3% (7,725) |
Walked:
| Zionsville: | 1.9% (71) |
| Indiana: | 2.4% (69,184) |
Other means:
| Zionsville: | 0.3% (13) |
| Indiana: | 0.6% (17,054) |

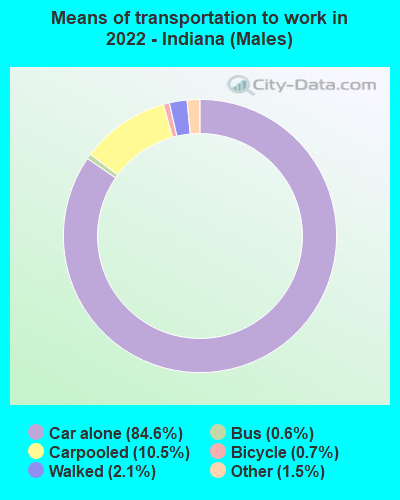
Drove car alone - Males:
| Zionsville: | 90.6% (3,935) |
| Indiana: | 84.6% (1,130,372) |
Carpooled - Males:
| Zionsville: | 4.5% (194) |
| Indiana: | 10.5% (153,860) |
Bus - Males:
| Zionsville: | 0.3% (13) |
| Indiana: | 0.6% (7,885) |
Walked - Males:
| Zionsville: | 3.1% (133) |
| Indiana: | 2.1% (30,143) |
Other means - Males:
| Zionsville: | 1.6% (68) |
| Indiana: | 1.5% (13,773) |


Drove car alone - Females:
| Zionsville: | 87.5% (3,313) |
| Indiana: | 84.4% (1,130,372) |
Carpooled - Females:
| Zionsville: | 11.0% (416) |
| Indiana: | 11.5% (153,860) |
Bicycle - Females:
| Zionsville: | 1.2% (44) |
| Indiana: | 0.2% (2,387) |
Walked - Females:
| Zionsville: | 0.4% (15) |
| Indiana: | 2.3% (30,143) |
Private vehicle occupancy

Drove alone:
| Zionsville: | 93.0% (10,287) |
| Indiana: | 88.7% (2,490,798) |
In 2 person carpool:
| Zionsville: | 4.5% (496) |
| Indiana: | 8.4% (235,949) |
In 3 person carpool:
| Zionsville: | 0.9% (94) |
| Indiana: | 1.7% (47,019) |
In 4 person carpool:
| Zionsville: | 0.4% (50) |
| Indiana: | 0.7% (19,325) |
In 7+ person carpool:
| Zionsville: | 0.7% (74) |
| Indiana: | 0.2% (5,404) |

Drove alone:
| Zionsville: | 95.9% (3,341) |
| Indiana: | 88.1% (2,379,989) |
In 2 person carpool:
| Zionsville: | 4.1% (144) |
| Indiana: | 9.6% (259,143) |
Class of workers
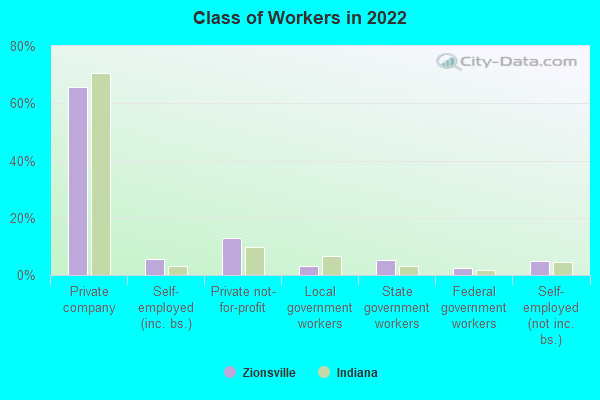
Employee of private company:
| Zionsville: | 65.8% (10,442) |
| Indiana: | 70.4% (2,362,321) |
Self-employed in own incorporated business:
| Zionsville: | 5.6% (892) |
| Indiana: | 3.2% (106,653) |
Private not-for-profit wage and salary workers:
| Zionsville: | 13.0% (2,059) |
| Indiana: | 9.9% (332,080) |
Local government workers:
| Zionsville: | 3.1% (492) |
| Indiana: | 6.6% (222,901) |
State government workers:
| Zionsville: | 5.1% (809) |
| Indiana: | 3.3% (109,298) |
Federal government workers:
| Zionsville: | 2.5% (404) |
| Indiana: | 1.9% (62,110) |
Self-employed workers in own not incorporated business:
| Zionsville: | 4.9% (774) |
| Indiana: | 4.6% (154,959) |

Employee of private company:
| Zionsville: | 67.0% (2,574) |
| Indiana: | 72.4% (2,147,867) |
Self-employed in own incorporated business:
| Zionsville: | 6.3% (243) |
| Indiana: | 2.8% (83,352) |
Private not-for-profit wage and salary workers:
| Zionsville: | 10.7% (411) |
| Indiana: | 8.2% (242,396) |
Local government workers:
| Zionsville: | 6.9% (264) |
| Indiana: | 5.5% (164,030) |
State government workers:
| Zionsville: | 2.0% (77) |
| Indiana: | 3.6% (107,895) |
Federal government workers:
| Zionsville: | 1.1% (41) |
| Indiana: | 1.8% (51,896) |
Self-employed workers in own not incorporated business:
| Zionsville: | 6.0% (230) |
| Indiana: | 5.4% (159,849) |

Employee of private company - Males:
| Zionsville: | 69.4% (6,165) |
| Indiana: | 75.5% (1,341,967) |
Self-employed in own incorporated business - Males:
| Zionsville: | 4.6% (407) |
| Indiana: | 4.0% (71,499) |
Private not-for-profit wage and salary workers - Males:
| Zionsville: | 11.5% (1,025) |
| Indiana: | 6.1% (108,552) |
Local government workers - Males:
| Zionsville: | 1.8% (162) |
| Indiana: | 4.9% (87,149) |
State government workers - Males:
| Zionsville: | 4.9% (431) |
| Indiana: | 2.5% (44,697) |
Federal government workers - Males:
| Zionsville: | 2.1% (183) |
| Indiana: | 1.7% (30,304) |
Self-employed workers in own not incorporated business - Males:
| Zionsville: | 5.7% (507) |
| Indiana: | 5.2% (91,870) |

Employee of private company - Females:
| Zionsville: | 61.2% (4,276) |
| Indiana: | 64.7% (1,020,354) |
Self-employed in own incorporated business - Females:
| Zionsville: | 6.9% (485) |
| Indiana: | 2.2% (35,154) |
Private not-for-profit wage and salary workers - Females:
| Zionsville: | 14.8% (1,034) |
| Indiana: | 14.2% (223,528) |
Local government workers - Females:
| Zionsville: | 4.7% (330) |
| Indiana: | 8.6% (135,752) |
State government workers - Females:
| Zionsville: | 5.4% (378) |
| Indiana: | 4.1% (64,601) |
Federal government workers - Females:
| Zionsville: | 3.2% (221) |
| Indiana: | 2.0% (31,806) |
Self-employed workers in own not incorporated business - Females:
| Zionsville: | 3.8% (267) |
| Indiana: | 4.0% (63,089) |