Estimated zip code population in 2022: 581 Zip code population in 2010: 838 Zip code population in 2000: 710
Houses and condos: 275 Renter-occupied apartments: 26
% of renters here:
10%
State:
38%
March 2022 cost of living index in zip code 01037: 111.4 (more than average, U.S. average is 100)
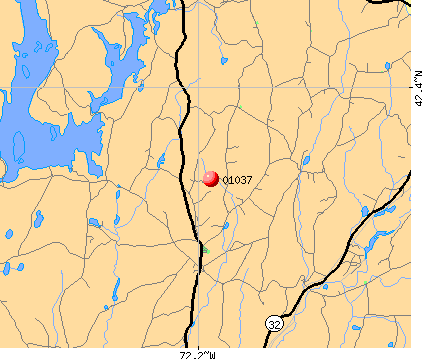
Land area: 14.1 sq. mi. Water area: 1.5 sq. mi.
Population density: 41 people per square mile
(very low).
OSM Map
Google Map
MSN Map
OSM Map
General Map
Google Map
MSN Map
OSM Map
Google Map
MSN Map
OSM Map
Google Map
MSN Map
Please wait while loading the map...
Real estate property taxes paid for housing units in 2022:
This zip code:
1.0% ($4,461)
Massachusetts:
1.0% ($5,536)
Median real estate property taxes paid for housing units with mortgages in 2022: $5,058 (1.1%) Median real estate property taxes paid for housing units with no mortgage in 2022: $4,418 (1.0%)
Business Search- 14 Million verified businesses
Males: 307
(52.8%)
Females: 274
(47.2%)
For population 25 years and over in 01037:
High school or higher: 94.8%
Bachelor's degree or higher: 41.1%
Graduate or professional degree: 13.7%
Mean travel time to work (commute): 33.2 minutes
For population 15 years and over in 01037:
Never married: 16.7%
Now married: 70.9%
Separated: 0.7%
Widowed: 5.2%
Divorced: 6.4%
Zip code 01037 compared to state average:
Unemployed percentage significantly below state average.
Black race population percentage significantly below state average.
Hispanic race population percentage significantly below state average.
Median age significantly above state average.
Foreign-born population percentage significantly below state average.
Renting percentage significantly below state average.
Length of stay since moving in significantly above state average.
Number of college students significantly below state average.
Estimated median house/condo value in 2022: $454,589
01037:
$454,589
Massachusetts:
$534,700
Median resident age:
This zip code:
62.8 years
Massachusetts median age:
40.3 years
Average household size:
This zip code:
2.0 people
Massachusetts:
2.4 people
Averages for the 2004 tax year for zip code 01037, filed in 2005:
Average Adjusted Gross Income (AGI) in 2004: $55,578 (Individual Income Tax Returns)
Here:
$55,578
State:
$62,877
Salary/wage: $46,442 (reported on 85.5% of returns)
Here:
$46,442
State:
$52,969
(% of AGI for various income ranges: 92.6% for AGIs below $10k, 73.8% for AGIs $10k-25k, 80.9% for AGIs $25k-50k, 77.0% for AGIs $50k-75k, 78.1% for AGIs $75k-100k, 59.5% for AGIs over 100k)
Taxable interest for individuals: $893 (reported on 79.1% of returns)
This zip code:
$893
Massachusetts:
$1,945
(% of AGI for various income ranges: 6.9% for AGIs below $10k, 4.1% for AGIs $10k-25k, 1.1% for AGIs $25k-50k, 1.1% for AGIs $50k-75k, 1.3% for AGIs $75k-100k, 0.9% for AGIs over 100k)
Taxable dividends: $1,712 (reported on 34.3% of returns)
Here:
$1,712
State:
$5,323
(% of AGI for various income ranges: 4.8% for AGIs below $10k, 1.5% for AGIs $10k-25k, 0.3% for AGIs $25k-50k, 0.5% for AGIs $50k-75k, 1.2% for AGIs $75k-100k, 1.5% for AGIs over 100k)
Net capital gain/loss: +$10,616 (reported on 28.8% of returns)
Here:
+$10,616
State:
+$20,377
(% of AGI for various income ranges: -12.2% for AGIs below $10k, 0.3% for AGIs $25k-50k, 1.0% for AGIs $50k-75k, 1.4% for AGIs $75k-100k, 13.8% for AGIs over 100k)
Profit/loss from business: +$5,356 (reported on 21.2% of returns)
Here:
+$5,356
State:
+$17,837
(% of AGI for various income ranges: 11.2% for AGIs below $10k, 3.8% for AGIs $10k-25k, 4.5% for AGIs $25k-50k, -0.1% for AGIs $50k-75k, 3.0% for AGIs $75k-100k, 1.2% for AGIs over 100k)
Total itemized deductions: $17,715 (20% of AGI, reported on 43.9% of returns)
Here:
$17,715
State:
$22,573
Here:
20.3% of AGI
State:
19.5% of AGI
(% of AGI for various income ranges: 12.3% for AGIs $25k-50k, 17.3% for AGIs $50k-75k, 15.5% for AGIs $75k-100k, 14.1% for AGIs over 100k)
Charity contributions deductions: $1,706 (2% of AGI, reported on 39.5% of returns)
Here:
$1,706
State:
$3,295
Here:
1.9% of AGI
State:
2.7% of AGI
(% of AGI for various income ranges: 1.2% for AGIs $25k-50k, 1.6% for AGIs $50k-75k, 0.9% for AGIs $75k-100k, 1.4% for AGIs over 100k)
Total tax: $7,738 (reported on 83.1% of returns)
01037:
$7,738
State:
$11,494
(% of AGI for various income ranges: 5.3% for AGIs below $10k, 4.7% for AGIs $10k-25k, 8.3% for AGIs $25k-50k, 7.9% for AGIs $50k-75k, 10.3% for AGIs $75k-100k, 16.8% for AGIs over 100k)
Earned income credit: $1,300 (reported on 5.8% of returns)
Here:
$1,300
State:
$1,518
Percentage of individuals using paid preparers for their 2004 taxes: 62.5%
Here:
62%
State:
58%
(% for various income ranges: 61.0% for AGIs below $10k, 58.0% for AGIs $10k-25k, 56.1% for AGIs $25k-50k, 68.8% for AGIs $50k-75k, 65.2% for AGIs $75k-100k, 69.8% for AGIs over 100k)
Household received Food Stamps/SNAP in the past 12 months: 0 Household did not receive Food Stamps/SNAP in the past 12 months: 254
Women who had a birth in the past 12 months: 5 (6 now married, 0 unmarried) Women who did not have a birth in the past 12 months: 66 (25 now married, 40 unmarried)
Housing units in zip code 01037 with a mortgage: 48 (3 second mortgage, 3 both second mortgage and home equity loan) Median monthly owner costs for units with a mortgage: $3,127 Median monthly owner costs for units without a mortgage: $692
Residents with income below the poverty level in 2022:
This zip code:
1.8%
Whole state:
10.4%
Residents with income below 50% of the poverty level in 2022:
This zip code:
0.2%
Whole state:
5.1%
Median number of rooms in houses and condos:
Here:
6.2
State:
6.5
Median number of rooms in apartments:
Here:
6.0
State:
4.0
Notable locations in this zip code not listed on our city pages
In group quarters: 47 (-1 institutionalized population)
Size of family households: 138 2-persons, 30 3-persons, 7 4-persons, 21 5-persons
Size of nonfamily households: 60 1-person, 4 2-persons
49 married couples with children.
7 single-parent households (7 women).
93.1% of residents of 01037 zip code speak English at home.
4.9% of residents speak Spanish at home (79% very well, 21% well).
0.7% of residents speak other Indo-European language at home (100% very well).
1.6% of residents speak Asian or Pacific Island language at home (100% very well).
Foreign born population: 29 (5.1%) (89.8% of them are naturalized citizens)
This zip code:
5.1%
Whole state:
18.0%
34%Japan
34%Brazil
24%Dominica
14%Hungary
37%American
7%English
6%European
4%Canadian
4%Italian
3%French
3%French Canadian
Year of entry for the foreign-born population
02010 or later
152000 to 2009
81990 to 1999
9Before 1990
Facilities with environmental interests located in this zip code:
MAGNET WAVE PRODUCTS INC (220 MAIN ST in HARDWICK, MA)
AIR MINOR (AIRS/AFS) STATE MASTER (MA-EPICS) - NEI-1180983, AIR PROGRAM, RCRAINFO-MV5084776913, HAZARDOUS WASTE PROGRAM CRITERIA AND HAZARDOUS AIR POLLUTANT INVENTORY (Inventory of air pollution sources) Business SIC classification: COATING, ENGRAVING, AND ALLIED SERVICES Organizations: MAGNET WAVE PRODUCTS INCORPORATED (CONTACT/REGULATORY)
BUTLERS GAS (139 PETERSHAM RD in HARDWICK, MA)
Conditionally Exempt Small Quantity Generators, less than 100 kg/month of hazardous waste (Resource Conservation and Recovery Act (tracking hazardous waste)) - notification Organizations: ARLAND BUTLER (CONTACT/OWNER)
Alternative names: BUTLER AUTO REPAIR
DORMANS GARAGE (6 CHURCH ST in HARDWICK, MA)
Conditionally Exempt Small Quantity Generators, less than 100 kg/month of hazardous waste (Resource Conservation and Recovery Act (tracking hazardous waste)) - notification Organizations: CLYDE DORMAN (CONTACT/OWNER)
EAGLE HILL SCHOOL (242 OLD PETERSHAM RD in HARDWICK, MA)
COMPLIANCE ACTIVITY (Tracking inspections of insecticide, fungicide, and rodenticide, and toxic substances) COMMUNITY WATER SYSTEM (SDWIS)
75.0%Fuel oil, kerosene, etc.
11.8%Bottled, tank, or LP gas
6.7%Wood
5.9%Coal or coke
1.6%Electricity
Place of birth for U.S.-born residents:
This state: 440
Northeast: 58
Midwest: 26
South: 14
West: 2
68% of the 01037 zip code residents lived in the same house 5 years ago. Out of people who lived in different houses, 50% lived in this county. Out of people who lived in different counties, 50% lived in Massachusetts.
94% of the 01037 zip code residents lived in the same house 1 year ago. Out of people who lived in different houses, 54% moved from this county. Out of people who lived in different houses, 27% moved from different county within same state. Out of people who lived in different houses, 15% moved from different state.
Private vs. public school enrollment:
Students in private schools in grades 1 to 8 (elementary and middle school): 16
Here:
35.8%
Massachusetts:
10.3%
Students in private schools in grades 9 to 12 (high school): 37
Here:
100.0%
Massachusetts:
12.3%
Students in private undergraduate colleges: 3
Here:
100.0%
Massachusetts:
51.2%
Occupation by median earnings in the past 12 months ($)
83,170Management occupations
74,774Office and administrative support occupations
70,643Education, training, and library occupations
50,776Personal care and service occupations
Companies with federal contracts located in this zip code:
STOLGITIS, TRAVIS (655 CZESKI RD in HARDWICK, MA; small business) : $32,635 in 20 contractsfrom 2003 to 2004
Contracts for Landscaping/Groundskeeping Services by U.S. Army Corps of Engineers - civil program financing only, Army Signed by year:2000: $0; 2001: $0; 2002: $0; 2003: $44,705; 2004: -$12,070; 2005: $0; 2006: $0.
Biggest contracts:
$9,480 with U.S. Army Corps of Engineers - civil program financing only for Landscaping/Groundskeeping Services. Signed on 2003-05-07. Completion date: 2003-11-30.
$9,170 with Army for Landscaping/Groundskeeping Services. Signed on 2003-12-01. Completion date: 2004-09-30.
$9,170 with U.S. Army Corps of Engineers - civil program financing only for Landscaping/Groundskeeping Services. Signed on 2003-12-01. Completion date: 2004-09-30.
$8,450, same as above.Signed on 2003-05-13. Completion date: 2003-09-30.
Top industries in this zip code by the number of employees in 2005:
Educational Services: Elementary and Secondary Schools (50-99 employees: 1 establishment)
Construction: New Single-Family Housing Construction (except Operative Builders) (10-19: 1, 1-4: 1)
Professional, Scientific, and Technical Services: Research and Development in the Physical, Engineering, and Life Sciences (10-19: 1)
Accommodation and Food Services: Food Service Contractors (5-9: 1)
Construction: Highway, Street, and Bridge Construction (5-9: 1)
People in group quarters in 2010:
155 people in residential schools for people with disabilities
52 people in workers' group living quarters and job corps centers
People in group quarters in 2000:
53 people in other nonhousehold living situations
Home Mortgage Disclosure Act Aggregated Statistics For Year 2009 (Based on 2 partial tracts)
A) FHA, FSA/RHS & VA Home Purchase Loans
B) Conventional Home Purchase Loans
C) Refinancings
D) Home Improvement Loans
F) Non-occupant Loans on < 5 Family Dwellings (A B C & D)
Number
Average Value
Number
Average Value
Number
Average Value
Number
Average Value
Number
Average Value
LOANS ORIGINATED
10
$174,666
13
$243,129
50
$182,238
7
$107,309
4
$166,925
APPLICATIONS APPROVED, NOT ACCEPTED
1
$87,090
0
$0
4
$246,455
1
$94,950
0
$0
APPLICATIONS DENIED
2
$185,370
4
$124,890
17
$231,425
3
$146,967
0
$0
APPLICATIONS WITHDRAWN
0
$0
1
$136,680
6
$217,325
1
$12,100
0
$0
FILES CLOSED FOR INCOMPLETENESS
0
$0
1
$13,310
4
$222,112
1
$125,800
0
$0
Aggregated Statistics For Year 2008 (Based on 2 partial tracts)
A) FHA, FSA/RHS & VA Home Purchase Loans
B) Conventional Home Purchase Loans
C) Refinancings
D) Home Improvement Loans
E) Loans on Dwellings For 5+ Families
F) Non-occupant Loans on < 5 Family Dwellings (A B C & D)
G) Loans On Manufactured Home Dwelling (A B C & D)
Number
Average Value
Number
Average Value
Number
Average Value
Number
Average Value
Number
Average Value
Number
Average Value
Number
Average Value
LOANS ORIGINATED
3
$193,537
13
$169,298
39
$155,139
5
$77,414
1
$101,000
5
$163,900
0
$0
APPLICATIONS APPROVED, NOT ACCEPTED
1
$96,160
1
$125,190
5
$148,780
2
$102,515
0
$0
1
$69,550
0
$0
APPLICATIONS DENIED
2
$140,010
1
$233,450
22
$168,987
4
$54,582
1
$101,000
1
$229,820
1
$21,770
APPLICATIONS WITHDRAWN
1
$86,490
1
$129,430
9
$216,921
1
$84,670
0
$0
0
$0
0
$0
FILES CLOSED FOR INCOMPLETENESS
0
$0
1
$38,100
2
$315,705
0
$0
0
$0
0
$0
0
$0
Aggregated Statistics For Year 2007 (Based on 2 partial tracts)
A) FHA, FSA/RHS & VA Home Purchase Loans
B) Conventional Home Purchase Loans
C) Refinancings
D) Home Improvement Loans
F) Non-occupant Loans on < 5 Family Dwellings (A B C & D)
G) Loans On Manufactured Home Dwelling (A B C & D)
Number
Average Value
Number
Average Value
Number
Average Value
Number
Average Value
Number
Average Value
Number
Average Value
LOANS ORIGINATED
1
$118,540
31
$188,346
51
$166,261
16
$71,064
5
$148,660
1
$16,330
APPLICATIONS APPROVED, NOT ACCEPTED
0
$0
4
$143,338
9
$223,507
2
$129,425
0
$0
0
$0
APPLICATIONS DENIED
1
$97,980
7
$214,877
36
$179,978
3
$94,953
1
$224,990
0
$0
APPLICATIONS WITHDRAWN
0
$0
2
$239,805
19
$186,565
1
$262,480
0
$0
0
$0
FILES CLOSED FOR INCOMPLETENESS
0
$0
1
$123,980
7
$166,666
0
$0
0
$0
0
$0
Aggregated Statistics For Year 2006 (Based on 2 partial tracts)
A) FHA, FSA/RHS & VA Home Purchase Loans
B) Conventional Home Purchase Loans
C) Refinancings
D) Home Improvement Loans
E) Loans on Dwellings For 5+ Families
F) Non-occupant Loans on < 5 Family Dwellings (A B C & D)
G) Loans On Manufactured Home Dwelling (A B C & D)
Number
Average Value
Number
Average Value
Number
Average Value
Number
Average Value
Number
Average Value
Number
Average Value
Number
Average Value
LOANS ORIGINATED
1
$350,780
31
$170,164
57
$167,593
26
$68,505
1
$512,270
4
$102,512
1
$90,720
APPLICATIONS APPROVED, NOT ACCEPTED
0
$0
2
$263,390
10
$147,148
4
$43,242
0
$0
0
$0
0
$0
APPLICATIONS DENIED
1
$131,240
8
$204,271
42
$235,656
7
$124,589
0
$0
2
$105,840
0
$0
APPLICATIONS WITHDRAWN
0
$0
4
$183,255
34
$212,747
4
$63,505
1
$96,770
1
$65,320
0
$0
FILES CLOSED FOR INCOMPLETENESS
0
$0
2
$115,215
8
$201,852
0
$0
1
$87,090
0
$0
0
$0
Aggregated Statistics For Year 2005 (Based on 2 partial tracts)
A) FHA, FSA/RHS & VA Home Purchase Loans
B) Conventional Home Purchase Loans
C) Refinancings
D) Home Improvement Loans
E) Loans on Dwellings For 5+ Families
F) Non-occupant Loans on < 5 Family Dwellings (A B C & D)
G) Loans On Manufactured Home Dwelling (A B C & D)
Number
Average Value
Number
Average Value
Number
Average Value
Number
Average Value
Number
Average Value
Number
Average Value
Number
Average Value
LOANS ORIGINATED
1
$301,190
37
$168,821
60
$151,986
18
$67,906
0
$0
6
$151,805
2
$126,405
APPLICATIONS APPROVED, NOT ACCEPTED
0
$0
7
$133,920
7
$181,871
1
$12,100
1
$396,750
2
$185,370
1
$60,480
APPLICATIONS DENIED
0
$0
5
$137,532
22
$174,072
5
$39,192
0
$0
2
$48,385
1
$12,100
APPLICATIONS WITHDRAWN
0
$0
5
$179,746
25
$177,980
4
$76,810
0
$0
2
$178,415
0
$0
FILES CLOSED FOR INCOMPLETENESS
0
$0
4
$197,920
15
$172,973
1
$105,840
0
$0
0
$0
0
$0
Aggregated Statistics For Year 2004 (Based on 2 partial tracts)
A) FHA, FSA/RHS & VA Home Purchase Loans
B) Conventional Home Purchase Loans
C) Refinancings
D) Home Improvement Loans
E) Loans on Dwellings For 5+ Families
F) Non-occupant Loans on < 5 Family Dwellings (A B C & D)
G) Loans On Manufactured Home Dwelling (A B C & D)
Detailed PMIC statistics for the following Tracts:7231.00
2002 - 2018 National Fire Incident Reporting System (NFIRS) incidents
According to the data from the years 2002 - 2018 the average number of fire incidents per year is 11. The highest number of reported fire incidents - 24 took place in 2016, and the least - 0 in 2014. The data has a declining trend.
When looking into fire subcategories, the most incidents belonged to: Outside Fires (43.7%), and Structure Fires (41.5%).
Fire incident types reported to NFIRS in Zip Code 01037


 Nearest zip codes: 01031, 01094, 01531, 01005, 01366, 01074.


 According to the data from the years 2002 - 2018 the average number of fire incidents per year is 11. The highest number of reported fire incidents - 24 took place in 2016, and the least - 0 in 2014. The data has a declining trend.
 When looking into fire subcategories, the most incidents belonged to: Outside Fires (43.7%), and Structure Fires (41.5%).