Estimated zip code population in 2022: 8,212 Zip code population in 2010: 8,534 Zip code population in 2000: 8,257
Houses and condos: 3,762 Renter-occupied apartments: 585
% of renters here:
17%
State:
38%
March 2022 cost of living index in zip code 01057: 109.2 (more than average, U.S. average is 100)
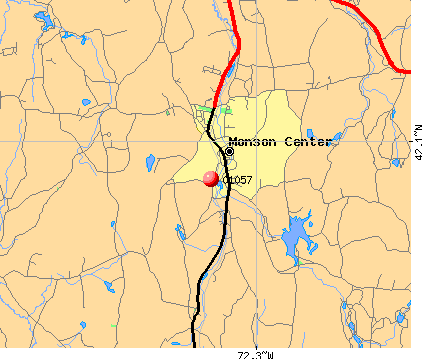
Land area: 44.9 sq. mi. Water area: 0.6 sq. mi.
Population density: 183 people per square mile
(very low).
OSM Map
Google Map
MSN Map
OSM Map
General Map
Google Map
MSN Map
OSM Map
Google Map
MSN Map
OSM Map
Google Map
MSN Map
Please wait while loading the map...
Real estate property taxes paid for housing units in 2022:
This zip code:
1.4% ($4,517)
Massachusetts:
1.0% ($5,536)
Median real estate property taxes paid for housing units with mortgages in 2022: $4,595 (1.3%) Median real estate property taxes paid for housing units with no mortgage in 2022: $4,452 (1.6%)
Estimated median house/condo value in 2022: $327,406
01057:
$327,406
Massachusetts:
$534,700
According to our research of Massachusetts and other state lists, there were 4 registered sex offenders living in 01057 zip code as of May 28, 2024. The ratio of all residents to sex offenders in zip code 01057 is 2,225 to 1. The ratio of registered sex offenders to all residents in this zip code is lower than the state average.
Median resident age:
This zip code:
50.2 years
Massachusetts median age:
40.3 years
Average household size:
This zip code:
2.3 people
Massachusetts:
2.4 people
Averages for the 2020 tax year for zip code 01057, filed in 2021:
Average Adjusted Gross Income (AGI) in 2020: $72,354 (Individual Income Tax Returns)
Here:
$72,354
State:
$105,130
Salary/wage: $62,358 (reported on 80.2% of returns)
Here:
$62,358
State:
$82,951
(% of AGI for various income ranges: 1136.4% for AGIs below $25k, 3486.9% for AGIs $25k-50k, 6348.4% for AGIs $50k-75k, 9611.2% for AGIs $75k-100k, 17753.7% for AGIs $100k-200k, 56955.0% for AGIs over 200k)
Taxable interest for individuals: $876 (reported on 45.1% of returns)
This zip code:
$876
Massachusetts:
$2,361
(% of AGI for various income ranges: 26.7% for AGIs below $25k, 21.3% for AGIs $25k-50k, 34.9% for AGIs $50k-75k, 64.1% for AGIs $75k-100k, 106.7% for AGIs $100k-200k, 775.0% for AGIs over 200k)
Ordinary dividends: $3,786 (reported on 20.5% of returns)
Here:
$3,786
State:
$10,365
(% of AGI for various income ranges: 33.6% for AGIs below $25k, 45.4% for AGIs $25k-50k, 43.1% for AGIs $50k-75k, 109.4% for AGIs $75k-100k, 228.0% for AGIs $100k-200k, 1873.3% for AGIs over 200k)
Net capital gain/loss in AGI: +$7,751 (reported on 16.2% of returns)
Here:
+$7,751
State:
+$48,178
(% of AGI for various income ranges: 4.0% for AGIs below $25k, 31.4% for AGIs $25k-50k, 45.1% for AGIs $50k-75k, 102.9% for AGIs $75k-100k, 439.0% for AGIs $100k-200k, 4198.3% for AGIs over 200k)
Profit/loss from business: +$13,905 (reported on 14.6% of returns)
Here:
+$13,905
State:
+$20,792
(% of AGI for various income ranges: 92.5% for AGIs below $25k, 150.6% for AGIs $25k-50k, 216.5% for AGIs $50k-75k, 433.5% for AGIs $75k-100k, 526.3% for AGIs $100k-200k, 3298.3% for AGIs over 200k)
Taxable individual retirement arrangement distribution: $16,960 (reported on 12.1% of returns)
01057:
$16,960
Massachusetts:
$22,790
(% of AGI for various income ranges: 94.0% for AGIs below $25k, 140.0% for AGIs $25k-50k, 222.9% for AGIs $50k-75k, 413.5% for AGIs $75k-100k, 593.1% for AGIs $100k-200k, 3068.3% for AGIs over 200k)
Total itemized deductions: $22,479 (reported on 7.7% of returns)
Here:
$22,479
State:
$36,722
(% of AGI for various income ranges: 40.1% for AGIs below $25k, 110.3% for AGIs $25k-50k, 306.5% for AGIs $50k-75k, 430.0% for AGIs $75k-100k, 493.9% for AGIs $100k-200k, 1856.7% for AGIs over 200k)
Charity contributions: $2,886 (reported on 5.0% of returns)
Here:
$2,886
State:
$12,529
(% of AGI for various income ranges: 8.4% for AGIs below $25k, 10.2% for AGIs $50k-75k, 29.1% for AGIs $75k-100k, 60.4% for AGIs $100k-200k, 208.3% for AGIs over 200k)
Taxes paid: $7,868 (reported on 7.7% of returns)
01057:
$7,868
State:
$8,782
(% of AGI for various income ranges: 10.8% for AGIs below $25k, 35.5% for AGIs $25k-50k, 106.7% for AGIs $50k-75k, 184.7% for AGIs $75k-100k, 179.0% for AGIs $100k-200k, 488.3% for AGIs over 200k)
Earned income credit: $1,753 (reported on 7.7% of returns)
Here:
$1,753
State:
$1,909
(% of AGI for various income ranges: 47.6% for AGIs below $25k, 33.7% for AGIs $25k-50k)
Percentage of individuals using paid preparers for their 2020 taxes: 93.4%
Here:
93%
State:
92%
(% for various income ranges: 92.0% for AGIs below $25k, 93.8% for AGIs $25k-50k, 93.2% for AGIs $50k-75k, 92.5% for AGIs $75k-100k, 95.3% for AGIs $100k-200k, 94.4% for AGIs over 200k)
Averages for the 2012 tax year for zip code 01057, filed in 2013:
Average Adjusted Gross Income (AGI) in 2012: $58,385 (Individual Income Tax Returns)
Here:
$58,385
State:
$81,425
Salary/wage: $52,277 (reported on 83.8% of returns)
Here:
$52,277
State:
$64,752
(% of AGI for various income ranges: 71.0% for AGIs below $25k, 72.0% for AGIs $25k-50k, 75.4% for AGIs $50k-75k, 78.6% for AGIs $75k-100k, 81.3% for AGIs $100k-200k, 56.7% for AGIs over 200k)
Taxable interest for individuals: $745 (reported on 50.6% of returns)
This zip code:
$745
Massachusetts:
$2,136
(% of AGI for various income ranges: 1.6% for AGIs below $25k, 0.9% for AGIs $25k-50k, 0.5% for AGIs $50k-75k, 0.9% for AGIs $75k-100k, 0.4% for AGIs $100k-200k, 0.3% for AGIs over 200k)
Ordinary dividends: $2,543 (reported on 21.3% of returns)
Here:
$2,543
State:
$9,473
(% of AGI for various income ranges: 1.5% for AGIs below $25k, 0.9% for AGIs $25k-50k, 0.8% for AGIs $50k-75k, 0.7% for AGIs $75k-100k, 0.9% for AGIs $100k-200k, 1.4% for AGIs over 200k)
Net capital gain/loss in AGI: +$3,761 (reported on 15.0% of returns)
Here:
+$3,761
State:
+$31,437
(% of AGI for various income ranges: 0.5% for AGIs $25k-50k, 0.2% for AGIs $75k-100k, 1.0% for AGIs $100k-200k, 4.6% for AGIs over 200k)
Profit/loss from business: +$15,021 (reported on 15.3% of returns)
Here:
+$15,021
State:
+$20,662
(% of AGI for various income ranges: 5.9% for AGIs below $25k, 4.8% for AGIs $25k-50k, 5.2% for AGIs $50k-75k, 2.7% for AGIs $75k-100k, 4.6% for AGIs $100k-200k)
Taxable individual retirement arrangement distribution: $11,760 (reported on 10.9% of returns)
01057:
$11,760
Massachusetts:
$18,892
(% of AGI for various income ranges: 4.2% for AGIs below $25k, 2.8% for AGIs $25k-50k, 2.1% for AGIs $50k-75k, 2.4% for AGIs $75k-100k, 2.2% for AGIs $100k-200k)
Self-employment retirement plans: $14,633 (reported on 0.7% of returns)
01057:
$14,633
Massachusetts:
$20,669
Total itemized deductions: $19,070 (20% of AGI, reported on 39.7% of returns)
Here:
$19,070
State:
$28,907
Here:
19.8% of AGI
State:
18.2% of AGI
(% of AGI for various income ranges: 10.6% for AGIs below $25k, 10.9% for AGIs $25k-50k, 13.1% for AGIs $50k-75k, 14.2% for AGIs $75k-100k, 14.5% for AGIs $100k-200k, 10.2% for AGIs over 200k)
Charity contributions: $1,720 (reported on 29.8% of returns)
Here:
$1,720
State:
$4,208
(% of AGI for various income ranges: 0.6% for AGIs below $25k, 0.6% for AGIs $25k-50k, 1.0% for AGIs $50k-75k, 0.9% for AGIs $75k-100k, 1.1% for AGIs $100k-200k, 0.7% for AGIs over 200k)
Taxes paid: $8,612 (reported on 39.7% of returns)
01057:
$8,612
State:
$13,303
(% of AGI for various income ranges: 2.7% for AGIs below $25k, 3.9% for AGIs $25k-50k, 5.3% for AGIs $50k-75k, 6.0% for AGIs $75k-100k, 7.3% for AGIs $100k-200k, 6.5% for AGIs over 200k)
Earned income credit: $1,756 (reported on 10.4% of returns)
Here:
$1,756
State:
$1,971
(% of AGI for various income ranges: 3.8% for AGIs below $25k, 0.5% for AGIs $25k-50k)
Percentage of individuals using paid preparers for their 2012 taxes: 61.0%
Here:
61%
State:
56%
(% for various income ranges: 52.2% for AGIs below $25k, 62.4% for AGIs $25k-50k, 67.7% for AGIs $50k-75k, 63.5% for AGIs $75k-100k, 65.6% for AGIs $100k-200k, 87.5% for AGIs over 200k)
Averages for the 2004 tax year for zip code 01057, filed in 2005:
Average Adjusted Gross Income (AGI) in 2004: $48,605 (Individual Income Tax Returns)
Here:
$48,605
State:
$62,877
Salary/wage: $44,670 (reported on 87.3% of returns)
Here:
$44,670
State:
$52,969
(% of AGI for various income ranges: 94.3% for AGIs below $10k, 71.9% for AGIs $10k-25k, 80.3% for AGIs $25k-50k, 83.2% for AGIs $50k-75k, 86.7% for AGIs $75k-100k, 74.4% for AGIs over 100k)
Taxable interest for individuals: $837 (reported on 60.4% of returns)
This zip code:
$837
Massachusetts:
$1,945
(% of AGI for various income ranges: 3.6% for AGIs below $10k, 2.6% for AGIs $10k-25k, 1.2% for AGIs $25k-50k, 0.6% for AGIs $50k-75k, 0.5% for AGIs $75k-100k, 1.2% for AGIs over 100k)
Taxable dividends: $1,235 (reported on 23.9% of returns)
Here:
$1,235
State:
$5,323
(% of AGI for various income ranges: 3.4% for AGIs below $10k, 0.9% for AGIs $10k-25k, 0.5% for AGIs $25k-50k, 0.6% for AGIs $50k-75k, 0.3% for AGIs $75k-100k, 0.7% for AGIs over 100k)
Net capital gain/loss: +$3,977 (reported on 16.6% of returns)
Here:
+$3,977
State:
+$20,377
(% of AGI for various income ranges: 2.0% for AGIs below $10k, -0.1% for AGIs $10k-25k, 0.4% for AGIs $25k-50k, 0.6% for AGIs $50k-75k, 1.5% for AGIs $75k-100k, 2.8% for AGIs over 100k)
Profit/loss from business: +$15,867 (reported on 16.7% of returns)
Here:
+$15,867
State:
+$17,837
(% of AGI for various income ranges: 1.5% for AGIs below $10k, 8.1% for AGIs $10k-25k, 5.2% for AGIs $25k-50k, 5.0% for AGIs $50k-75k, 4.3% for AGIs $75k-100k, 6.3% for AGIs over 100k)
IRA payment deduction: $3,128 (reported on 2.7% of returns)
01057:
$3,128
Massachusetts:
$3,100
(% of AGI for various income ranges: 0.4% for AGIs $10k-25k, 0.2% for AGIs $25k-50k, 0.3% for AGIs $50k-75k, 0.1% for AGIs $75k-100k, 0.1% for AGIs over 100k)
Self-employed pension: $11,079 (reported on 1.6% of returns)
Here:
$11,079
Massachusetts:
$14,516
(% of AGI for various income ranges: 0.4% for AGIs $50k-75k, 0.3% for AGIs $75k-100k, 0.7% for AGIs over 100k)
Total itemized deductions: $15,719 (20% of AGI, reported on 43.6% of returns)
Here:
$15,719
State:
$22,573
Here:
20.3% of AGI
State:
19.5% of AGI
(% of AGI for various income ranges: 9.0% for AGIs below $10k, 9.3% for AGIs $10k-25k, 13.5% for AGIs $25k-50k, 15.7% for AGIs $50k-75k, 15.9% for AGIs $75k-100k, 13.3% for AGIs over 100k)
Charity contributions deductions: $1,371 (2% of AGI, reported on 39.0% of returns)
Here:
$1,371
State:
$3,295
Here:
1.7% of AGI
State:
2.7% of AGI
(% of AGI for various income ranges: 0.3% for AGIs below $10k, 0.4% for AGIs $10k-25k, 0.9% for AGIs $25k-50k, 1.2% for AGIs $50k-75k, 1.3% for AGIs $75k-100k, 1.2% for AGIs over 100k)
Total tax: $6,543 (reported on 82.2% of returns)
01057:
$6,543
State:
$11,494
(% of AGI for various income ranges: 3.1% for AGIs below $10k, 5.1% for AGIs $10k-25k, 7.9% for AGIs $25k-50k, 8.8% for AGIs $50k-75k, 10.4% for AGIs $75k-100k, 17.3% for AGIs over 100k)
Earned income credit: $1,460 (reported on 8.0% of returns)
Here:
$1,460
State:
$1,518
Percentage of individuals using paid preparers for their 2004 taxes: 62.2%
Here:
62%
State:
58%
(% for various income ranges: 52.1% for AGIs below $10k, 58.6% for AGIs $10k-25k, 62.8% for AGIs $25k-50k, 68.3% for AGIs $50k-75k, 66.5% for AGIs $75k-100k, 69.1% for AGIs over 100k)
Likely homosexual households (counted as self-reported same-sex unmarried-partner households)
Lesbian couples: 0.2% of all households
Gay men: 0.3% of all households
Household received Food Stamps/SNAP in the past 12 months: 430 Household did not receive Food Stamps/SNAP in the past 12 months: 3,093
Women who had a birth in the past 12 months: 65 (32 now married, 29 unmarried) Women who did not have a birth in the past 12 months: 1,498 (669 now married, 821 unmarried)
Housing units in zip code 01057 with a mortgage: 1,860 (279 second mortgage, 254 both second mortgage and home equity loan) Houses without a mortgage: 155
Median monthly owner costs for units with a mortgage: $1,829 Median monthly owner costs for units without a mortgage: $775
Residents with income below the poverty level in 2022:
This zip code:
10.9%
Whole state:
10.4%
Residents with income below 50% of the poverty level in 2022:
This zip code:
5.9%
Whole state:
5.1%
Median number of rooms in houses and condos:
Here:
6.4
State:
6.5
Median number of rooms in apartments:
Here:
3.2
State:
4.0
Notable locations in this zip code not listed on our city pages
Notable locations in zip code 01057: Quaboag Valley Golf Course (A), Echo Hill Orchards (B), Monson Fire Department (C), Memorial Town Hall (D), Monson Free Library and Reading Room (E), Monson Town Hall (F). Display/hide their locations on the map
Churches in zip code 01057 include: Unitarian Universalist Church (A), Lily of the Valley Christian Center (B), First Church of Monson (C). Display/hide their locations on the map
Cemeteries: Moulton Hill Cemetery (1), Bethany Cemetery (2), Hillside Elementary School (3), Grouts Cemetery (4), Main Street Cemetery (5), North Main Street Cemetery (6), Butler Cemetery (7). Display/hide their locations on the map
Lakes, reservoirs, and swamps: Smith Pond (A), Duck Pond (B), Bradley Pond (C), Pulpit Rock Pond (D), Squire Pond (E), Chicopee Brook Reservoir (F), Paradise Lake (G), Norcross Pond Number Two (H). Display/hide their locations on the map
Streams, rivers, and creeks: Thayer Brook (A), Chicopee Brook (B), Conant Brook (C), Pinnacle Creek (D), Vinica Brook (E). Display/hide their locations on the map
880 married couples with children.
345 single-parent households (113 men, 232 women).
96.8% of residents of 01057 zip code speak English at home.
0.8% of residents speak Spanish at home (81% very well, 19% well).
1.4% of residents speak other Indo-European language at home (75% very well, 25% well).
0.6% of residents speak Asian or Pacific Island language at home (33% very well, 40% well, 27% not well).
0.1% of residents speak other language at home (100% very well).
Foreign born population: 204 (2.5%) (75.2% of them are naturalized citizens)
This zip code:
2.5%
Whole state:
18.0%
21%Thailand
11%Sweden
9%North Macedonia (Macedonia)
4%England
4%Greece
4%United Kingdom, excluding England and Scotland
4%Georgia
19%American
16%French Canadian
11%Polish
10%Irish
10%English
7%French
5%Italian
Year of entry for the foreign-born population
242010 or later
572000 to 2009
141990 to 1999
175Before 1990
Major facilities with environmental interests located in this zip code:
OMEGA PROCESSING (21 BLISS STREET in MONSON, MA)
SUPERFUND (Superfund database) (Integrated Compliance Information System) - ICIS-01-1984-0007, FORMAL ENFORCEMENT ACTION STATE MASTER (MA-EPICS) - RCRAINFO-MAD991288945, HAZARDOUS WASTE PROGRAM (Resource Conservation and Recovery Act (tracking hazardous waste)) TARGETED BROWNFIELDS ASSESSMENT (TBA) Organizations: OMEGA PROCESSING INC (CONTACT/OPERATOR)
, FRANKLIN LARY DONALD LAPOINT (CONTACT/OWNER)
MONSON HIGH SCHOOL (55 MARGARET STREET in MONSON, MA)
(Geographic Names Information System) (National Center for Education Statistics) - STATE ID-191505
LAMINATING COATING TECHNOLOGIES INC (152 BETHANY ROAD in MONSON, MA)
AIR SYNTHETIC MINOR (AIRS/AFS) CRITERIA AND HAZARDOUS AIR POLLUTANT INVENTORY (Inventory of air pollution sources) (Resource Conservation and Recovery Act (tracking hazardous waste)) TRI REPORTER (Tracking of toxic chemicals releasing facilities) Business SIC classification: COATED FABRICS, NOT RUBBERIZED Business NAICS classification: FABRIC COATING MILLS.; ALL OTHER MISCELLANEOUS TEXTILE PRODUCT MILLS. Organizations: RICHARD J ANDERSON JR (CONTACT/OWNER)
MONSON SMALL ANIMAL CLINIC (125 PALMER ROAD in MONSON, MA)
AIR MINOR (AIRS/AFS) CRITERIA AND HAZARDOUS AIR POLLUTANT INVENTORY (Inventory of air pollution sources) (Resource Conservation and Recovery Act (tracking hazardous waste)) Business SIC classification: VETERINARY SERVICES FOR ANIMAL SPECIALTIES; REFUSE SYSTEMS Business NAICS classification: SOLID WASTE LANDFILL. Alternative names: MONSON VETERINARY HOSPITAL INC
DOUBLE-A-PLASTICS CO., INC. (TOBEY ROAD in MONSON, MA)
ENFORCEMENT/COMPLIANCE ACTIVITY (Integrated Compliance Information System) National Pollutant Discharge Elimination System NON-MAJOR (Tracking pollutant discharge elimination systems) - permit National Pollutant Discharge Elimination System NON-MAJOR (Tracking pollutant discharge elimination systems) - permit
APW/WRIGHT LINE (288 MAIN ST in MONSON, MA)
AIR SYNTHETIC MINOR (AIRS/AFS) CRITERIA AND HAZARDOUS AIR POLLUTANT INVENTORY (Inventory of air pollution sources) Small Quantity Generators, between 100 kg and 1000 kg of hazardous waste/month (Resource Conservation and Recovery Act (tracking hazardous waste)) TRI REPORTER (Tracking of toxic chemicals releasing facilities) Business SIC classification: FABRICATED METAL PRODUCTS Organizations: APW WRIGHTLINE (CONTACT/OWNER)
Alternative names: APW WRIGHTLINE, ZERO CORP ZERO EAST DIV
ACE MOLDING COMPANY (91 BETHANY ROAD in MONSON, MA)
ENFORCEMENT/COMPLIANCE ACTIVITY (Integrated Compliance Information System) National Pollutant Discharge Elimination System NON-MAJOR (Tracking pollutant discharge elimination systems) - permit
BOARDS KNOT THE (PECK BROS RD in MONSON, MA)
(Resource Conservation and Recovery Act (tracking hazardous waste)) Organizations: GEORGE MONTE (CONTACT/OWNER)
MONSON JR AND SR HIGH SCHOOL (THOMPSON STREET in MONSON, MA)
AIR MINOR (AIRS/AFS) CRITERIA AND HAZARDOUS AIR POLLUTANT INVENTORY (Inventory of air pollution sources) Business SIC classification: ELEMENTARY AND SECONDARY SCHOOLS Alternative names: MONSON JR/SR HIGH SC, MONSON SCHOOL SYSTEM
MONSON SAND & GRAVEL CORP (STAFFORD RD in MONSON, MA)
(Resource Conservation and Recovery Act (tracking hazardous waste))
NEW ENGLAND TELE (MAIN ST in MONSON, MA)
(Resource Conservation and Recovery Act (tracking hazardous waste))
PALMER FORD INC (BOSTON RD RTE 20 in MONSON, MA)
(Resource Conservation and Recovery Act (tracking hazardous waste))
DOUBLE A PLASTICS CO INC (85 BETHANY ROAD in MONSON, MA)
National Pollutant Discharge Elimination System NON-MAJOR (Tracking pollutant discharge elimination systems) - permit Business SIC classification: PLASTICS PRODUCTS
Housing units lacking complete plumbing facilities: 2.1% Housing units lacking complete kitchen facilities: 1.9%
54.5%Fuel oil, kerosene, etc.
13.7%Electricity
9.7%Bottled, tank, or LP gas
8.2%Utility gas
6.9%Wood
3.3%Other fuel
1.8%Solar energy
1.4%No fuel used
0.6%Coal or coke
Population in 1990: 8,194. Population change in the 1990s: +63 (+0.8%).
Place of birth for U.S.-born residents:
This state: 6,334
Northeast: 1,028
Midwest: 149
South: 272
West: 88
68% of the 01057 zip code residents lived in the same house 5 years ago. Out of people who lived in different houses, 76% lived in this county. Out of people who lived in different counties, 50% lived in Massachusetts.
96% of the 01057 zip code residents lived in the same house 1 year ago. Out of people who lived in different houses, 76% moved from this county. Out of people who lived in different houses, 14% moved from different county within same state. Out of people who lived in different houses, 8% moved from different state.
Private vs. public school enrollment:
Students in private schools in grades 1 to 8 (elementary and middle school): 83
Here:
13.5%
Massachusetts:
10.3%
Students in private schools in grades 9 to 12 (high school): 38
Here:
10.2%
Massachusetts:
12.3%
Students in private undergraduate colleges: 108
Here:
42.4%
Massachusetts:
51.2%
Occupation by median earnings in the past 12 months ($)
110,471Life, physical, and social science occupations
93,887Law enforcement workers including supervisors
90,131Business and financial operations occupations
78,408Health diagnosing and treating practitioners and other technical occupations
77,625Management occupations
73,442Education, training, and library occupations
Companies with federal contracts located in this zip code (MONSON, MA):
DIVERSIFIED METALS, INC (49 MAIN STREET; small business) : $1,591,939 in 108 contractsfrom 2001 to 2006
Contracts for Bars and Rods, Nonferrous Base Metal, Bars and Rods, Plate, Sheet, Strip, Foil; and Leaf, Guns, 75 mm through 125 mm, and moreby Defense Logistics Agency, Navy, Army Signed by year:2000: $0; 2001: $454,194; 2002: $134,602; 2003: $182,552; 2004: $155,188; 2005: $532,462; 2006: $132,941.
Biggest contracts:
$411,594 with Defense Logistics Agency for Bars and Rods, Nonferrous Base Metal. Signed on 2001-06-06. Completion date: 2002-06-05.
$152,772 with Navy for Bars and Rods, Nonferrous Base Metal. Signed on 2003-08-12. Completion date: 2004-02-03.
$71,610 with Navy for Bars and Rods. Signed on 2002-12-06. Completion date: 2003-03-07.
$42,600 with Navy for Bars and Rods, Nonferrous Base Metal. Signed on 2001-02-02. Completion date: 2001-06-30.
ZERO CORPORATION (288 MAIN ST) : $83,071 in 2 contractsin 2000
$49,422 with Air Force for Office Furniture. Signed on 2000-09-07. Completion date: 2000-09-19.
$33,649 with Air Force for Office Furniture. Taking place in NC. Signed on 2000-09-29. Completion date: 2000-10-30.
SOHRE TURBOMACHINERY INC (128 MAIN ST; small business) : $39,569 in 2 contractsfrom 2001 to 2006
$33,111 with Defense Logistics Agency for Electrical Contact Brushes and Electrodes. Signed on 2001-01-10. Completion date: 2001-03-11.
$6,458 with Navy for Electrical Contact Brushes and Electrodes. Signed on 2006-04-12. Completion date: 2006-04-17.
DANIEL OCONNOR & SONS INC (45 BETHANY ROAD; small business)
$19,500 with U.S. Army Corps of Engineers - civil program financing only for Maintenance, Repair or Alteration of Real Property -- Dams. Taking place in NH. Signed on 2003-02-21. Completion date: 2003-06-30.
DIGBY'S BITPILE INC (139 STAFFORD RD; small business)
$4,498 with Air Force for Miscellaneous Electrical and Electronic Components. Signed on 2005-08-19. Completion date: 2005-09-09.
Top industries in this zip code by the number of employees in 2005:
Finance and Insurance: Savings Institutions (50-99 employees: 1 establishment)
Construction: Other Building Equipment Contractors (50-99: 1)
Accommodation and Food Services: Snack and Nonalcoholic Beverage Bars (20-49: 1, 1-4: 1)
Utilities: Electric Power Distribution (20-49: 1)
Wholesale Trade: Metal Service Centers and Other Metal Merchant Wholesalers (20-49: 1)
Health Care and Social Assistance: Offices of Physicians (except Mental Health Specialists) (20-49: 1)
People in group quarters in 2010:
17 people in nursing facilities/skilled-nursing facilities
2 people in other noninstitutional facilities
People in group quarters in 2000:
222 people in schools, hospitals, or wards for the intellectually disabled
2 people in religious group quarters
Home Mortgage Disclosure Act Aggregated Statistics For Year 2009 (Based on 2 full tracts)
A) FHA, FSA/RHS & VA Home Purchase Loans
B) Conventional Home Purchase Loans
C) Refinancings
D) Home Improvement Loans
E) Loans on Dwellings For 5+ Families
F) Non-occupant Loans on < 5 Family Dwellings (A B C & D)
G) Loans On Manufactured Home Dwelling (A B C & D)
Number
Average Value
Number
Average Value
Number
Average Value
Number
Average Value
Number
Average Value
Number
Average Value
Number
Average Value
LOANS ORIGINATED
57
$190,245
82
$171,519
492
$168,054
53
$105,738
2
$166,845
21
$116,406
2
$34,320
APPLICATIONS APPROVED, NOT ACCEPTED
4
$108,688
4
$118,222
19
$172,816
4
$20,975
0
$0
4
$118,222
0
$0
APPLICATIONS DENIED
4
$163,508
19
$141,304
93
$199,783
13
$51,044
0
$0
2
$178,285
2
$49,575
APPLICATIONS WITHDRAWN
11
$206,801
13
$125,408
69
$206,874
11
$168,492
0
$0
2
$122,990
0
$0
FILES CLOSED FOR INCOMPLETENESS
0
$0
2
$185,915
31
$177,209
2
$240,255
0
$0
0
$0
0
$0
Aggregated Statistics For Year 2008 (Based on 2 full tracts)
A) FHA, FSA/RHS & VA Home Purchase Loans
B) Conventional Home Purchase Loans
C) Refinancings
D) Home Improvement Loans
F) Non-occupant Loans on < 5 Family Dwellings (A B C & D)
G) Loans On Manufactured Home Dwelling (A B C & D)
Number
Average Value
Number
Average Value
Number
Average Value
Number
Average Value
Number
Average Value
Number
Average Value
LOANS ORIGINATED
53
$194,638
103
$175,185
252
$168,366
86
$68,711
40
$172,232
10
$32,225
APPLICATIONS APPROVED, NOT ACCEPTED
2
$223,095
6
$126,485
23
$196,235
6
$10,805
0
$0
0
$0
APPLICATIONS DENIED
10
$114,408
19
$207,641
132
$225,031
27
$45,904
4
$266,952
8
$55,059
APPLICATIONS WITHDRAWN
2
$127,755
15
$180,637
76
$196,952
11
$132,436
2
$394,710
0
$0
FILES CLOSED FOR INCOMPLETENESS
0
$0
2
$130,615
13
$169,558
0
$0
2
$130,615
2
$62,925
Aggregated Statistics For Year 2007 (Based on 2 full tracts)
A) FHA, FSA/RHS & VA Home Purchase Loans
B) Conventional Home Purchase Loans
C) Refinancings
D) Home Improvement Loans
F) Non-occupant Loans on < 5 Family Dwellings (A B C & D)
G) Loans On Manufactured Home Dwelling (A B C & D)
Number
Average Value
Number
Average Value
Number
Average Value
Number
Average Value
Number
Average Value
Number
Average Value
LOANS ORIGINATED
11
$242,337
210
$190,589
280
$161,451
135
$61,074
25
$117,383
10
$51,484
APPLICATIONS APPROVED, NOT ACCEPTED
2
$180,195
36
$184,059
44
$151,634
15
$50,848
0
$0
2
$20,975
APPLICATIONS DENIED
4
$172,088
25
$204,866
212
$189,169
46
$52,064
8
$220,235
0
$0
APPLICATIONS WITHDRAWN
4
$170,182
15
$233,519
97
$196,440
10
$45,382
2
$66,740
0
$0
FILES CLOSED FOR INCOMPLETENESS
0
$0
2
$238,350
48
$201,366
2
$47,670
0
$0
0
$0
Aggregated Statistics For Year 2006 (Based on 2 full tracts)
A) FHA, FSA/RHS & VA Home Purchase Loans
B) Conventional Home Purchase Loans
C) Refinancings
D) Home Improvement Loans
E) Loans on Dwellings For 5+ Families
F) Non-occupant Loans on < 5 Family Dwellings (A B C & D)
G) Loans On Manufactured Home Dwelling (A B C & D)
Number
Average Value
Number
Average Value
Number
Average Value
Number
Average Value
Number
Average Value
Number
Average Value
Number
Average Value
LOANS ORIGINATED
8
$172,328
223
$175,699
376
$152,123
128
$53,227
2
$133,475
27
$196,047
8
$29,079
APPLICATIONS APPROVED, NOT ACCEPTED
0
$0
40
$158,836
50
$163,603
8
$25,026
0
$0
13
$115,875
0
$0
APPLICATIONS DENIED
0
$0
53
$137,182
185
$166,139
48
$103,960
2
$133,475
8
$127,040
4
$99,152
APPLICATIONS WITHDRAWN
0
$0
21
$164,076
172
$153,852
25
$103,348
0
$0
4
$171,612
0
$0
FILES CLOSED FOR INCOMPLETENESS
0
$0
2
$324,155
44
$192,240
8
$109,879
0
$0
2
$38,135
2
$38,135
Aggregated Statistics For Year 2005 (Based on 2 full tracts)
A) FHA, FSA/RHS & VA Home Purchase Loans
B) Conventional Home Purchase Loans
C) Refinancings
D) Home Improvement Loans
E) Loans on Dwellings For 5+ Families
F) Non-occupant Loans on < 5 Family Dwellings (A B C & D)
G) Loans On Manufactured Home Dwelling (A B C & D)
Number
Average Value
Number
Average Value
Number
Average Value
Number
Average Value
Number
Average Value
Number
Average Value
Number
Average Value
LOANS ORIGINATED
2
$111,550
284
$172,713
446
$152,565
128
$84,108
4
$169,705
38
$132,673
4
$144,918
APPLICATIONS APPROVED, NOT ACCEPTED
0
$0
25
$124,247
59
$164,211
10
$50,340
2
$283,160
4
$97,248
2
$45,765
APPLICATIONS DENIED
0
$0
36
$120,605
246
$162,163
51
$81,207
0
$0
8
$121,081
4
$57,680
APPLICATIONS WITHDRAWN
0
$0
29
$167,141
246
$164,287
17
$236,443
0
$0
15
$140,341
0
$0
FILES CLOSED FOR INCOMPLETENESS
0
$0
11
$176,813
51
$212,589
0
$0
0
$0
2
$142,055
0
$0
Aggregated Statistics For Year 2004 (Based on 2 full tracts)
A) FHA, FSA/RHS & VA Home Purchase Loans
B) Conventional Home Purchase Loans
C) Refinancings
D) Home Improvement Loans
E) Loans on Dwellings For 5+ Families
F) Non-occupant Loans on < 5 Family Dwellings (A B C & D)
G) Loans On Manufactured Home Dwelling (A B C & D)
Number
Average Value
Number
Average Value
Number
Average Value
Number
Average Value
Number
Average Value
Number
Average Value
Number
Average Value
LOANS ORIGINATED
8
$157,072
248
$164,254
501
$137,625
132
$57,883
2
$343,225
27
$111,018
2
$133,475
APPLICATIONS APPROVED, NOT ACCEPTED
0
$0
23
$151,052
59
$143,818
17
$40,828
0
$0
11
$99,327
8
$68,168
APPLICATIONS DENIED
2
$102,015
36
$177,068
154
$146,229
59
$45,117
0
$0
10
$66,929
4
$56,250
APPLICATIONS WITHDRAWN
0
$0
17
$148,169
187
$142,877
17
$81,095
0
$0
4
$45,762
2
$10,485
FILES CLOSED FOR INCOMPLETENESS
0
$0
2
$97,245
118
$155,388
8
$43,141
0
$0
0
$0
0
$0
Aggregated Statistics For Year 2003 (Based on 2 full tracts)
A) FHA, FSA/RHS & VA Home Purchase Loans
B) Conventional Home Purchase Loans
C) Refinancings
D) Home Improvement Loans
F) Non-occupant Loans on < 5 Family Dwellings (A B C & D)
Number
Average Value
Number
Average Value
Number
Average Value
Number
Average Value
Number
Average Value
LOANS ORIGINATED
19
$141,204
246
$155,389
1,108
$122,777
27
$32,416
25
$105,789
APPLICATIONS APPROVED, NOT ACCEPTED
2
$155,405
23
$133,310
113
$125,933
6
$20,340
4
$184,960
APPLICATIONS DENIED
4
$91,528
32
$147,539
261
$126,879
25
$47,518
11
$141,450
APPLICATIONS WITHDRAWN
6
$196,400
17
$174,865
166
$137,646
6
$24,470
2
$152,545
FILES CLOSED FOR INCOMPLETENESS
0
$0
4
$119,652
19
$144,214
2
$243,115
0
$0
Aggregated Statistics For Year 2002 (Based on 2 full tracts)
A) FHA, FSA/RHS & VA Home Purchase Loans
B) Conventional Home Purchase Loans
C) Refinancings
D) Home Improvement Loans
E) Loans on Dwellings For 5+ Families
F) Non-occupant Loans on < 5 Family Dwellings (A B C & D)
Number
Average Value
Number
Average Value
Number
Average Value
Number
Average Value
Number
Average Value
Number
Average Value
LOANS ORIGINATED
32
$125,134
191
$141,043
625
$113,096
40
$42,045
4
$103,445
25
$89,925
APPLICATIONS APPROVED, NOT ACCEPTED
0
$0
11
$122,555
69
$102,746
11
$31,029
0
$0
2
$116,315
APPLICATIONS DENIED
2
$93,435
44
$130,529
116
$109,312
15
$41,314
0
$0
4
$93,910
APPLICATIONS WITHDRAWN
4
$91,050
21
$159,536
76
$126,049
8
$21,451
0
$0
6
$84,535
FILES CLOSED FOR INCOMPLETENESS
0
$0
8
$127,040
15
$105,383
2
$14,300
0
$0
0
$0
Aggregated Statistics For Year 2001 (Based on 2 full tracts)
A) FHA, FSA/RHS & VA Home Purchase Loans
B) Conventional Home Purchase Loans
C) Refinancings
D) Home Improvement Loans
F) Non-occupant Loans on < 5 Family Dwellings (A B C & D)
Number
Average Value
Number
Average Value
Number
Average Value
Number
Average Value
Number
Average Value
LOANS ORIGINATED
38
$134,781
204
$121,474
503
$108,453
40
$10,535
13
$88,153
APPLICATIONS APPROVED, NOT ACCEPTED
2
$89,620
13
$104,141
51
$91,452
8
$21,214
4
$60,540
APPLICATIONS DENIED
8
$90,811
27
$74,860
113
$93,568
27
$18,997
4
$60,065
APPLICATIONS WITHDRAWN
6
$114,408
21
$103,058
74
$115,928
11
$55,297
2
$60,065
FILES CLOSED FOR INCOMPLETENESS
0
$0
6
$174,790
13
$126,435
2
$40,045
2
$143,010
Aggregated Statistics For Year 2000 (Based on 2 full tracts)
A) FHA, FSA/RHS & VA Home Purchase Loans
B) Conventional Home Purchase Loans
C) Refinancings
D) Home Improvement Loans
E) Loans on Dwellings For 5+ Families
F) Non-occupant Loans on < 5 Family Dwellings (A B C & D)
Number
Average Value
Number
Average Value
Number
Average Value
Number
Average Value
Number
Average Value
Number
Average Value
LOANS ORIGINATED
36
$119,917
172
$120,284
97
$87,418
40
$15,350
2
$305,090
8
$81,516
APPLICATIONS APPROVED, NOT ACCEPTED
2
$122,990
10
$122,035
13
$57,938
11
$34,843
0
$0
0
$0
APPLICATIONS DENIED
4
$127,280
25
$90,764
82
$88,620
31
$20,483
0
$0
2
$9,535
APPLICATIONS WITHDRAWN
4
$96,770
11
$91,353
32
$97,008
4
$11,918
0
$0
0
$0
FILES CLOSED FOR INCOMPLETENESS
0
$0
4
$112,025
11
$60,845
0
$0
0
$0
0
$0
Aggregated Statistics For Year 1999 (Based on 1 full tract)
A) FHA, FSA/RHS & VA Home Purchase Loans
B) Conventional Home Purchase Loans
C) Refinancings
D) Home Improvement Loans
F) Non-occupant Loans on < 5 Family Dwellings (A B C & D)
Detailed PMIC statistics for the following Tracts:8137.00
2002 - 2018 National Fire Incident Reporting System (NFIRS) incidents
According to the data from the years 2002 - 2018 the average number of fire incidents per year is 39. The highest number of reported fire incidents - 70 took place in 2011, and the least - 4 in 2014. The data has a rising trend.
When looking into fire subcategories, the most incidents belonged to: Outside Fires (45.1%), and Structure Fires (39.5%).
Fire incident types reported to NFIRS in Zip Code 01057


 Nearest zip codes: 01081, 01069, 01080, 01036, 01079, 01095.


 According to the data from the years 2002 - 2018 the average number of fire incidents per year is 39. The highest number of reported fire incidents - 70 took place in 2011, and the least - 4 in 2014. The data has a rising trend.
 When looking into fire subcategories, the most incidents belonged to: Outside Fires (45.1%), and Structure Fires (39.5%).