Estimated zip code population in 2022: 6,183 Zip code population in 2010: 5,792 Zip code population in 2000: 5,387
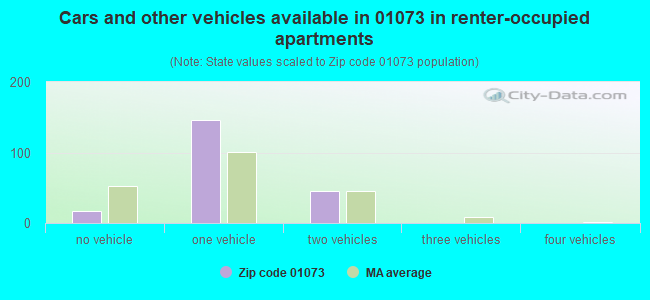
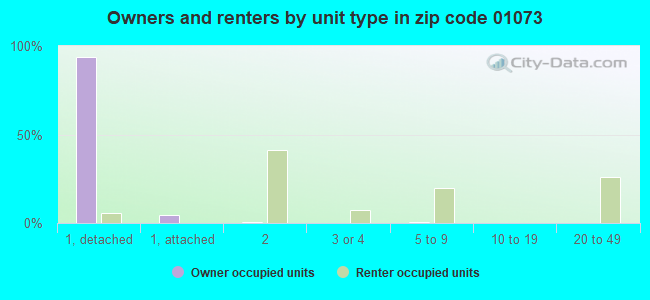
Houses and condos: 2,618 Renter-occupied apartments: 207
% of renters here:
8%
State:
38%
March 2022 cost of living index in zip code 01073: 86.2 (less than average, U.S. average is 100)
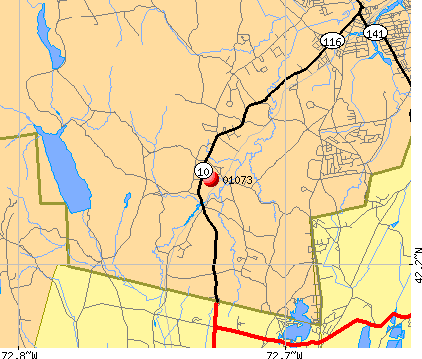
Land area: 28.2 sq. mi. Water area: 0.8 sq. mi.
Population density: 220 people per square mile
(very low).
OSM Map
Google Map
MSN Map
OSM Map
General Map
Google Map
MSN Map
OSM Map
Google Map
MSN Map
OSM Map
Google Map
MSN Map
Please wait while loading the map...
Real estate property taxes paid for housing units in 2022:
This zip code:
1.2% ($4,893)
Massachusetts:
1.0% ($5,536)
Median real estate property taxes paid for housing units with mortgages in 2022: $5,336 (1.2%) Median real estate property taxes paid for housing units with no mortgage in 2022: $4,440 (1.2%)
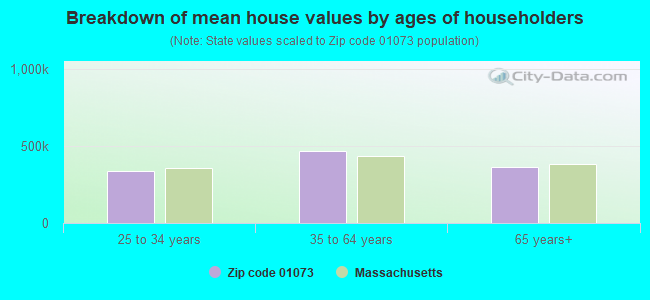
Estimated median house/condo value in 2022: $412,489
01073:
$412,489
Massachusetts:
$534,700
According to our research of Massachusetts and other state lists, there were 3 registered sex offenders living in 01073 zip code as of June 09, 2024. The ratio of all residents to sex offenders in zip code 01073 is 2,056 to 1. The ratio of registered sex offenders to all residents in this zip code is lower than the state average.
Median resident age:
This zip code:
48.4 years
Massachusetts median age:
40.3 years
Average household size:
This zip code:
2.4 people
Massachusetts:
2.4 people
Averages for the 2020 tax year for zip code 01073, filed in 2021:
Average Adjusted Gross Income (AGI) in 2020: $96,121 (Individual Income Tax Returns)
Here:
$96,121
State:
$105,130
Salary/wage: $75,488 (reported on 77.9% of returns)
Here:
$75,488
State:
$82,951
(% of AGI for various income ranges: 1188.7% for AGIs below $25k, 3490.5% for AGIs $25k-50k, 6327.4% for AGIs $50k-75k, 9105.6% for AGIs $75k-100k, 20438.0% for AGIs $100k-200k, 59146.7% for AGIs over 200k)
Taxable interest for individuals: $1,510 (reported on 47.5% of returns)
This zip code:
$1,510
Massachusetts:
$2,361
(% of AGI for various income ranges: 37.3% for AGIs below $25k, 41.2% for AGIs $25k-50k, 71.9% for AGIs $50k-75k, 106.4% for AGIs $75k-100k, 178.2% for AGIs $100k-200k, 957.8% for AGIs over 200k)
Ordinary dividends: $3,869 (reported on 28.1% of returns)
Here:
$3,869
State:
$10,365
(% of AGI for various income ranges: 35.8% for AGIs below $25k, 60.5% for AGIs $25k-50k, 134.2% for AGIs $50k-75k, 208.0% for AGIs $75k-100k, 322.8% for AGIs $100k-200k, 1112.2% for AGIs over 200k)
Net capital gain/loss in AGI: +$18,068 (reported on 24.2% of returns)
Here:
+$18,068
State:
+$48,178
(% of AGI for various income ranges: 10.7% for AGIs below $25k, 45.1% for AGIs $25k-50k, 179.7% for AGIs $50k-75k, 216.8% for AGIs $75k-100k, 572.5% for AGIs $100k-200k, 12236.7% for AGIs over 200k)
Profit/loss from business: +$20,400 (reported on 15.2% of returns)
Here:
+$20,400
State:
+$20,792
(% of AGI for various income ranges: 49.1% for AGIs below $25k, 163.4% for AGIs $25k-50k, 414.5% for AGIs $50k-75k, 381.2% for AGIs $75k-100k, 791.8% for AGIs $100k-200k, 4564.4% for AGIs over 200k)
Taxable individual retirement arrangement distribution: $18,548 (reported on 13.7% of returns)
01073:
$18,548
Massachusetts:
$22,790
(% of AGI for various income ranges: 111.1% for AGIs below $25k, 187.6% for AGIs $25k-50k, 373.9% for AGIs $50k-75k, 713.6% for AGIs $75k-100k, 711.0% for AGIs $100k-200k, 1640.0% for AGIs over 200k)
Self-employed (Keogh) retirement plans: $19,733 (reported on 0.9% of returns)
01073:
$19,733
Massachusetts:
$26,868
(% of AGI for various income ranges: 148.0% for AGIs $100k-200k)
Total itemized deductions: $27,212 (reported on 9.9% of returns)
Here:
$27,212
State:
$36,722
(% of AGI for various income ranges: 268.2% for AGIs below $25k, 384.2% for AGIs $50k-75k, 518.8% for AGIs $75k-100k, 771.0% for AGIs $100k-200k, 2445.6% for AGIs over 200k)
Charity contributions: $4,258 (reported on 7.2% of returns)
Here:
$4,258
State:
$12,529
(% of AGI for various income ranges: 3.8% for AGIs below $25k, 18.7% for AGIs $50k-75k, 33.6% for AGIs $75k-100k, 105.5% for AGIs $100k-200k, 490.0% for AGIs over 200k)
Taxes paid: $8,962 (reported on 9.6% of returns)
01073:
$8,962
State:
$8,782
(% of AGI for various income ranges: 49.6% for AGIs below $25k, 138.1% for AGIs $50k-75k, 191.2% for AGIs $75k-100k, 279.0% for AGIs $100k-200k, 692.2% for AGIs over 200k)
Earned income credit: $1,429 (reported on 5.1% of returns)
Here:
$1,429
State:
$1,909
(% of AGI for various income ranges: 26.4% for AGIs below $25k, 30.2% for AGIs $25k-50k)
Percentage of individuals using paid preparers for their 2020 taxes: 91.9%
Here:
92%
State:
92%
(% for various income ranges: 91.0% for AGIs below $25k, 91.7% for AGIs $25k-50k, 89.8% for AGIs $50k-75k, 92.7% for AGIs $75k-100k, 93.8% for AGIs $100k-200k, 92.6% for AGIs over 200k)
Averages for the 2012 tax year for zip code 01073, filed in 2013:
Average Adjusted Gross Income (AGI) in 2012: $72,242 (Individual Income Tax Returns)
Here:
$72,242
State:
$81,425
Salary/wage: $62,859 (reported on 84.4% of returns)
Here:
$62,859
State:
$64,752
(% of AGI for various income ranges: 69.0% for AGIs below $25k, 72.5% for AGIs $25k-50k, 73.5% for AGIs $50k-75k, 74.2% for AGIs $75k-100k, 82.5% for AGIs $100k-200k, 59.5% for AGIs over 200k)
Taxable interest for individuals: $953 (reported on 54.9% of returns)
This zip code:
$953
Massachusetts:
$2,136
(% of AGI for various income ranges: 2.0% for AGIs below $25k, 0.7% for AGIs $25k-50k, 0.9% for AGIs $50k-75k, 0.8% for AGIs $75k-100k, 0.4% for AGIs $100k-200k, 0.7% for AGIs over 200k)
Ordinary dividends: $4,299 (reported on 29.2% of returns)
Here:
$4,299
State:
$9,473
(% of AGI for various income ranges: 1.8% for AGIs below $25k, 1.2% for AGIs $25k-50k, 1.4% for AGIs $50k-75k, 0.9% for AGIs $75k-100k, 1.2% for AGIs $100k-200k, 3.8% for AGIs over 200k)
Net capital gain/loss in AGI: +$6,468 (reported on 17.8% of returns)
Here:
+$6,468
State:
+$31,437
(% of AGI for various income ranges: 0.6% for AGIs $50k-75k, 0.1% for AGIs $75k-100k, 0.9% for AGIs $100k-200k, 5.5% for AGIs over 200k)
Profit/loss from business: +$19,530 (reported on 14.9% of returns)
Here:
+$19,530
State:
+$20,662
(% of AGI for various income ranges: 5.9% for AGIs below $25k, 5.3% for AGIs $25k-50k, 3.6% for AGIs $50k-75k, 4.9% for AGIs $75k-100k, 4.1% for AGIs $100k-200k, 2.5% for AGIs over 200k)
Taxable individual retirement arrangement distribution: $9,441 (reported on 12.4% of returns)
01073:
$9,441
Massachusetts:
$18,892
(% of AGI for various income ranges: 4.0% for AGIs below $25k, 3.3% for AGIs $25k-50k, 2.2% for AGIs $50k-75k, 2.1% for AGIs $75k-100k, 1.4% for AGIs $100k-200k)
Self-employment retirement plans: $17,375 (reported on 1.3% of returns)
01073:
$17,375
Massachusetts:
$20,669
Total itemized deductions: $21,427 (18% of AGI, reported on 45.1% of returns)
Here:
$21,427
State:
$28,907
Here:
18.4% of AGI
State:
18.2% of AGI
(% of AGI for various income ranges: 11.4% for AGIs below $25k, 12.7% for AGIs $25k-50k, 12.9% for AGIs $50k-75k, 13.9% for AGIs $75k-100k, 14.6% for AGIs $100k-200k, 11.9% for AGIs over 200k)
Charity contributions: $1,723 (reported on 36.2% of returns)
Here:
$1,723
State:
$4,208
(% of AGI for various income ranges: 0.4% for AGIs below $25k, 0.9% for AGIs $25k-50k, 0.6% for AGIs $50k-75k, 0.9% for AGIs $75k-100k, 0.9% for AGIs $100k-200k, 1.0% for AGIs over 200k)
Taxes paid: $10,735 (reported on 44.8% of returns)
01073:
$10,735
State:
$13,303
(% of AGI for various income ranges: 3.4% for AGIs below $25k, 4.6% for AGIs $25k-50k, 5.5% for AGIs $50k-75k, 6.3% for AGIs $75k-100k, 7.6% for AGIs $100k-200k, 7.6% for AGIs over 200k)
Earned income credit: $1,545 (reported on 7.0% of returns)
Here:
$1,545
State:
$1,971
(% of AGI for various income ranges: 2.1% for AGIs below $25k, 0.5% for AGIs $25k-50k)
Percentage of individuals using paid preparers for their 2012 taxes: 59.4%
Here:
59%
State:
56%
(% for various income ranges: 50.5% for AGIs below $25k, 56.9% for AGIs $25k-50k, 63.8% for AGIs $50k-75k, 64.3% for AGIs $75k-100k, 65.0% for AGIs $100k-200k, 76.9% for AGIs over 200k)
Averages for the 2004 tax year for zip code 01073, filed in 2005:
Average Adjusted Gross Income (AGI) in 2004: $55,189 (Individual Income Tax Returns)
Here:
$55,189
State:
$62,877
Salary/wage: $49,287 (reported on 87.3% of returns)
Here:
$49,287
State:
$52,969
(% of AGI for various income ranges: 128.2% for AGIs below $10k, 72.5% for AGIs $10k-25k, 79.6% for AGIs $25k-50k, 83.6% for AGIs $50k-75k, 83.9% for AGIs $75k-100k, 71.0% for AGIs over 100k)
Taxable interest for individuals: $1,179 (reported on 62.1% of returns)
This zip code:
$1,179
Massachusetts:
$1,945
(% of AGI for various income ranges: 9.7% for AGIs below $10k, 3.1% for AGIs $10k-25k, 1.9% for AGIs $25k-50k, 1.1% for AGIs $50k-75k, 0.7% for AGIs $75k-100k, 1.1% for AGIs over 100k)
Taxable dividends: $2,023 (reported on 31.1% of returns)
Here:
$2,023
State:
$5,323
(% of AGI for various income ranges: 7.7% for AGIs below $10k, 1.4% for AGIs $10k-25k, 1.0% for AGIs $25k-50k, 0.6% for AGIs $50k-75k, 0.6% for AGIs $75k-100k, 1.5% for AGIs over 100k)
Net capital gain/loss: +$7,927 (reported on 22.9% of returns)
Here:
+$7,927
State:
+$20,377
(% of AGI for various income ranges: -5.4% for AGIs below $10k, 0.2% for AGIs $10k-25k, 0.3% for AGIs $25k-50k, 0.2% for AGIs $50k-75k, 1.4% for AGIs $75k-100k, 7.4% for AGIs over 100k)
Profit/loss from business: +$16,856 (reported on 16.9% of returns)
Here:
+$16,856
State:
+$17,837
(% of AGI for various income ranges: 13.6% for AGIs below $10k, 5.4% for AGIs $10k-25k, 4.7% for AGIs $25k-50k, 3.7% for AGIs $50k-75k, 3.8% for AGIs $75k-100k, 6.5% for AGIs over 100k)
IRA payment deduction: $2,884 (reported on 4.3% of returns)
01073:
$2,884
Massachusetts:
$3,100
(% of AGI for various income ranges: 0.4% for AGIs $10k-25k, 0.5% for AGIs $25k-50k, 0.2% for AGIs $50k-75k, 0.2% for AGIs $75k-100k, 0.1% for AGIs over 100k)
Self-employed pension: $14,000 (reported on 1.5% of returns)
Here:
$14,000
Massachusetts:
$14,516
Total itemized deductions: $17,029 (19% of AGI, reported on 46.6% of returns)
Here:
$17,029
State:
$22,573
Here:
19.4% of AGI
State:
19.5% of AGI
(% of AGI for various income ranges: 18.6% for AGIs below $10k, 10.7% for AGIs $10k-25k, 12.6% for AGIs $25k-50k, 15.6% for AGIs $50k-75k, 16.6% for AGIs $75k-100k, 13.7% for AGIs over 100k)
Charity contributions deductions: $1,871 (2% of AGI, reported on 41.7% of returns)
Here:
$1,871
State:
$3,295
Here:
2.0% of AGI
State:
2.7% of AGI
(% of AGI for various income ranges: 0.5% for AGIs below $10k, 1.0% for AGIs $10k-25k, 0.9% for AGIs $25k-50k, 1.2% for AGIs $50k-75k, 1.4% for AGIs $75k-100k, 1.8% for AGIs over 100k)
Total tax: $7,994 (reported on 83.9% of returns)
01073:
$7,994
State:
$11,494
(% of AGI for various income ranges: 4.7% for AGIs below $10k, 5.5% for AGIs $10k-25k, 8.2% for AGIs $25k-50k, 8.9% for AGIs $50k-75k, 10.2% for AGIs $75k-100k, 17.3% for AGIs over 100k)
Earned income credit: $1,214 (reported on 6.1% of returns)
Here:
$1,214
State:
$1,518
Percentage of individuals using paid preparers for their 2004 taxes: 59.8%
Here:
60%
State:
58%
(% for various income ranges: 53.5% for AGIs below $10k, 53.6% for AGIs $10k-25k, 57.5% for AGIs $25k-50k, 63.0% for AGIs $50k-75k, 66.7% for AGIs $75k-100k, 69.0% for AGIs over 100k)
Likely homosexual households (counted as self-reported same-sex unmarried-partner households)
Lesbian couples: 0.5% of all households
Gay men: 0.0% of all households
Household received Food Stamps/SNAP in the past 12 months: 230 Household did not receive Food Stamps/SNAP in the past 12 months: 2,287
Women who had a birth in the past 12 months: 74 (78 now married, 0 unmarried) Women who did not have a birth in the past 12 months: 877 (537 now married, 326 unmarried)
Housing units in zip code 01073 with a mortgage: 1,407 (211 second mortgage, 46 home equity loan, 138 both second mortgage and home equity loan) Houses without a mortgage: 179
Median monthly owner costs for units with a mortgage: $2,077 Median monthly owner costs for units without a mortgage: $755
Residents with income below the poverty level in 2022:
This zip code:
1.8%
Whole state:
10.4%
Residents with income below 50% of the poverty level in 2022:
This zip code:
1.6%
Whole state:
5.1%
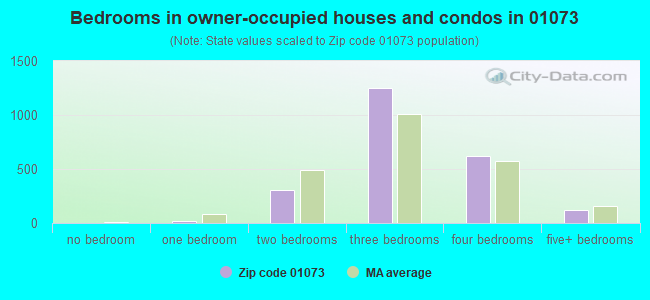
Median number of rooms in houses and condos:
Here:
6.5
State:
6.5
Median number of rooms in apartments:
Here:
3.8
State:
4.0
Notable locations in this zip code not listed on our city pages
Notable locations in zip code 01073: Bashista Orchards (A), Southampton Country Club (B), Southampton Town Hall (C), Southampton Fire Department Station 2 (D), Southampton Fire Department Station 1 Headquarters (E). Display/hide their locations on the map
Reservoirs and swamps: Alder Pond (A), Lyman Pond (B), Lost Pond (C), New Intake Reservoir (D), Tighe Carmody Reservoir (E), White Reservoir (F), Pomeroys Meadow (G), Hackmatack Swamp (H). Display/hide their locations on the map
Streams, rivers, and creeks: Moose Brook (A), Tucker Brook (B), Sacket Brook (C), Breakneck Brook (D), Blue Meadow Brook (E), Tripple Brook (F), Potash Brook (G), North Branch Manhan River (H). Display/hide their locations on the map
Parks in zip code 01073 include: Conant Memorial Park (1), Southampton Center Historic District (2), Pulaski Park (3). Display/hide their locations on the map
In group quarters: 4 (-1 institutionalized population)
Size of family households: 998 2-persons, 498 3-persons, 315 4-persons, 124 5-persons, 36 6-persons, 42 7-or-more-persons
Size of nonfamily households: 426 1-person, 95 2-persons
969 married couples with children.
58 single-parent households (46 men, 12 women).
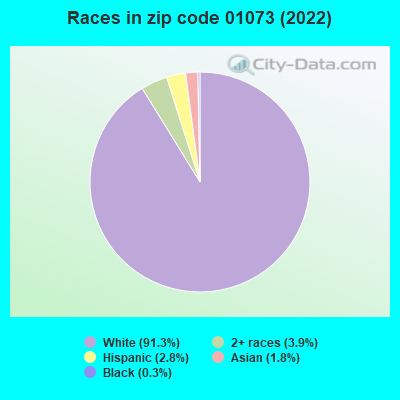
94.1% of residents of 01073 zip code speak English at home.
2.5% of residents speak Spanish at home (100% very well).
1.4% of residents speak other Indo-European language at home (75% very well, 25% not well).
1.6% of residents speak Asian or Pacific Island language at home (46% very well, 54% well).
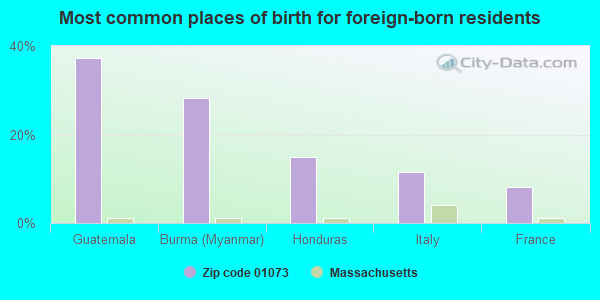
Foreign born population: 173 (2.8%) (35.2% of them are naturalized citizens)
This zip code:
2.8%
Whole state:
18.0%
37%Guatemala
28%Burma (Myanmar)
15%Honduras
11%Italy
8%France
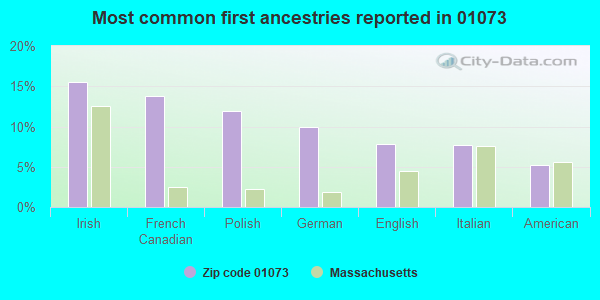
16%Irish
14%French Canadian
12%Polish
10%German
8%English
8%Italian
5%American
Year of entry for the foreign-born population
1692010 or later
652000 to 2009
51990 to 1999
59Before 1990
Facilities with environmental interests located in this zip code:
MR STRIPPER (6 COLEMAN RD in SOUTHAMPTON, MA)
(Integrated Compliance Information System) - ICIS-01-2001-0135, FORMAL ENFORCEMENT ACTION (Resource Conservation and Recovery Act (tracking hazardous waste)) Organizations: VANCE PITKIN (CONTACT/OWNER)
ATLAS COPCO HOLYOKE INC (CLARK ST in SOUTHAMPTON, MA)
(Resource Conservation and Recovery Act (tracking hazardous waste))
MID TOWN MOTORS (151 COLLEGE HWY in SOUTHAMPTON, MA)
Conditionally Exempt Small Quantity Generators, less than 100 kg/month of hazardous waste (Resource Conservation and Recovery Act (tracking hazardous waste)) - notification Organizations: BELDAN CORPORATION (CONTACT/OWNER)
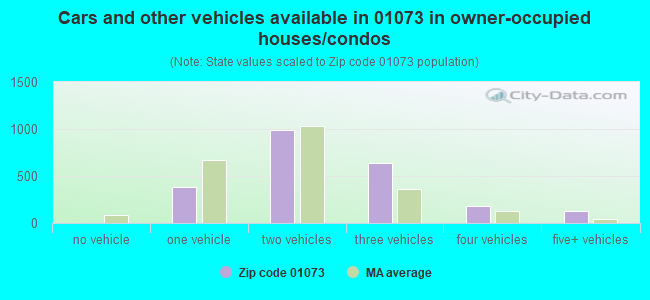
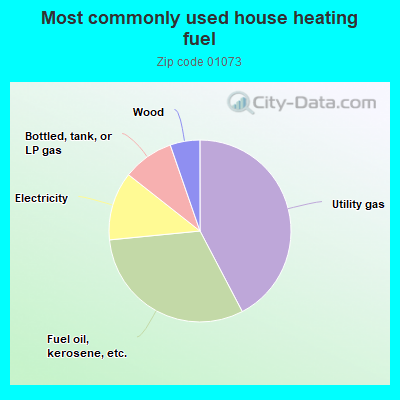
42.4%Utility gas
31.2%Fuel oil, kerosene, etc.
12.2%Electricity
9.1%Bottled, tank, or LP gas
5.3%Wood
Population in 1990: 4,478. Population change in the 1990s: +909 (+20.3%).
Place of birth for U.S.-born residents:
This state: 4,805
Northeast: 492
Midwest: 140
South: 369
West: 55
73% of the 01073 zip code residents lived in the same house 5 years ago. Out of people who lived in different houses, 48% lived in this county. Out of people who lived in different counties, 50% lived in Massachusetts.
95% of the 01073 zip code residents lived in the same house 1 year ago. Out of people who lived in different houses, 32% moved from this county. Out of people who lived in different houses, 10% moved from different county within same state. Out of people who lived in different houses, 64% moved from different state.
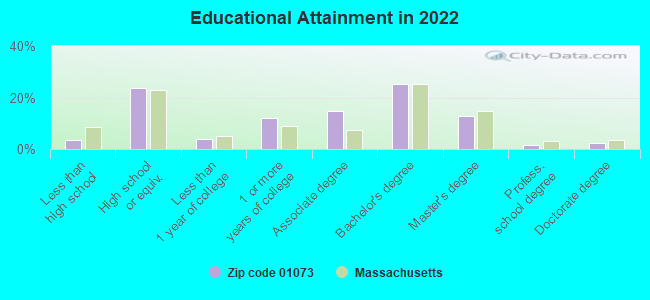
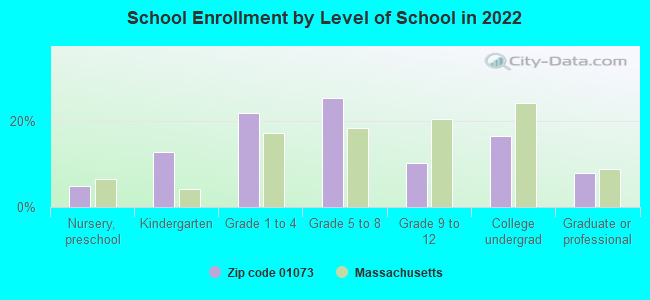
Private vs. public school enrollment:
Students in private schools in grades 1 to 8 (elementary and middle school): 51
Here:
10.4%
Massachusetts:
10.3%
Students in private schools in grades 9 to 12 (high school): 13
Here:
12.2%
Massachusetts:
12.3%
Students in private undergraduate colleges: 2
Here:
1.2%
Massachusetts:
51.2%
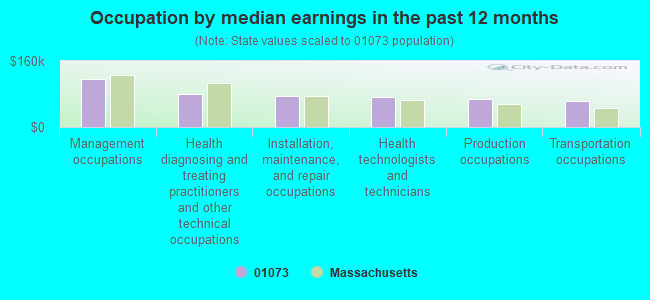
Occupation by median earnings in the past 12 months ($)
115,534Management occupations
79,459Health diagnosing and treating practitioners and other technical occupations
74,799Installation, maintenance, and repair occupations
73,397Health technologists and technicians
66,887Production occupations
63,013Transportation occupations
Companies with federal contracts located in this zip code:
SPECIALTY RESTORATION & REFINI (5 BULLHEAD RD in SOUTHAMPTON, MA; small business) : $23,660 in 3 contractsfrom 2004 to 2005
$12,785 with Army for Maintenance, Repair or Alteration of Real Property -- Restoration of real property. Signed on 2004-03-11. Completion date: 2004-04-10.
$7,000, same as above.Signed on 2005-04-25. Completion date: 2005-05-02.
$3,875 with Army for Maintenance, Repair or Alteration of Real Property -- Testing and Measurement Buildings. Signed on 2005-02-22. Completion date: 2005-03-24.
RIGHT CHOICE CAREERS, LLC (34 HIGH ST in SOUTHAMPTON, MA; small business) : $14,109 in 2 contractsfrom 2005 to 2006
$8,996 with Defense Finance and Accounting Service for Education Services. Taking place in OH. Signed on 2006-07-11. Completion date: 2006-08-01.
$5,113 with Department of Defense for Educational Services. Signed on 2005-09-15. Completion date: 2005-11-30.
Top industries in this zip code by the number of employees in 2005:
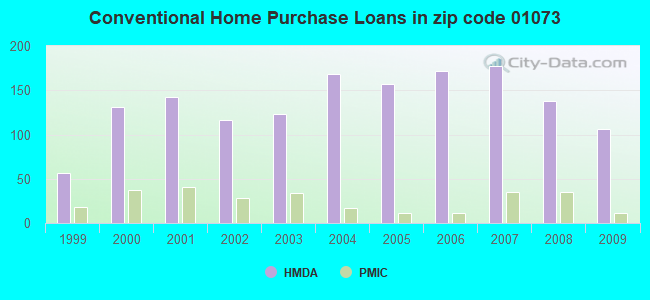
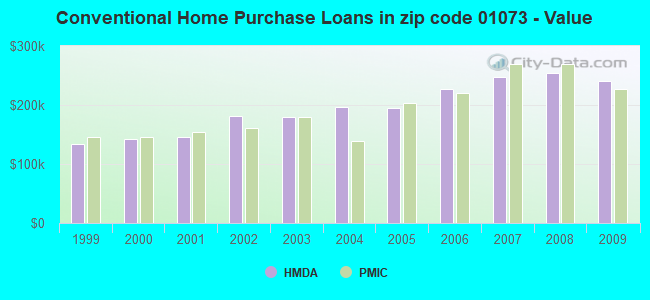
Detailed PMIC statistics for the following Tracts:8225.00
2002 - 2018 National Fire Incident Reporting System (NFIRS) incidents
Based on the data from the years 2002 - 2018 the average number of fire incidents per year is 28. The highest number of fire incidents - 81 took place in 2007, and the least - 3 in 2013. The data has a dropping trend.
When looking into fire subcategories, the most reports belonged to: Other (37.1%), and Outside Fires (30.7%).
Fire incident types reported to NFIRS in Zip Code 01073


 Nearest zip codes: 01027, 01085, 01040, 01097, 01062, 01086.


 Based on the data from the years 2002 - 2018 the average number of fire incidents per year is 28. The highest number of fire incidents - 81 took place in 2007, and the least - 3 in 2013. The data has a dropping trend.
 When looking into fire subcategories, the most reports belonged to: Other (37.1%), and Outside Fires (30.7%).