Estimated median house/condo value in 2022: $416,688
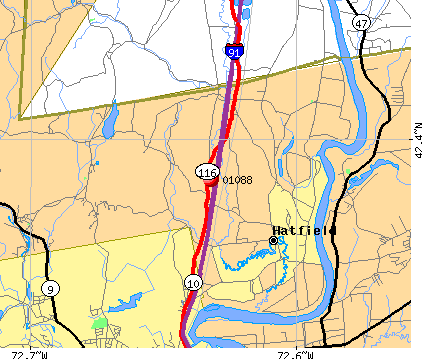
01088:
$416,688
Massachusetts:
$534,700
Median resident age:
This zip code:
31.8 years
Massachusetts median age:
40.3 years
Average household size:
This zip code:
1.8 people
Massachusetts:
2.4 people
Averages for the 2020 tax year for zip code 01088, filed in 2021:
Average Adjusted Gross Income (AGI) in 2020: $63,315 (Individual Income Tax Returns)
Here:
$63,315
State:
$105,130
Salary/wage: $52,288 (reported on 76.5% of returns)
Here:
$52,288
State:
$82,951
(% of AGI for various income ranges: 944.3% for AGIs below $25k, 2888.3% for AGIs $25k-50k, 6732.5% for AGIs $50k-75k, 8900.0% for AGIs $75k-100k, 22426.7% for AGIs $100k-200k)
Taxable interest for individuals: $662 (reported on 38.2% of returns)
This zip code:
$662
Massachusetts:
$2,361
(% of AGI for various income ranges: 27.1% for AGIs below $25k, 60.0% for AGIs $50k-75k, 143.3% for AGIs $100k-200k)
Ordinary dividends: $2,825 (reported on 23.5% of returns)
Here:
$2,825
State:
$10,365
(% of AGI for various income ranges: 85.0% for AGIs $25k-50k, 212.5% for AGIs $50k-75k, 300.0% for AGIs $100k-200k)
Net capital gain/loss in AGI: +$9,214 (reported on 20.6% of returns)
Here:
+$9,214
State:
+$48,178
(% of AGI for various income ranges: 225.0% for AGIs $25k-50k, 1700.0% for AGIs $100k-200k)
Profit/loss from business: +$8,317 (reported on 17.6% of returns)
Here:
+$8,317
State:
+$20,792
(% of AGI for various income ranges: 171.4% for AGIs below $25k, 947.5% for AGIs $50k-75k)
Taxable individual retirement arrangement distribution: $25,800 (reported on 8.8% of returns)
01088:
$25,800
Massachusetts:
$22,790
(% of AGI for various income ranges: 1935.0% for AGIs $50k-75k)
Total itemized deductions: $24,250 (reported on 5.9% of returns)
Here:
$24,250
State:
$36,722
(% of AGI for various income ranges: 1212.5% for AGIs $50k-75k)
Taxes paid: $8,600 (reported on 5.9% of returns)
01088:
$8,600
State:
$8,782
(% of AGI for various income ranges: 430.0% for AGIs $50k-75k)
Earned income credit: $1,433 (reported on 8.8% of returns)
Here:
$1,433
State:
$1,909
(% of AGI for various income ranges: 61.4% for AGIs below $25k)
Percentage of individuals using paid preparers for their 2020 taxes: 94.1%
Here:
94%
State:
92%
(% for various income ranges: 90.9% for AGIs below $25k, 100.0% for AGIs $25k-50k, 100.0% for AGIs $50k-75k, 100.0% for AGIs $75k-100k, 85.7% for AGIs $100k-200k)
Averages for the 2012 tax year for zip code 01088, filed in 2013:
Average Adjusted Gross Income (AGI) in 2012: $51,025 (Individual Income Tax Returns)
Here:
$51,025
State:
$81,425
Salary/wage: $44,371 (reported on 75.0% of returns)
Here:
$44,371
State:
$64,752
(% of AGI for various income ranges: 63.5% for AGIs below $25k, 69.0% for AGIs $25k-50k, 73.5% for AGIs $50k-75k, 80.0% for AGIs $75k-100k, 53.4% for AGIs $100k-200k)
Taxable interest for individuals: $721 (reported on 43.8% of returns)
This zip code:
$721
Massachusetts:
$2,136
(% of AGI for various income ranges: 0.4% for AGIs below $25k, 0.5% for AGIs $25k-50k, 1.0% for AGIs $50k-75k, 0.7% for AGIs $100k-200k)
Ordinary dividends: $3,850 (reported on 25.0% of returns)
Here:
$3,850
State:
$9,473
(% of AGI for various income ranges: 2.2% for AGIs below $25k, 0.9% for AGIs $50k-75k, 4.0% for AGIs $100k-200k)
Profit/loss from business: +$13,980 (reported on 15.6% of returns)
Here:
+$13,980
State:
+$20,662
Taxable individual retirement arrangement distribution: $3,400 (reported on 6.2% of returns)
01088:
$3,400
Massachusetts:
$18,892
Total itemized deductions: $19,678 (19% of AGI, reported on 28.1% of returns)
Here:
$19,678
State:
$28,907
Here:
19.5% of AGI
State:
18.2% of AGI
Charity contributions: $1,475 (reported on 25.0% of returns)
Here:
$1,475
State:
$4,208
Taxes paid: $8,767 (reported on 28.1% of returns)
01088:
$8,767
State:
$13,303
Earned income credit: $1,500 (reported on 9.4% of returns)
Here:
$1,500
State:
$1,971
(% of AGI for various income ranges: 3.2% for AGIs below $25k)
Percentage of individuals using paid preparers for their 2012 taxes: 50.0%
Here:
50%
State:
56%
(% for various income ranges: 45.5% for AGIs below $25k, 37.5% for AGIs $25k-50k, 83.3% for AGIs $50k-75k, 75.0% for AGIs $100k-200k)
Averages for the 2004 tax year for zip code 01088, filed in 2005:
Average Adjusted Gross Income (AGI) in 2004: $46,045 (Individual Income Tax Returns)
Here:
$46,045
State:
$62,877
Salary/wage: $39,597 (reported on 83.1% of returns)
Here:
$39,597
State:
$52,969
(% of AGI for various income ranges: 71.0% for AGIs below $10k, 66.6% for AGIs $10k-25k, 78.3% for AGIs $25k-50k, 75.5% for AGIs $50k-75k, 78.0% for AGIs $75k-100k, 64.6% for AGIs over 100k)
Taxable interest for individuals: $1,163 (reported on 57.5% of returns)
This zip code:
$1,163
Massachusetts:
$1,945
(% of AGI for various income ranges: 2.4% for AGIs below $10k, 3.7% for AGIs $10k-25k, 1.3% for AGIs $25k-50k, 0.5% for AGIs $50k-75k, 1.3% for AGIs $75k-100k, 1.6% for AGIs over 100k)
Taxable dividends: $1,647 (reported on 32.0% of returns)
Here:
$1,647
State:
$5,323
(% of AGI for various income ranges: 1.6% for AGIs below $10k, 1.5% for AGIs $10k-25k, 0.4% for AGIs $25k-50k, 1.0% for AGIs $50k-75k, 1.8% for AGIs over 100k)
Net capital gain/loss: +$5,714 (reported on 18.4% of returns)
Here:
+$5,714
State:
+$20,377
(% of AGI for various income ranges: 1.2% for AGIs $10k-25k, 0.5% for AGIs $50k-75k, 5.6% for AGIs over 100k)
Profit/loss from business: +$10,960 (reported on 18.8% of returns)
Here:
+$10,960
State:
+$17,837
(% of AGI for various income ranges: 44.8% for AGIs below $10k, 8.3% for AGIs $25k-50k, 1.8% for AGIs $50k-75k, 4.2% for AGIs over 100k)
IRA payment deduction: $2,273 (reported on 4.1% of returns)
01088:
$2,273
Massachusetts:
$3,100
Total itemized deductions: $18,769 (22% of AGI, reported on 34.2% of returns)
Here:
$18,769
State:
$22,573
Here:
22.0% of AGI
State:
19.5% of AGI
(% of AGI for various income ranges: 13.9% for AGIs $25k-50k, 12.4% for AGIs $50k-75k, 17.1% for AGIs $75k-100k, 18.0% for AGIs over 100k)
Charity contributions deductions: $2,061 (2% of AGI, reported on 30.8% of returns)
Here:
$2,061
State:
$3,295
Here:
2.3% of AGI
State:
2.7% of AGI
Total tax: $6,443 (reported on 83.1% of returns)
01088:
$6,443
State:
$11,494
(% of AGI for various income ranges: 4.0% for AGIs below $10k, 5.2% for AGIs $10k-25k, 9.1% for AGIs $25k-50k, 9.9% for AGIs $50k-75k, 10.3% for AGIs $75k-100k, 16.2% for AGIs over 100k)
Earned income credit: $650 (reported on 7.5% of returns)
Here:
$650
State:
$1,518
Percentage of individuals using paid preparers for their 2004 taxes: 57.5%
Here:
58%
State:
58%
(% for various income ranges: 55.8% for AGIs below $10k, 43.3% for AGIs $10k-25k, 53.0% for AGIs $25k-50k, 71.1% for AGIs $50k-75k, 73.3% for AGIs $75k-100k, 71.4% for AGIs over 100k)
Likely homosexual households (counted as self-reported same-sex unmarried-partner households)
Lesbian couples: 3.4% of all households
Gay men: 0.0% of all households
Household received Food Stamps/SNAP in the past 12 months: 65 Household did not receive Food Stamps/SNAP in the past 12 months: 333
Women who had a birth in the past 12 months: 36 (37 now married, 0 unmarried) Women who did not have a birth in the past 12 months: 208 (65 now married, 144 unmarried)
Housing units in zip code 01088 with a mortgage: 87 (12 second mortgage, 12 both second mortgage and home equity loan) Houses without a mortgage: 25
Median monthly owner costs for units with a mortgage: $2,411 Median monthly owner costs for units without a mortgage: $490
Residents with income below the poverty level in 2022:
This zip code:
12.5%
Whole state:
10.4%
Residents with income below 50% of the poverty level in 2022:
This zip code:
2.2%
Whole state:
5.1%
Median number of rooms in houses and condos:
Here:
6.7
State:
6.5
Median number of rooms in apartments:
Here:
2.3
State:
4.0
Notable locations in this zip code not listed on our city pages
Size of family households: 148 2-persons, 10 3-persons, 41 6-persons
Size of nonfamily households: 166 1-person, 34 2-persons
53 married couples with children.
86 single-parent households (86 women).
92.2% of residents of 01088 zip code speak English at home.
1.0% of residents speak Spanish at home (100% very well).
0.5% of residents speak other Indo-European language at home (100% very well).
5.5% of residents speak Asian or Pacific Island language at home (100% very well).
Foreign born population: 86 (11.9%) (52.9% of them are naturalized citizens)
This zip code:
11.9%
Whole state:
18.0%
31%Sweden
30%Malaysia
7%Guyana
57%Italian
9%British
5%Irish
4%French
4%Polish
3%American
3%Australian
Year of entry for the foreign-born population
02010 or later
292000 to 2009
01990 to 1999
50Before 1990
41.3%Electricity
25.8%Utility gas
11.9%Fuel oil, kerosene, etc.
10.6%Wood
9.0%Bottled, tank, or LP gas
2.1%Other fuel
Place of birth for U.S.-born residents:
This state: 334
Northeast: 255
South: 50
69% of the 01088 zip code residents lived in the same house 5 years ago. Out of people who lived in different houses, 53% lived in this county. Out of people who lived in different counties, 50% lived in Massachusetts.
79% of the 01088 zip code residents lived in the same house 1 year ago. Out of people who lived in different houses, 90% moved from this county.
Private vs. public school enrollment:
Students in private schools in grades 1 to 8 (elementary and middle school):
Here:
0.0%
Massachusetts:
10.3%
Students in private schools in grades 9 to 12 (high school):
Here:
0.0%
Massachusetts:
12.3%
Students in private undergraduate colleges: 20
Here:
40.3%
Massachusetts:
51.2%
Occupation by median earnings in the past 12 months ($)
76,735Education, training, and library occupations
43,197Office and administrative support occupations
23,257Management occupations
Top industries in this zip code by the number of employees in 2005:
Other Services (except Public Administration): Commercial and Industrial Machinery and Equipment (except Automotive and Electronic) Repair and Maintenance (20-49 employees: 1 establishment)
Administrative and Support and Waste Management and Remediation Services: Other Nonhazardous Waste Treatment and Disposal (10-19: 1)
Professional, Scientific, and Technical Services: Research and Development in the Physical, Engineering, and Life Sciences (5-9: 1, 1-4: 1)
Administrative and Support and Waste Management and Remediation Services: Other Services to Buildings and Dwellings (5-9: 1)
Finance and Insurance: Commercial Banking (5-9: 1)
Home Mortgage Disclosure Act Aggregated Statistics For Year 2009 (Based on 2 partial tracts)
A) FHA, FSA/RHS & VA Home Purchase Loans
B) Conventional Home Purchase Loans
C) Refinancings
D) Home Improvement Loans
E) Loans on Dwellings For 5+ Families
F) Non-occupant Loans on < 5 Family Dwellings (A B C & D)
Number
Average Value
Number
Average Value
Number
Average Value
Number
Average Value
Number
Average Value
Number
Average Value
LOANS ORIGINATED
5
$235,790
12
$201,468
53
$208,013
8
$165,384
1
$311,620
5
$161,520
APPLICATIONS APPROVED, NOT ACCEPTED
0
$0
1
$272,010
5
$182,684
0
$0
0
$0
1
$145,420
APPLICATIONS DENIED
1
$111,660
1
$38,950
8
$228,519
3
$50,203
0
$0
0
$0
APPLICATIONS WITHDRAWN
0
$0
1
$97,380
10
$220,014
0
$0
0
$0
1
$182,430
FILES CLOSED FOR INCOMPLETENESS
0
$0
1
$371,340
2
$139,580
0
$0
0
$0
0
$0
Aggregated Statistics For Year 2008 (Based on 2 partial tracts)
A) FHA, FSA/RHS & VA Home Purchase Loans
B) Conventional Home Purchase Loans
C) Refinancings
D) Home Improvement Loans
E) Loans on Dwellings For 5+ Families
F) Non-occupant Loans on < 5 Family Dwellings (A B C & D)
G) Loans On Manufactured Home Dwelling (A B C & D)
Number
Average Value
Number
Average Value
Number
Average Value
Number
Average Value
Number
Average Value
Number
Average Value
Number
Average Value
LOANS ORIGINATED
1
$346,020
19
$218,678
24
$186,726
8
$70,195
1
$298,630
6
$156,998
1
$62,970
APPLICATIONS APPROVED, NOT ACCEPTED
0
$0
3
$149,750
1
$149,320
0
$0
0
$0
0
$0
1
$58,430
APPLICATIONS DENIED
0
$0
1
$165,550
8
$368,584
4
$22,072
0
$0
1
$1,300
0
$0
APPLICATIONS WITHDRAWN
0
$0
2
$269,745
3
$164,897
0
$0
0
$0
0
$0
0
$0
FILES CLOSED FOR INCOMPLETENESS
0
$0
1
$192,160
0
$0
0
$0
0
$0
0
$0
0
$0
Aggregated Statistics For Year 2007 (Based on 2 partial tracts)
A) FHA, FSA/RHS & VA Home Purchase Loans
B) Conventional Home Purchase Loans
C) Refinancings
D) Home Improvement Loans
F) Non-occupant Loans on < 5 Family Dwellings (A B C & D)
Number
Average Value
Number
Average Value
Number
Average Value
Number
Average Value
Number
Average Value
LOANS ORIGINATED
1
$266,820
23
$215,478
21
$175,593
16
$84,477
3
$147,370
APPLICATIONS APPROVED, NOT ACCEPTED
0
$0
2
$199,630
5
$165,546
2
$42,200
1
$38,950
APPLICATIONS DENIED
1
$149,320
7
$143,659
12
$173,932
6
$66,652
1
$38,950
APPLICATIONS WITHDRAWN
1
$139,580
5
$196,188
6
$205,688
1
$190,220
1
$311,620
FILES CLOSED FOR INCOMPLETENESS
0
$0
0
$0
1
$551,820
1
$44,150
0
$0
Aggregated Statistics For Year 2006 (Based on 2 partial tracts)
A) FHA, FSA/RHS & VA Home Purchase Loans
B) Conventional Home Purchase Loans
C) Refinancings
D) Home Improvement Loans
F) Non-occupant Loans on < 5 Family Dwellings (A B C & D)
Number
Average Value
Number
Average Value
Number
Average Value
Number
Average Value
Number
Average Value
LOANS ORIGINATED
1
$115,560
21
$209,166
38
$153,314
15
$114,822
1
$136,330
APPLICATIONS APPROVED, NOT ACCEPTED
0
$0
3
$150,830
3
$154,510
1
$74,010
0
$0
APPLICATIONS DENIED
0
$0
8
$241,746
18
$222,531
8
$66,868
1
$6,490
APPLICATIONS WITHDRAWN
0
$0
5
$197,356
12
$205,039
1
$64,920
0
$0
FILES CLOSED FOR INCOMPLETENESS
0
$0
2
$136,655
3
$214,670
1
$9,740
0
$0
Aggregated Statistics For Year 2005 (Based on 2 partial tracts)
A) FHA, FSA/RHS & VA Home Purchase Loans
B) Conventional Home Purchase Loans
C) Refinancings
D) Home Improvement Loans
E) Loans on Dwellings For 5+ Families
F) Non-occupant Loans on < 5 Family Dwellings (A B C & D)
G) Loans On Manufactured Home Dwelling (A B C & D)
Number
Average Value
Number
Average Value
Number
Average Value
Number
Average Value
Number
Average Value
Number
Average Value
Number
Average Value
LOANS ORIGINATED
1
$111,010
30
$208,263
35
$165,194
14
$85,555
1
$38,950
6
$159,378
1
$12,980
APPLICATIONS APPROVED, NOT ACCEPTED
0
$0
2
$153,210
4
$179,828
2
$29,865
0
$0
1
$91,540
0
$0
APPLICATIONS DENIED
0
$0
1
$84,400
10
$206,316
2
$61,675
0
$0
1
$3,250
0
$0
APPLICATIONS WITHDRAWN
0
$0
8
$173,499
14
$203,524
2
$417,760
0
$0
2
$273,960
0
$0
FILES CLOSED FOR INCOMPLETENESS
0
$0
4
$164,735
2
$207,745
1
$38,950
0
$0
1
$227,220
0
$0
Aggregated Statistics For Year 2004 (Based on 2 partial tracts)
B) Conventional Home Purchase Loans
C) Refinancings
D) Home Improvement Loans
E) Loans on Dwellings For 5+ Families
F) Non-occupant Loans on < 5 Family Dwellings (A B C & D)
G) Loans On Manufactured Home Dwelling (A B C & D)
Number
Average Value
Number
Average Value
Number
Average Value
Number
Average Value
Number
Average Value
Number
Average Value
LOANS ORIGINATED
19
$214,099
53
$152,305
14
$81,243
1
$255,780
4
$144,935
0
$0
APPLICATIONS APPROVED, NOT ACCEPTED
1
$116,860
5
$145,550
1
$103,870
0
$0
1
$199,950
1
$19,480
APPLICATIONS DENIED
2
$222,025
10
$183,594
3
$38,520
0
$0
1
$650
0
$0
APPLICATIONS WITHDRAWN
3
$186,103
18
$154,798
1
$64,920
0
$0
1
$201,250
0
$0
FILES CLOSED FOR INCOMPLETENESS
0
$0
3
$396,013
0
$0
0
$0
0
$0
0
$0
Aggregated Statistics For Year 2003 (Based on 2 partial tracts)
A) FHA, FSA/RHS & VA Home Purchase Loans
B) Conventional Home Purchase Loans
C) Refinancings
D) Home Improvement Loans
E) Loans on Dwellings For 5+ Families
F) Non-occupant Loans on < 5 Family Dwellings (A B C & D)
Number
Average Value
Number
Average Value
Number
Average Value
Number
Average Value
Number
Average Value
Number
Average Value
LOANS ORIGINATED
1
$94,780
27
$173,745
124
$145,913
3
$37,003
1
$566,750
6
$130,490
APPLICATIONS APPROVED, NOT ACCEPTED
1
$108,420
3
$178,530
9
$167,710
1
$3,250
0
$0
1
$98,680
APPLICATIONS DENIED
0
$0
4
$165,382
12
$166,249
1
$94,130
1
$249,940
0
$0
APPLICATIONS WITHDRAWN
0
$0
3
$109,283
19
$152,118
1
$19,480
0
$0
1
$90,890
FILES CLOSED FOR INCOMPLETENESS
0
$0
0
$0
1
$52,590
0
$0
0
$0
0
$0
Aggregated Statistics For Year 2002 (Based on 2 partial tracts)
A) FHA, FSA/RHS & VA Home Purchase Loans
B) Conventional Home Purchase Loans
C) Refinancings
D) Home Improvement Loans
F) Non-occupant Loans on < 5 Family Dwellings (A B C & D)
Number
Average Value
Number
Average Value
Number
Average Value
Number
Average Value
Number
Average Value
LOANS ORIGINATED
3
$107,767
28
$152,145
65
$134,734
6
$53,450
3
$86,993
APPLICATIONS APPROVED, NOT ACCEPTED
0
$0
3
$136,763
5
$113,870
1
$35,710
1
$103,870
APPLICATIONS DENIED
0
$0
1
$75,310
5
$259,940
2
$65,895
0
$0
APPLICATIONS WITHDRAWN
1
$170,090
5
$165,416
14
$152,701
0
$0
1
$120,100
FILES CLOSED FOR INCOMPLETENESS
0
$0
1
$105,170
1
$144,770
1
$64,920
1
$70,110
Aggregated Statistics For Year 2001 (Based on 2 partial tracts)
A) FHA, FSA/RHS & VA Home Purchase Loans
B) Conventional Home Purchase Loans
C) Refinancings
D) Home Improvement Loans
E) Loans on Dwellings For 5+ Families
F) Non-occupant Loans on < 5 Family Dwellings (A B C & D)
Number
Average Value
Number
Average Value
Number
Average Value
Number
Average Value
Number
Average Value
Number
Average Value
LOANS ORIGINATED
1
$81,800
25
$166,221
52
$123,086
3
$20,127
1
$194,760
3
$77,040
APPLICATIONS APPROVED, NOT ACCEPTED
0
$0
1
$143,470
3
$180,910
0
$0
0
$0
0
$0
APPLICATIONS DENIED
0
$0
2
$192,490
5
$93,096
1
$28,560
0
$0
0
$0
APPLICATIONS WITHDRAWN
0
$0
2
$159,055
5
$148,666
1
$16,230
0
$0
0
$0
FILES CLOSED FOR INCOMPLETENESS
0
$0
0
$0
1
$153,210
0
$0
0
$0
0
$0
Aggregated Statistics For Year 2000 (Based on 2 partial tracts)
A) FHA, FSA/RHS & VA Home Purchase Loans
B) Conventional Home Purchase Loans
C) Refinancings
D) Home Improvement Loans
E) Loans on Dwellings For 5+ Families
F) Non-occupant Loans on < 5 Family Dwellings (A B C & D)
Number
Average Value
Number
Average Value
Number
Average Value
Number
Average Value
Number
Average Value
Number
Average Value
LOANS ORIGINATED
3
$154,510
26
$139,328
15
$88,075
3
$9,090
1
$103,870
2
$140,875
APPLICATIONS APPROVED, NOT ACCEPTED
0
$0
2
$209,040
2
$67,840
0
$0
0
$0
0
$0
APPLICATIONS DENIED
0
$0
1
$98,680
6
$88,615
0
$0
0
$0
0
$0
APPLICATIONS WITHDRAWN
0
$0
4
$177,718
5
$99,588
0
$0
0
$0
0
$0
FILES CLOSED FOR INCOMPLETENESS
0
$0
0
$0
1
$153,860
0
$0
0
$0
0
$0
Aggregated Statistics For Year 1999 (Based on 1 partial tract)
A) FHA, FSA/RHS & VA Home Purchase Loans
B) Conventional Home Purchase Loans
C) Refinancings
D) Home Improvement Loans
E) Loans on Dwellings For 5+ Families
F) Non-occupant Loans on < 5 Family Dwellings (A B C & D)


 Nearest zip codes: 01066, 01038, 01093, 01039, 01060, 01063.


