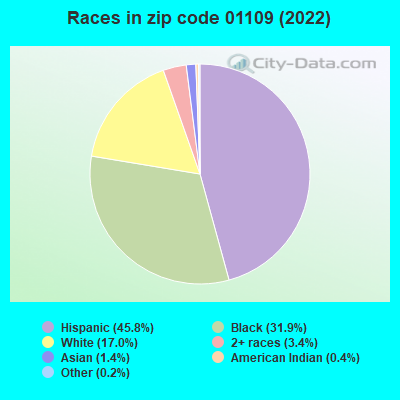
Estimated zip code population in 2022: 31,291 Zip code population in 2010: 30,250 Zip code population in 2000: 30,655
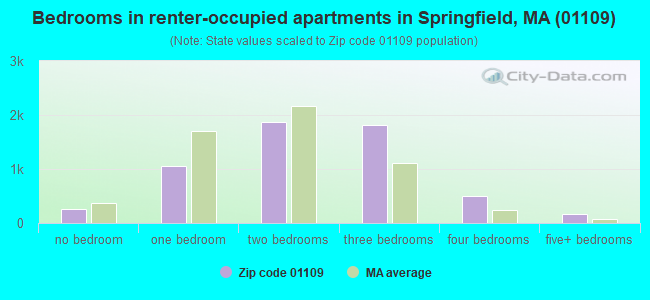
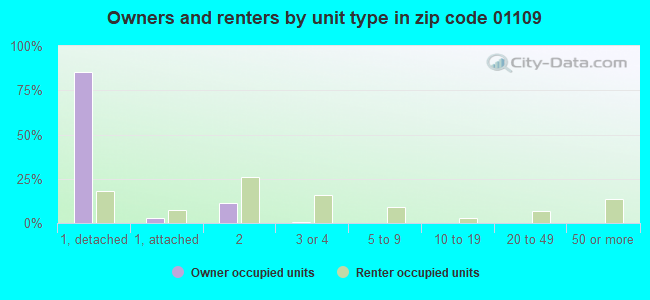
Houses and condos: 10,911 Renter-occupied apartments: 5,637
% of renters here:
57%
State:
38%
March 2022 cost of living index in zip code 01109: 119.5 (more than average, U.S. average is 100)
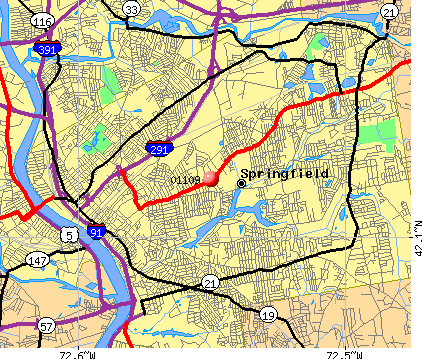
Land area: 5.4 sq. mi. Water area: 0.2 sq. mi.
Population density: 5,750 people per square mile
(average).
OSM Map
Google Map
MSN Map
OSM Map
General Map
Google Map
MSN Map
OSM Map
Google Map
MSN Map
OSM Map
Google Map
MSN Map
Please wait while loading the map...
Real estate property taxes paid for housing units in 2022:
This zip code:
1.3% ($2,519)
Massachusetts:
1.0% ($5,536)
Median real estate property taxes paid for housing units with mortgages in 2022: $2,490 (1.2%) Median real estate property taxes paid for housing units with no mortgage in 2022: $2,625 (1.4%)
Averages for the 2020 tax year for zip code 01109, filed in 2021:
Average Adjusted Gross Income (AGI) in 2020: $36,252 (Individual Income Tax Returns)
Here:
$36,252
State:
$105,130
Salary/wage: $31,850 (reported on 87.4% of returns)
Here:
$31,850
State:
$82,951
(% of AGI for various income ranges: 1128.0% for AGIs below $25k, 3396.0% for AGIs $25k-50k, 6571.2% for AGIs $50k-75k, 9806.2% for AGIs $75k-100k, 17710.8% for AGIs $100k-200k)
Taxable interest for individuals: $552 (reported on 12.0% of returns)
This zip code:
$552
Massachusetts:
$2,361
(% of AGI for various income ranges: 4.1% for AGIs below $25k, 4.1% for AGIs $25k-50k, 11.8% for AGIs $50k-75k, 22.9% for AGIs $75k-100k, 105.2% for AGIs $100k-200k)
Ordinary dividends: $2,639 (reported on 4.4% of returns)
Here:
$2,639
State:
$10,365
(% of AGI for various income ranges: 4.3% for AGIs below $25k, 5.6% for AGIs $25k-50k, 22.3% for AGIs $50k-75k, 62.2% for AGIs $75k-100k, 213.2% for AGIs $100k-200k)
Net capital gain/loss in AGI: +$5,187 (reported on 3.5% of returns)
Here:
+$5,187
State:
+$48,178
(% of AGI for various income ranges: 1.7% for AGIs below $25k, 4.2% for AGIs $25k-50k, 35.3% for AGIs $50k-75k, 75.8% for AGIs $75k-100k, 541.6% for AGIs $100k-200k)
Profit/loss from business: +$4,705 (reported on 9.5% of returns)
Here:
+$4,705
State:
+$20,792
(% of AGI for various income ranges: 25.0% for AGIs below $25k, 41.9% for AGIs $25k-50k, 113.8% for AGIs $50k-75k, 104.4% for AGIs $75k-100k, 445.6% for AGIs $100k-200k)
Taxable individual retirement arrangement distribution: $12,466 (reported on 3.4% of returns)
01109:
$12,466
Massachusetts:
$22,790
(% of AGI for various income ranges: 15.9% for AGIs below $25k, 22.8% for AGIs $25k-50k, 82.7% for AGIs $50k-75k, 188.9% for AGIs $75k-100k, 794.8% for AGIs $100k-200k)
Total itemized deductions: $23,372 (reported on 3.6% of returns)
Here:
$23,372
State:
$36,722
(% of AGI for various income ranges: 17.0% for AGIs below $25k, 63.4% for AGIs $25k-50k, 251.1% for AGIs $50k-75k, 429.8% for AGIs $75k-100k, 1027.2% for AGIs $100k-200k)
Charity contributions: $5,733 (reported on 2.8% of returns)
Here:
$5,733
State:
$12,529
(% of AGI for various income ranges: 1.5% for AGIs below $25k, 10.2% for AGIs $25k-50k, 43.9% for AGIs $50k-75k, 82.7% for AGIs $75k-100k, 262.0% for AGIs $100k-200k)
Taxes paid: $5,577 (reported on 3.6% of returns)
01109:
$5,577
State:
$8,782
(% of AGI for various income ranges: 2.1% for AGIs below $25k, 11.4% for AGIs $25k-50k, 63.0% for AGIs $50k-75k, 120.2% for AGIs $75k-100k, 289.2% for AGIs $100k-200k)
Earned income credit: $2,381 (reported on 30.9% of returns)
Here:
$2,381
State:
$1,909
(% of AGI for various income ranges: 128.0% for AGIs below $25k, 102.1% for AGIs $25k-50k, 1.2% for AGIs $50k-75k)
Percentage of individuals using paid preparers for their 2020 taxes: 93.1%
Here:
93%
State:
92%
(% for various income ranges: 93.2% for AGIs below $25k, 93.9% for AGIs $25k-50k, 93.1% for AGIs $50k-75k, 87.9% for AGIs $75k-100k, 89.4% for AGIs $100k-200k, 100.0% for AGIs over 200k)
Averages for the 2012 tax year for zip code 01109, filed in 2013:
Average Adjusted Gross Income (AGI) in 2012: $29,312 (Individual Income Tax Returns)
Here:
$29,312
State:
$81,425
Salary/wage: $26,973 (reported on 88.7% of returns)
Here:
$26,973
State:
$64,752
(% of AGI for various income ranges: 81.2% for AGIs below $25k, 85.8% for AGIs $25k-50k, 82.7% for AGIs $50k-75k, 80.6% for AGIs $75k-100k, 69.9% for AGIs $100k-200k)
Taxable interest for individuals: $683 (reported on 15.2% of returns)
This zip code:
$683
Massachusetts:
$2,136
(% of AGI for various income ranges: 0.3% for AGIs below $25k, 0.3% for AGIs $25k-50k, 0.2% for AGIs $50k-75k, 0.6% for AGIs $75k-100k, 0.7% for AGIs $100k-200k)
Ordinary dividends: $2,577 (reported on 6.0% of returns)
Here:
$2,577
State:
$9,473
(% of AGI for various income ranges: 0.2% for AGIs below $25k, 0.4% for AGIs $25k-50k, 0.6% for AGIs $50k-75k, 0.6% for AGIs $75k-100k, 1.3% for AGIs $100k-200k)
Net capital gain/loss in AGI: +$2,345 (reported on 3.6% of returns)
Here:
+$2,345
State:
+$31,437
(% of AGI for various income ranges: 0.3% for AGIs $50k-75k, 0.5% for AGIs $75k-100k, 1.3% for AGIs $100k-200k)
Profit/loss from business: +$8,545 (reported on 7.9% of returns)
Here:
+$8,545
State:
+$20,662
(% of AGI for various income ranges: 5.0% for AGIs below $25k, 1.3% for AGIs $25k-50k, 1.7% for AGIs $50k-75k, 1.7% for AGIs $75k-100k, 1.2% for AGIs $100k-200k)
Taxable individual retirement arrangement distribution: $9,096 (reported on 4.4% of returns)
01109:
$9,096
Massachusetts:
$18,892
(% of AGI for various income ranges: 0.9% for AGIs below $25k, 1.0% for AGIs $25k-50k, 1.3% for AGIs $50k-75k, 2.1% for AGIs $75k-100k, 2.9% for AGIs $100k-200k)
Total itemized deductions: $15,417 (26% of AGI, reported on 17.8% of returns)
Here:
$15,417
State:
$28,907
Here:
26.3% of AGI
State:
18.2% of AGI
(% of AGI for various income ranges: 4.4% for AGIs below $25k, 8.0% for AGIs $25k-50k, 12.5% for AGIs $50k-75k, 12.7% for AGIs $75k-100k, 14.2% for AGIs $100k-200k)
Charity contributions: $2,920 (reported on 12.9% of returns)
Here:
$2,920
State:
$4,208
(% of AGI for various income ranges: 0.4% for AGIs below $25k, 0.9% for AGIs $25k-50k, 1.9% for AGIs $50k-75k, 1.9% for AGIs $75k-100k, 2.7% for AGIs $100k-200k)
Taxes paid: $4,984 (reported on 17.8% of returns)
01109:
$4,984
State:
$13,303
(% of AGI for various income ranges: 0.9% for AGIs below $25k, 2.3% for AGIs $25k-50k, 4.3% for AGIs $50k-75k, 4.7% for AGIs $75k-100k, 5.3% for AGIs $100k-200k)
Earned income credit: $2,484 (reported on 39.3% of returns)
Here:
$2,484
State:
$1,971
(% of AGI for various income ranges: 11.5% for AGIs below $25k, 1.9% for AGIs $25k-50k)
Percentage of individuals using paid preparers for their 2012 taxes: 50.5%
Here:
50%
State:
56%
(% for various income ranges: 47.4% for AGIs below $25k, 51.5% for AGIs $25k-50k, 58.6% for AGIs $50k-75k, 55.6% for AGIs $75k-100k, 66.7% for AGIs $100k-200k)
Averages for the 2004 tax year for zip code 01109, filed in 2005:
Average Adjusted Gross Income (AGI) in 2004: $27,077 (Individual Income Tax Returns)
Here:
$27,077
State:
$62,877
Salary/wage: $25,114 (reported on 90.4% of returns)
Here:
$25,114
State:
$52,969
(% of AGI for various income ranges: 88.8% for AGIs below $10k, 85.1% for AGIs $10k-25k, 89.7% for AGIs $25k-50k, 84.6% for AGIs $50k-75k, 85.0% for AGIs $75k-100k, 49.5% for AGIs over 100k)
Taxable interest for individuals: $856 (reported on 23.3% of returns)
This zip code:
$856
Massachusetts:
$1,945
(% of AGI for various income ranges: 0.9% for AGIs below $10k, 0.8% for AGIs $10k-25k, 0.5% for AGIs $25k-50k, 0.9% for AGIs $50k-75k, 0.7% for AGIs $75k-100k, 1.4% for AGIs over 100k)
Taxable dividends: $2,258 (reported on 7.8% of returns)
Here:
$2,258
State:
$5,323
(% of AGI for various income ranges: 0.7% for AGIs below $10k, 0.5% for AGIs $10k-25k, 0.3% for AGIs $25k-50k, 0.9% for AGIs $50k-75k, 0.6% for AGIs $75k-100k, 1.9% for AGIs over 100k)
Net capital gain/loss: +$6,983 (reported on 5.3% of returns)
Here:
+$6,983
State:
+$20,377
(% of AGI for various income ranges: -0.0% for AGIs below $10k, 0.2% for AGIs $10k-25k, 0.4% for AGIs $25k-50k, 0.9% for AGIs $50k-75k, 2.1% for AGIs $75k-100k, 9.6% for AGIs over 100k)
Profit/loss from business: +$5,452 (reported on 7.3% of returns)
Here:
+$5,452
State:
+$17,837
(% of AGI for various income ranges: 3.5% for AGIs below $10k, 2.9% for AGIs $10k-25k, 0.9% for AGIs $25k-50k, 0.8% for AGIs $50k-75k, 1.1% for AGIs $75k-100k, 1.2% for AGIs over 100k)
IRA payment deduction: $1,978 (reported on 0.8% of returns)
01109:
$1,978
Massachusetts:
$3,100
Total itemized deductions: $13,206 (25% of AGI, reported on 21.0% of returns)
Here:
$13,206
State:
$22,573
Here:
25.0% of AGI
State:
19.5% of AGI
(% of AGI for various income ranges: 4.6% for AGIs below $10k, 6.2% for AGIs $10k-25k, 9.9% for AGIs $25k-50k, 14.0% for AGIs $50k-75k, 15.4% for AGIs $75k-100k, 10.0% for AGIs over 100k)
Charity contributions deductions: $2,239 (4% of AGI, reported on 17.8% of returns)
Here:
$2,239
State:
$3,295
Here:
4.0% of AGI
State:
2.7% of AGI
(% of AGI for various income ranges: 0.4% for AGIs below $10k, 0.7% for AGIs $10k-25k, 1.3% for AGIs $25k-50k, 2.3% for AGIs $50k-75k, 2.3% for AGIs $75k-100k, 2.0% for AGIs over 100k)
Total tax: $3,213 (reported on 60.1% of returns)
01109:
$3,213
State:
$11,494
(% of AGI for various income ranges: 1.3% for AGIs below $10k, 3.1% for AGIs $10k-25k, 6.2% for AGIs $25k-50k, 8.9% for AGIs $50k-75k, 10.4% for AGIs $75k-100k, 16.4% for AGIs over 100k)
Earned income credit: $1,779 (reported on 33.8% of returns)
Here:
$1,779
State:
$1,518
Percentage of individuals using paid preparers for their 2004 taxes: 62.9%
Here:
63%
State:
58%
(% for various income ranges: 61.4% for AGIs below $10k, 65.1% for AGIs $10k-25k, 60.5% for AGIs $25k-50k, 64.5% for AGIs $50k-75k, 64.0% for AGIs $75k-100k, 73.1% for AGIs over 100k)
Household received Food Stamps/SNAP in the past 12 months: 4,796 Household did not receive Food Stamps/SNAP in the past 12 months: 5,637
Women who had a birth in the past 12 months: 370 (174 now married, 176 unmarried) Women who did not have a birth in the past 12 months: 7,753 (1,800 now married, 6,017 unmarried)
Housing units in zip code 01109 with a mortgage: 2,936 (225 second mortgage, 178 both second mortgage and home equity loan) Houses without a mortgage: 74
Median monthly owner costs for units with a mortgage: $1,466 Median monthly owner costs for units without a mortgage: $719
Residents with income below the poverty level in 2022:
This zip code:
25.6%
Whole state:
10.4%
Residents with income below 50% of the poverty level in 2022:
This zip code:
14.2%
Whole state:
5.1%
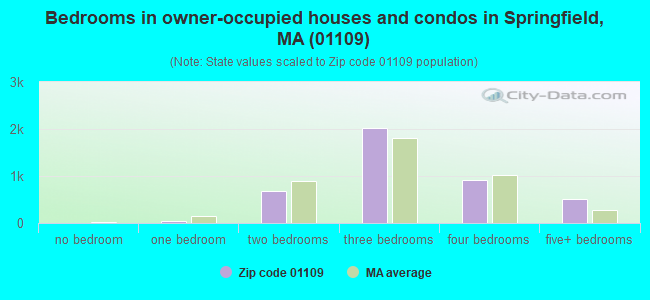
Median number of rooms in houses and condos:
Here:
6.2
State:
6.5
Median number of rooms in apartments:
Here:
4.7
State:
4.0
Notable locations in this zip code not listed on our city pages
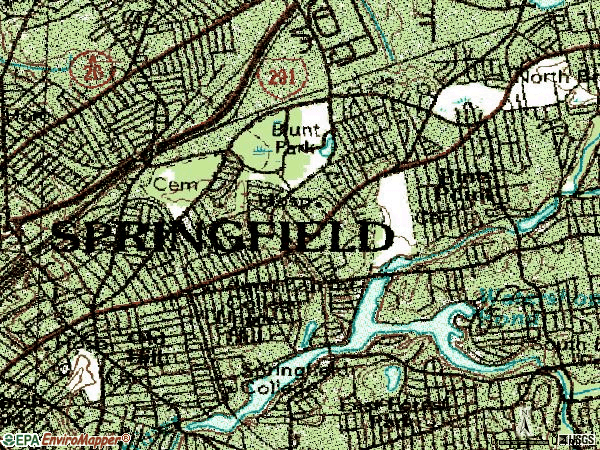
Notable locations in zip code 01109: Winchester Plaza (A), Babson Library (B), Bemis Hall (C), Beveridge Center (D), Adams Hall (E), Afro-American Cultural Center (F), Alumni House (G), Amaron Hall (H), Blake Field (I), Breck Hall of Science (J), National Ambulance Service (K), Broadhurt Hall (L), Butova Memorial Gymnasium (M), Cheney Hall (N), Springfield Fire Department Station 16 (O), Springfield Fire Department Station 8 (P), Dana Occupational Therapy Center (Q), Daughters of the American Revolution Hall (R), Doggett Memorial (S), Edgewood Gardens Campus (T). Display/hide their locations on the map
Shopping Centers: Winchester Plaza Shopping Center (1), Winchester Shoppers Plaza Shopping Center (2), Winchester Shopping Center (3), Breckwood Shopping Center (4), Gateway Shopping Center (5), Springfield Institution for Savings Shopping Mall (6). Display/hide their locations on the map
Churches in zip code 01109 include: Zion Community Baptist Church (A), Whole Truth Temple (B), Wesley United Methodist Church (C), Victory Church (D), Universal Temple Family Church (E), United House of Prayer Church (F), Union Church (G), True Vine Church (H), Trinity Lutheran Church (I). Display/hide their locations on the map
Parks in zip code 01109 include: Gunn Square (1), Winchester Square (2), Federal Square (3), Blunt Park (4), Potter Field (5), Benedum Field (6), Berry Field (7), Winchester Square Historic District (8), Wesson Park (9). Display/hide their locations on the map
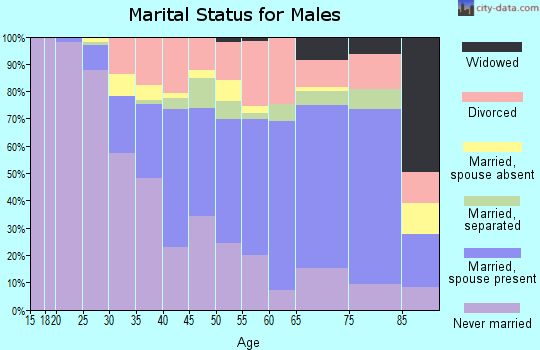
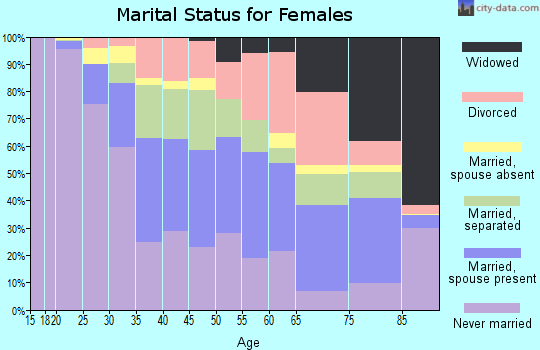
1,839 married couples with children.
4,316 single-parent households (480 men, 3,836 women).
62.3% of residents of 01109 zip code speak English at home.
33.9% of residents speak Spanish at home (57% very well, 18% well, 19% not well, 6% not at all).
0.5% of residents speak other Indo-European language at home (84% very well, 10% well, 5% not well).
1.3% of residents speak Asian or Pacific Island language at home (44% very well, 27% well, 28% not well, 1% not at all).
1.8% of residents speak other language at home (74% very well, 17% well, 9% not well).
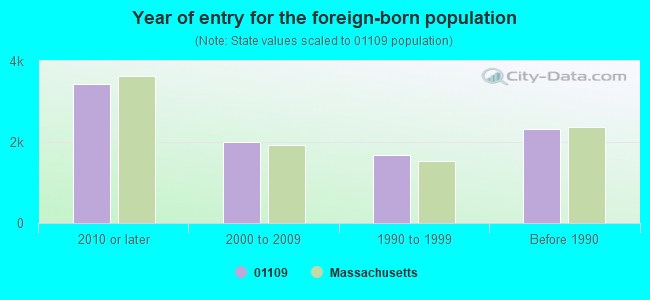
Foreign born population: 3,199 (10.2%) (61.1% of them are naturalized citizens)
Major facilities with environmental interests located in this zip code:
LE BELCHER PETROLEUM (615 ST. JAMES AVE in SPRINGFIELD, MA)
OIL CONTROL (Facility Response Plan for oil discharge) STATE MASTER (MA-EPICS) - RCRAINFO-MAD985307743, HAZARDOUS WASTE PROGRAM Large Quantity Generators, more that 1000 kg of hazardous waste/month (Resource Conservation and Recovery Act (tracking hazardous waste)) Organizations: BELCHER LEONARD E INC (CONTACT/OPERATOR)
, BOB JOHNSON (CONTACT/OWNER)
Alternative names: BELCHER LEONARD E INC
JST AUTOMOTIVE CENTER (1103-1107 STATE ST in SPRINGFIELD, MA)
(Integrated Compliance Information System) - ICIS-HQ-1999-1088, FORMAL ENFORCEMENT ACTION, ICIS-HQ-1999-1087, ICIS-HQ-1999-1216, (Resource Conservation and Recovery Act (tracking hazardous waste)) Business SIC classification: GASOLINE SERVICE STATIONS; AUTOMOTIVE SERVICES, EXCEPT REPAIR AND CARWASHES Organizations: RAJ & MARIA SINGH (CONTACT/OWNER)
Alternative names: J S T AUTOMOTIVE CENTER
DUGGAN MIDDLE SCHOOL (1015 WILBRAHAM RD in SPRINGFIELD, MA)
AIR SYNTHETIC MINOR (AIRS/AFS) (National Center for Education Statistics) - STATE ID-281320 CRITERIA AND HAZARDOUS AIR POLLUTANT INVENTORY (Inventory of air pollution sources) Business SIC classification: ELEMENTARY AND SECONDARY SCHOOLS Organizations: SPRINGFIELD (SCHOOL DISTRICT)
Alternative names: JOHN J DUGGAN MIDDLE, SPFL SCH DEP FAC MGT
MASS CAREER DEV INSTITUTE (140 WILBRAHAM AVENUE in SPRINGFIELD, MA)
(National Center for Education Statistics) - STATE ID-281600 Organizations: SPRINGFIELD (SCHOOL DISTRICT)
MARGARET C ELLS (319 CORTLAND STREET in SPRINGFIELD, MA)
(National Center for Education Statistics) - STATE ID-281060 Organizations: SPRINGFIELD (SCHOOL DISTRICT)
MAACO AUTO PAINTING (586 BERKSHIRE AVE. in SPRINGFIELD, MA)
AIR MINOR (AIRS/AFS) CRITERIA AND HAZARDOUS AIR POLLUTANT INVENTORY (Inventory of air pollution sources) (Resource Conservation and Recovery Act (tracking hazardous waste)) Alternative names: MAACO AUTO PAINTING & BODY WORKS
BRIDGE ACADEMY (118 ALDEN STREET in SPRINGFIELD, MA)
(National Center for Education Statistics) - STATE ID-281520 Organizations: SPRINGFIELD (SCHOOL DISTRICT)
COHEN BROS INC (846 BAY STREET in SPRINGFIELD, MA)
AIR MINOR (AIRS/AFS) CRITERIA AND HAZARDOUS AIR POLLUTANT INVENTORY (Inventory of air pollution sources) (Resource Conservation and Recovery Act (tracking hazardous waste)) Business SIC classification: SCRAP AND WASTE MATERIALS
LUSTER ON PRODUCTS INC (54 WALTHAM AVENUE in SPRINGFIELD, MA)
AIR MINOR (AIRS/AFS) CRITERIA AND HAZARDOUS AIR POLLUTANT INVENTORY (Inventory of air pollution sources) Conditionally Exempt Small Quantity Generators, less than 100 kg/month of hazardous waste (Resource Conservation and Recovery Act (tracking hazardous waste)) - notification TRI REPORTER (Tracking of toxic chemicals releasing facilities) Business SIC classification: INDUSTRIAL INORGANIC CHEMICALS; CHEMICALS AND CHEMICAL PREPARATIONS Business NAICS classification: ALL OTHER MISCELLANEOUS CHEMICAL PRODUCT AND PREPARATION MANUFACTURING.
CITY CLEANERS INCORPORATED (1072 STATE STREET in SPRINGFIELD, MA)
AIR MINOR (AIRS/AFS) CRITERIA AND HAZARDOUS AIR POLLUTANT INVENTORY (Inventory of air pollution sources) Small Quantity Generators, between 100 kg and 1000 kg of hazardous waste/month (Resource Conservation and Recovery Act (tracking hazardous waste)) - notification Business SIC classification: DRYCLEANING PLANTS, EXCEPT RUG CLEANING
LE BELCHER INC (1487 BAY ST in SPRINGFIELD, MA)
AIR MINOR (AIRS/AFS) Small Quantity Generators, between 100 kg and 1000 kg of hazardous waste/month (Resource Conservation and Recovery Act (tracking hazardous waste)) Business SIC classification: NONCLASSIFIABLE ESTABLISHMENTS Organizations: STAR ENTERPRISE (CONTACT/OWNER)
Alternative names: TEXACO SERVICE STA, TEXACO SVC STA BAYSTATE
COACH WORKS INC (600 STATE ST in SPRINGFIELD, MA)
AIR MINOR (AIRS/AFS) Conditionally Exempt Small Quantity Generators, less than 100 kg/month of hazardous waste (Resource Conservation and Recovery Act (tracking hazardous waste)) - notification Business SIC classification: NONCLASSIFIABLE ESTABLISHMENTS Business NAICS classification: TIRE RETREADING.
MUTUAL FORD INC (1535 BAY ST in SPRINGFIELD, MA)
(Resource Conservation and Recovery Act (tracking hazardous waste)) Organizations: JEFFREY HARBEY (CONTACT/OWNER)
, WILLIAM HARBEY (CONTACT/OWNER)
Housing units lacking complete plumbing facilities: 4.3% Housing units lacking complete kitchen facilities: 4.1%
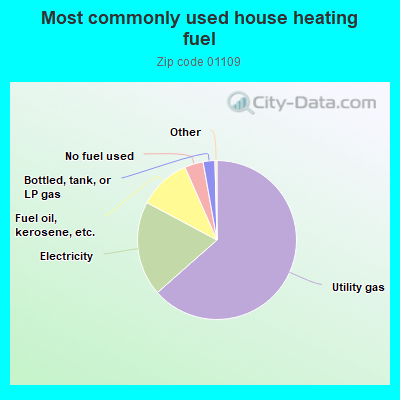
63.5%Utility gas
19.3%Electricity
10.6%Fuel oil, kerosene, etc.
3.8%No fuel used
2.4%Bottled, tank, or LP gas
Population in 1990: 32,635.
Place of birth for U.S.-born residents:
This state: 15,318
Northeast: 4,219
Midwest: 202
South: 1,933
West: 244
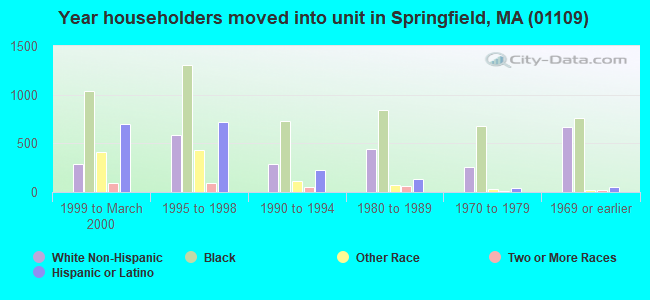
55% of the 01109 zip code residents lived in the same house 5 years ago. Out of people who lived in different houses, 73% lived in this county. Out of people who lived in different counties, 50% lived in Massachusetts.
93% of the 01109 zip code residents lived in the same house 1 year ago. Out of people who lived in different houses, 57% moved from this county. Out of people who lived in different houses, 11% moved from different county within same state. Out of people who lived in different houses, 6% moved from different state. Out of people who lived in different houses, 27% moved from abroad.
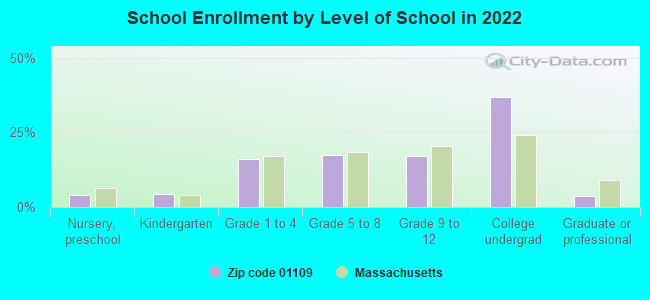
Private vs. public school enrollment:
Students in private schools in grades 1 to 8 (elementary and middle school): 215
Here:
6.2%
Massachusetts:
10.3%
Students in private schools in grades 9 to 12 (high school): 41
Here:
2.4%
Massachusetts:
12.3%
Students in private undergraduate colleges: 2,614
Here:
67.6%
Massachusetts:
51.2%
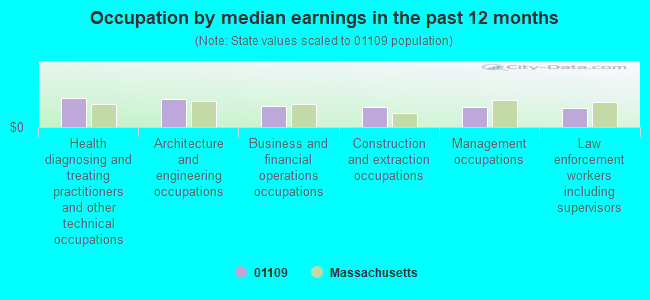
Occupation by median earnings in the past 12 months ($)
85,991Health diagnosing and treating practitioners and other technical occupations
82,235Architecture and engineering occupations
62,231Business and financial operations occupations
57,630Construction and extraction occupations
57,469Management occupations
56,974Law enforcement workers including supervisors
Companies with federal contracts located in this zip code (SPRINGFIELD, MA):
EASTERN GENERAL CONTRACTORS, I (52-60 BERKSHIRE AVE; small business) : $47,842,546 in 381 contractsfrom 1999 to 2006
Contracts for Maintenance, Repair or Alteration of Real Property -- Family Housing Facilities, Maintenance, Repair or Alteration of Real Property -- Miscellaneous Buildings, Construction of Structures and Facilities -- Office Buildings, Construction of Structures and Facilities -- Miscellaneous Buildings, and moreby Navy, Air Force, National Park Service, Army, and others Signed by year:2000: $7,974,585; 2001: $4,959,034; 2002: $6,962,305; 2003: $10,517,576; 2004: $5,309,417; 2005: $5,533,140; 2006: $5,806,718.
Biggest contracts:
$6,135,000 with Navy for Maintenance, Repair or Alteration of Real Property -- Family Housing Facilities. Taking place in CT. Signed on 2000-05-19. Completion date: 2001-03-30.
$4,809,000 with Air Force for Maintenance, Repair or Alteration of Real Property -- Miscellaneous Buildings. Signed on 2004-09-17. Completion date: 2005-09-08.
$4,336,728 with National Park Service for Construction of Structures and Facilities -- Office Buildings. Signed on 2006-09-12. Completion date: 2007-10-28.
$3,759,000 with Army for Construction of Structures and Facilities -- Miscellaneous Buildings. Signed on 2003-09-30. Completion date: 2003-03-06.
HILLTOP CONSTRUCTION INC (1102 STATE ST; small business) : $8,434,902 in 59 contractsfrom 2001 to 2006
Contracts for Maintenance, Repair or Alteration of Real Property -- Laboratories and Clinics, Maintenance, Repair or Alteration of Real Property -- Other Non-Building Facilities, Construction -- Basic Research (R&D), Maintenance, Repair or Alteration of Real Property -- Recreation Facilities (Non-Building), and moreby Department of Veterans Affairs, Army, Air Force, U.S. Army Corps of Engineers - civil program financing only, and others Signed by year:2000: $0; 2001: $619,682; 2002: $81,464; 2003: $2,279,368; 2004: $4,754,378; 2005: $203,010; 2006: $497,000.
Biggest contracts:
$2,999,992 with Department of Veterans Affairs for Maintenance, Repair or Alteration of Real Property -- Laboratories and Clinics. Taking place in NY. Signed on 2004-09-24. Completion date: 2006-06-30.
$1,285,332 with Army for Maintenance, Repair or Alteration of Real Property -- Other Non-Building Facilities. Signed on 2003-09-24. Completion date: 2004-06-30.
$497,000 with Department of Veterans Affairs for Construction -- Basic Research (R&D). Taking place in NY. Signed on 2006-09-29. Effective on 2006-09-26. Completion date: 2007-07-31.
$479,390 with Air Force for Maintenance, Repair or Alteration of Real Property -- Recreation Facilities (Non-Building). Signed on 2003-08-28. Completion date: 2003-12-31.
ROBERT EDWARDS GENERAL CONTG (1096 STATE ST; small business) : $544,812 in 5 contractsfrom 2000 to 2003
Contracts for Maintenance, Repair or Alteration of Real Property -- Maintenance Buildings, Construction of Structures and Facilities -- Maintenance Buildings, Maintenance, Repair or Alteration of Real Property -- Other Airfield Structures, Construction of Structures and Facilities -- Other Non-Building Facilities, and moreby Air Force, Army Signed by year:2000: $56,384; 2001: $0; 2002: $393,835; 2003: $94,593; 2004: $0; 2005: $0; 2006: $0.
Biggest contracts:
$393,835 with Air Force for Maintenance, Repair or Alteration of Real Property -- Maintenance Buildings. Signed on 2002-09-27. Completion date: 2003-02-14.
$56,384 with Army for Construction of Structures and Facilities -- Maintenance Buildings. Signed on 2000-02-25. Completion date: 2000-04-04.
$48,985 with Air Force for Maintenance, Repair or Alteration of Real Property -- Other Airfield Structures. Signed on 2003-07-24. Completion date: 2003-10-28.
$29,248 with Army for Construction of Structures and Facilities -- Other Non-Building Facilities. Taking place in CT. Signed on 2003-09-30. Completion date: 2004-01-31.
SPRINGFIELD COLLEGE (263 ALDEN ST) : $153,500 in 8 contractsfrom 2003 to 2005
Contracts for Educational Services, Technical Assistance, Other Social Services by Army Signed by year:2000: $0; 2001: $0; 2002: $0; 2003: $66,715; 2004: $68,785; 2005: $18,000; 2006: $0.
Biggest contracts:
$51,000 with Army for Educational Services. Signed on 2004-07-12. Completion date: 2004-07-12.
$51,000, same as above.Signed on 2004-04-02. Completion date: 2004-04-02.
$49,715 with Army for Technical Assistance. Signed on 2003-09-09. Completion date: 2004-12-31.
$20,000 with Army for Other Social Services. Taking place in FL. Signed on 2005-09-21. Completion date: 2005-09-21.
JAY HARLAND CORP (504 SAINT JAMES AVE; small business)
$49,500 with Air Force for Lease or Rental of Equipment -- Ground Effect Vehicles, Motor Vehicles, Trailers, and Cycles. Signed on 2003-04-07. Completion date: 2003-06-25.
GINA BAVARO (88 LARCHMONT ST; small business) : $36,550 in 6 contractsfrom 2002 to 2006
Contracts for Custodial Janitorial Services by Army Signed by year:2000: $0; 2001: $0; 2002: $6,600; 2003: $6,600; 2004: $8,100; 2005: $7,500; 2006: $7,750.
Biggest contracts:
$8,100 with Army for Custodial Janitorial Services. Signed on 2004-03-26. Completion date: 2005-04-30.
$7,500, same as above.Signed on 2006-04-26. Completion date: 2007-04-30.
$7,500, same as above.Signed on 2005-03-28. Completion date: 2006-04-30.
$6,600, same as above.Signed on 2003-04-26. Completion date: 2004-04-30.
Top industries in this zip code by the number of employees in 2005:
Educational Services: Colleges, Universities, and Professional Schools (500-999 employees: 1 establishment)
Finance and Insurance: Insurance Agencies and Brokerages (250-499: 1, 5-9: 1, 1-4: 4)
Health Care and Social Assistance: Residential Mental Retardation Facilities (250-499: 1, 5-9: 2)
Health Care and Social Assistance: Specialty (except Psychiatric and Substance Abuse) Hospitals (250-499: 1)
Accommodation and Food Services: Food Service Contractors (100-249: 1, 20-49: 2, 5-9: 1)
Health Care and Social Assistance: Child Day Care Services (50-99: 1, 20-49: 2, 10-19: 1, 5-9: 5, 1-4: 7)
Health Care and Social Assistance: Continuing Care Retirement Communities (100-249: 1, 20-49: 1)
Wholesale Trade: Petroleum Bulk Stations and Terminals (100-249: 1)
Utilities: Natural Gas Distribution (100-249: 1)
People in group quarters in 2010:
2,357 people in college/university student housing
69 people in nursing facilities/skilled-nursing facilities
42 people in residential treatment centers for adults
40 people in group homes intended for adults
29 people in mental (psychiatric) hospitals and psychiatric units in other hospitals
15 people in other noninstitutional facilities
8 people in residential treatment centers for juveniles (non-correctional)
People in group quarters in 2000:
1,942 people in college dormitories (includes college quarters off campus)
200 people in hospitals/wards and hospices for chronically ill
200 people in other hospitals or wards for chronically ill
79 people in nursing homes
49 people in homes or halfway houses for drug/alcohol abuse
43 people in homes for the mentally ill
17 people in other noninstitutional group quarters
16 people in homes for the mentally retarded
12 people in short-term care, detention or diagnostic centers for delinquent children
4 people in religious group quarters
Fatal accident statistics in 2014:
Fatal accident count: 2
Vehicles involved in fatal accidents: 2
Fatal accidents caused by drunken drivers: 1
Fatalities: 2
Persons involved in fatal accidents: 6
Pedestrians involved in fatal accidents: 1
Fatal accident statistics in 2012:
Fatal accident count: 2
Vehicles involved in fatal accidents: 3
Fatal accidents caused by drunken drivers: 0
Fatalities: 2
Persons involved in fatal accidents: 6
Pedestrians involved in fatal accidents: 0
Home Mortgage Disclosure Act Aggregated Statistics For Year 2009 (Based on 6 full and 8 partial tracts)
A) FHA, FSA/RHS & VA Home Purchase Loans
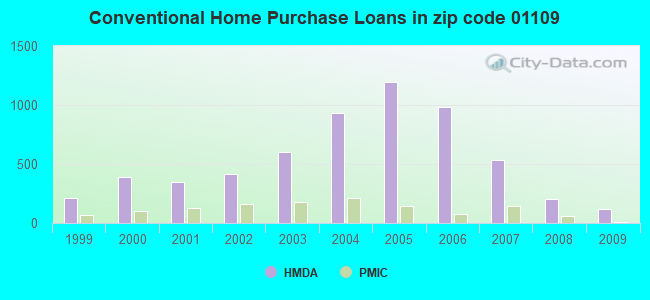
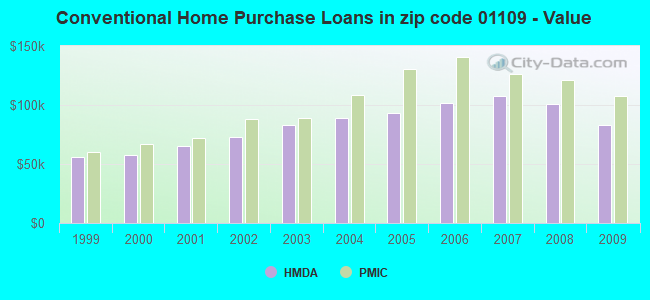
B) Conventional Home Purchase Loans
C) Refinancings
D) Home Improvement Loans
E) Loans on Dwellings For 5+ Families
F) Non-occupant Loans on < 5 Family Dwellings (A B C & D)
G) Loans On Manufactured Home Dwelling (A B C & D)
Number
Average Value
Number
Average Value
Number
Average Value
Number
Average Value
Number
Average Value
Number
Average Value
Number
Average Value
LOANS ORIGINATED
147
$126,590
120
$82,956
259
$111,697
37
$35,763
4
$839,378
47
$85,591
0
$0
APPLICATIONS APPROVED, NOT ACCEPTED
13
$124,506
6
$55,587
52
$131,521
9
$9,264
0
$0
8
$62,036
0
$0
APPLICATIONS DENIED
35
$115,640
41
$86,947
267
$105,708
94
$32,179
0
$0
44
$70,527
2
$2,975
APPLICATIONS WITHDRAWN
22
$95,052
21
$79,312
95
$116,946
6
$55,377
0
$0
14
$82,118
0
$0
FILES CLOSED FOR INCOMPLETENESS
2
$102,145
3
$96,847
43
$116,730
2
$19,380
0
$0
5
$105,616
0
$0
Aggregated Statistics For Year 2008 (Based on 6 full and 8 partial tracts)
A) FHA, FSA/RHS & VA Home Purchase Loans
B) Conventional Home Purchase Loans
C) Refinancings
D) Home Improvement Loans
E) Loans on Dwellings For 5+ Families
F) Non-occupant Loans on < 5 Family Dwellings (A B C & D)
G) Loans On Manufactured Home Dwelling (A B C & D)
Number
Average Value
Number
Average Value
Number
Average Value
Number
Average Value
Number
Average Value
Number
Average Value
Number
Average Value
LOANS ORIGINATED
100
$124,909
200
$100,603
305
$117,121
94
$36,431
4
$212,885
92
$101,192
2
$37,685
APPLICATIONS APPROVED, NOT ACCEPTED
13
$133,640
24
$98,786
91
$108,164
31
$35,763
0
$0
23
$88,463
0
$0
APPLICATIONS DENIED
40
$125,677
105
$97,259
510
$120,836
210
$42,352
0
$0
110
$85,686
3
$63,050
APPLICATIONS WITHDRAWN
18
$119,520
50
$113,228
142
$126,216
11
$53,541
2
$733,860
33
$111,546
0
$0
FILES CLOSED FOR INCOMPLETENESS
4
$117,880
16
$110,748
42
$143,895
4
$24,835
0
$0
6
$127,675
0
$0
Aggregated Statistics For Year 2007 (Based on 6 full and 8 partial tracts)
A) FHA, FSA/RHS & VA Home Purchase Loans
B) Conventional Home Purchase Loans
C) Refinancings
D) Home Improvement Loans
E) Loans on Dwellings For 5+ Families
F) Non-occupant Loans on < 5 Family Dwellings (A B C & D)
G) Loans On Manufactured Home Dwelling (A B C & D)
Number
Average Value
Number
Average Value
Number
Average Value
Number
Average Value
Number
Average Value
Number
Average Value
Number
Average Value
LOANS ORIGINATED
27
$136,397
536
$107,388
715
$112,209
182
$52,523
7
$605,744
172
$106,173
0
$0
APPLICATIONS APPROVED, NOT ACCEPTED
2
$103,875
109
$114,954
221
$112,061
31
$65,293
5
$292,058
43
$123,219
0
$0
APPLICATIONS DENIED
12
$147,206
288
$120,566
1,126
$126,669
347
$54,976
0
$0
178
$113,198
1
$113,260
APPLICATIONS WITHDRAWN
3
$123,853
81
$118,076
502
$124,287
38
$72,997
6
$284,632
55
$126,845
0
$0
FILES CLOSED FOR INCOMPLETENESS
0
$0
31
$119,436
119
$131,777
3
$89,447
2
$372,880
24
$115,912
0
$0
Aggregated Statistics For Year 2006 (Based on 6 full and 8 partial tracts)
A) FHA, FSA/RHS & VA Home Purchase Loans
B) Conventional Home Purchase Loans
C) Refinancings
D) Home Improvement Loans
E) Loans on Dwellings For 5+ Families
F) Non-occupant Loans on < 5 Family Dwellings (A B C & D)
G) Loans On Manufactured Home Dwelling (A B C & D)
Number
Average Value
Number
Average Value
Number
Average Value
Number
Average Value
Number
Average Value
Number
Average Value
Number
Average Value
LOANS ORIGINATED
18
$137,929
983
$101,472
1,169
$110,361
192
$56,294
2
$331,845
358
$114,573
2
$3,875
APPLICATIONS APPROVED, NOT ACCEPTED
2
$144,875
190
$100,526
194
$102,004
35
$42,548
0
$0
60
$99,559
0
$0
APPLICATIONS DENIED
5
$136,962
564
$100,906
1,453
$117,780
306
$50,095
5
$514,732
267
$109,711
4
$97,365
APPLICATIONS WITHDRAWN
7
$130,104
209
$107,783
903
$117,459
64
$76,994
2
$186,050
117
$117,396
2
$123,965
FILES CLOSED FOR INCOMPLETENESS
0
$0
42
$100,261
251
$118,145
4
$39,522
0
$0
25
$104,885
2
$112,575
Aggregated Statistics For Year 2005 (Based on 6 full and 8 partial tracts)
A) FHA, FSA/RHS & VA Home Purchase Loans
B) Conventional Home Purchase Loans
C) Refinancings
D) Home Improvement Loans
E) Loans on Dwellings For 5+ Families
F) Non-occupant Loans on < 5 Family Dwellings (A B C & D)
G) Loans On Manufactured Home Dwelling (A B C & D)
Number
Average Value
Number
Average Value
Number
Average Value
Number
Average Value
Number
Average Value
Number
Average Value
Number
Average Value
LOANS ORIGINATED
33
$124,338
1,192
$93,185
1,202
$103,097
215
$58,446
18
$596,180
460
$102,809
0
$0
APPLICATIONS APPROVED, NOT ACCEPTED
2
$156,260
181
$92,905
286
$98,534
50
$35,918
0
$0
86
$100,819
0
$0
APPLICATIONS DENIED
10
$128,759
470
$87,999
1,629
$107,097
375
$42,281
0
$0
238
$81,938
15
$32,912
APPLICATIONS WITHDRAWN
8
$137,978
292
$103,292
1,065
$111,247
82
$146,597
2
$151,730
163
$113,039
0
$0
FILES CLOSED FOR INCOMPLETENESS
0
$0
50
$98,839
210
$110,417
5
$53,540
1
$3,106,560
36
$103,660
0
$0
Aggregated Statistics For Year 2004 (Based on 6 full and 8 partial tracts)
A) FHA, FSA/RHS & VA Home Purchase Loans
B) Conventional Home Purchase Loans
C) Refinancings
D) Home Improvement Loans
E) Loans on Dwellings For 5+ Families
F) Non-occupant Loans on < 5 Family Dwellings (A B C & D)
G) Loans On Manufactured Home Dwelling (A B C & D)
Number
Average Value
Number
Average Value
Number
Average Value
Number
Average Value
Number
Average Value
Number
Average Value
Number
Average Value
LOANS ORIGINATED
79
$115,844
932
$89,065
1,223
$90,678
228
$48,242
16
$290,648
411
$91,229
2
$25,485
APPLICATIONS APPROVED, NOT ACCEPTED
26
$121,493
176
$89,244
323
$91,405
34
$33,201
0
$0
67
$92,849
3
$17,917
APPLICATIONS DENIED
27
$120,389
380
$88,161
1,161
$100,438
326
$29,028
0
$0
215
$80,007
8
$50,169
APPLICATIONS WITHDRAWN
2
$77,335
168
$96,094
1,110
$94,053
45
$72,198
5
$499,600
113
$93,792
0
$0
FILES CLOSED FOR INCOMPLETENESS
2
$68,995
37
$94,884
196
$101,568
17
$81,238
0
$0
35
$85,359
0
$0
Aggregated Statistics For Year 2003 (Based on 6 full and 8 partial tracts)
A) FHA, FSA/RHS & VA Home Purchase Loans
B) Conventional Home Purchase Loans
C) Refinancings
D) Home Improvement Loans
E) Loans on Dwellings For 5+ Families
F) Non-occupant Loans on < 5 Family Dwellings (A B C & D)
Number
Average Value
Number
Average Value
Number
Average Value
Number
Average Value
Number
Average Value
Number
Average Value
LOANS ORIGINATED
110
$103,022
598
$83,046
1,239
$80,922
96
$24,202
9
$541,883
296
$76,428
APPLICATIONS APPROVED, NOT ACCEPTED
13
$97,047
126
$83,213
316
$75,429
18
$25,031
0
$0
68
$71,698
APPLICATIONS DENIED
21
$103,871
216
$80,992
963
$77,950
160
$21,234
2
$131,895
124
$77,880
APPLICATIONS WITHDRAWN
6
$154,130
67
$100,227
685
$88,820
17
$19,309
0
$0
64
$85,315
FILES CLOSED FOR INCOMPLETENESS
6
$103,848
6
$112,590
45
$85,863
4
$12,630
0
$0
3
$74,930
Aggregated Statistics For Year 2002 (Based on 6 full and 8 partial tracts)
A) FHA, FSA/RHS & VA Home Purchase Loans
B) Conventional Home Purchase Loans
C) Refinancings
D) Home Improvement Loans
E) Loans on Dwellings For 5+ Families
F) Non-occupant Loans on < 5 Family Dwellings (A B C & D)
Number
Average Value
Number
Average Value
Number
Average Value
Number
Average Value
Number
Average Value
Number
Average Value
LOANS ORIGINATED
144
$90,586
412
$72,969
734
$72,027
74
$21,703
6
$199,867
186
$64,664
APPLICATIONS APPROVED, NOT ACCEPTED
23
$79,906
73
$69,732
190
$69,052
25
$19,844
0
$0
40
$58,594
APPLICATIONS DENIED
34
$91,580
124
$71,572
723
$68,942
131
$19,061
2
$428,415
94
$70,440
APPLICATIONS WITHDRAWN
11
$97,094
43
$77,602
402
$77,670
16
$41,468
0
$0
48
$75,991
FILES CLOSED FOR INCOMPLETENESS
2
$69,090
28
$77,347
98
$77,861
3
$13,670
0
$0
5
$62,284
Aggregated Statistics For Year 2001 (Based on 6 full and 8 partial tracts)
A) FHA, FSA/RHS & VA Home Purchase Loans
B) Conventional Home Purchase Loans
C) Refinancings
D) Home Improvement Loans
E) Loans on Dwellings For 5+ Families
F) Non-occupant Loans on < 5 Family Dwellings (A B C & D)
Number
Average Value
Number
Average Value
Number
Average Value
Number
Average Value
Number
Average Value
Number
Average Value
LOANS ORIGINATED
191
$80,591
345
$65,034
607
$69,237
83
$20,151
8
$76,198
109
$63,125
APPLICATIONS APPROVED, NOT ACCEPTED
20
$79,103
61
$73,772
138
$65,320
17
$23,015
7
$119,083
25
$90,583
APPLICATIONS DENIED
23
$78,367
157
$67,870
753
$63,288
232
$17,623
3
$253,380
77
$53,708
APPLICATIONS WITHDRAWN
19
$75,010
25
$66,827
392
$71,030
29
$23,966
0
$0
40
$61,828
FILES CLOSED FOR INCOMPLETENESS
4
$92,342
6
$41,920
62
$70,937
6
$6,152
0
$0
4
$71,258
Aggregated Statistics For Year 2000 (Based on 6 full and 8 partial tracts)
A) FHA, FSA/RHS & VA Home Purchase Loans
B) Conventional Home Purchase Loans
C) Refinancings
D) Home Improvement Loans
E) Loans on Dwellings For 5+ Families
F) Non-occupant Loans on < 5 Family Dwellings (A B C & D)
Number
Average Value
Number
Average Value
Number
Average Value
Number
Average Value
Number
Average Value
Number
Average Value
LOANS ORIGINATED
158
$72,958
386
$57,603
346
$59,678
85
$13,252
0
$0
109
$59,831
APPLICATIONS APPROVED, NOT ACCEPTED
18
$68,284
79
$60,388
126
$58,447
59
$12,968
0
$0
24
$74,443
APPLICATIONS DENIED
28
$72,748
232
$63,728
635
$56,646
262
$18,618
2
$176,525
66
$65,297
APPLICATIONS WITHDRAWN
21
$72,060
58
$56,972
341
$57,846
41
$23,445
2
$9,915
22
$53,875
FILES CLOSED FOR INCOMPLETENESS
8
$57,965
19
$46,753
79
$62,888
2
$7,055
0
$0
6
$50,650
Aggregated Statistics For Year 1999 (Based on 4 full and 4 partial tracts)
A) FHA, FSA/RHS & VA Home Purchase Loans
B) Conventional Home Purchase Loans
C) Refinancings
D) Home Improvement Loans
E) Loans on Dwellings For 5+ Families
F) Non-occupant Loans on < 5 Family Dwellings (A B C & D)
2002 - 2018 National Fire Incident Reporting System (NFIRS) incidents
Based on the data from the years 2002 - 2018 the average number of fires per year is 128. The highest number of reported fires - 277 took place in 2002, and the least - 39 in 2014. The data has a decreasing trend.
When looking into fire subcategories, the most reports belonged to: Structure Fires (57.6%), and Outside Fires (25.9%).
Fire incident types reported to NFIRS in Zip Code 01109


 Nearest zip codes: 01104, 01118, 01105, 01119, 01108, 01103.


 Based on the data from the years 2002 - 2018 the average number of fires per year is 128. The highest number of reported fires - 277 took place in 2002, and the least - 39 in 2014. The data has a decreasing trend.
 When looking into fire subcategories, the most reports belonged to: Structure Fires (57.6%), and Outside Fires (25.9%).