Estimated zip code population in 2022: 2,460 Zip code population in 2010: 2,766 Zip code population in 2000: 2,536
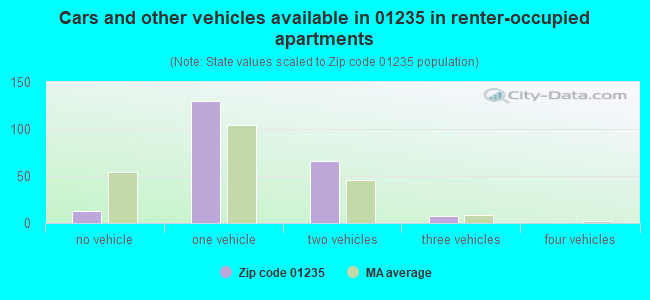
Houses and condos: 1,447 Renter-occupied apartments: 214
% of renters here:
20%
State:
38%
March 2022 cost of living index in zip code 01235: 84.9 (less than average, U.S. average is 100)
Land area: 45.6 sq. mi. Water area: 1.1 sq. mi.
Population density: 54 people per square mile
(very low).
OSM Map
Google Map
MSN Map
OSM Map
General Map
Google Map
MSN Map
OSM Map
Google Map
MSN Map
OSM Map
Google Map
MSN Map
Please wait while loading the map...
Real estate property taxes paid for housing units in 2022:
This zip code:
1.3% ($3,362)
Massachusetts:
1.0% ($5,536)
Median real estate property taxes paid for housing units with mortgages in 2022: $3,663 (1.1%) Median real estate property taxes paid for housing units with no mortgage in 2022: $2,920 (1.6%)
Business Search- 14 Million verified businesses
Males: 1,185
(48.2%)
Females: 1,275
(51.8%)
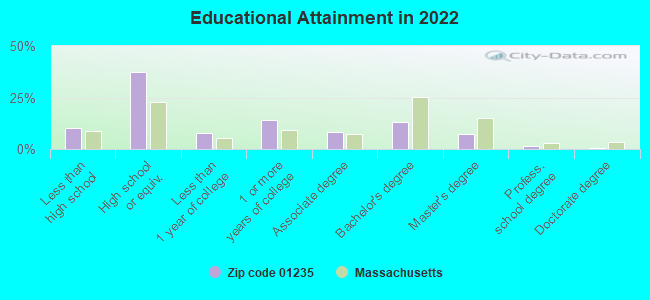
For population 25 years and over in 01235:
High school or higher: 88.6%
Bachelor's degree or higher: 22.5%
Graduate or professional degree: 9.4%
Unemployed: 2.9%
Mean travel time to work (commute): 24.7 minutes
For population 15 years and over in 01235:
Never married: 25.2%
Now married: 52.7%
Separated: 1.3%
Widowed: 5.5%
Divorced: 15.2%
Zip code 01235 compared to state average:
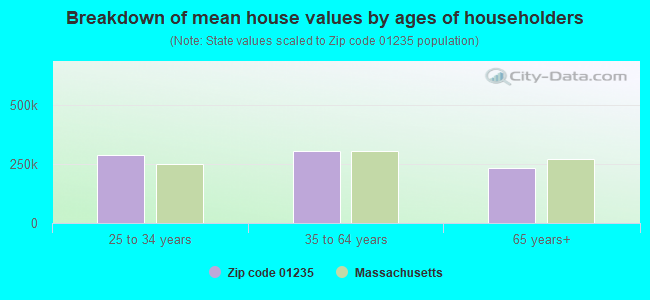
Median house value below state average.
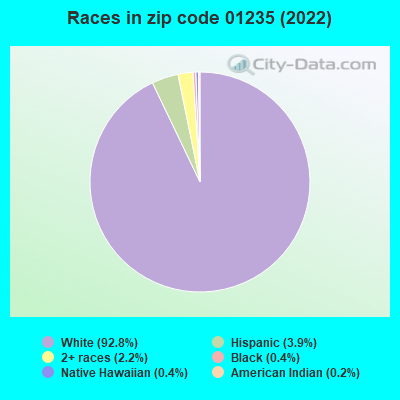
Black race population percentage significantly below state average.
Hispanic race population percentage significantly below state average.
Median age significantly above state average.
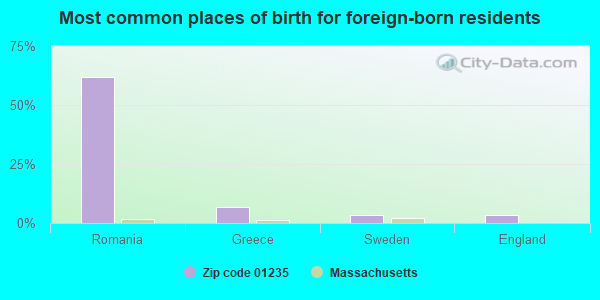
Foreign-born population percentage significantly below state average.
Renting percentage below state average.
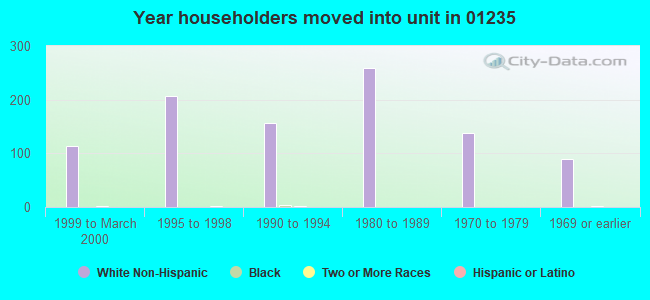
Length of stay since moving in significantly above state average.
Number of college students below state average.
Percentage of population with a bachelor's degree or higher below state average.
Averages for the 2020 tax year for zip code 01235, filed in 2021:
Average Adjusted Gross Income (AGI) in 2020: $74,727 (Individual Income Tax Returns)
Here:
$74,727
State:
$105,130
Salary/wage: $56,843 (reported on 81.8% of returns)
Here:
$56,843
State:
$82,951
(% of AGI for various income ranges: 1108.1% for AGIs below $25k, 3389.0% for AGIs $25k-50k, 6346.1% for AGIs $50k-75k, 8374.5% for AGIs $75k-100k, 17134.0% for AGIs $100k-200k, 62885.0% for AGIs over 200k)
Taxable interest for individuals: $1,206 (reported on 35.1% of returns)
This zip code:
$1,206
Massachusetts:
$2,361
(% of AGI for various income ranges: 17.7% for AGIs below $25k, 23.8% for AGIs $25k-50k, 12.8% for AGIs $50k-75k, 34.5% for AGIs $75k-100k, 124.7% for AGIs $100k-200k, 1440.0% for AGIs over 200k)
Ordinary dividends: $4,031 (reported on 22.7% of returns)
Here:
$4,031
State:
$10,365
(% of AGI for various income ranges: 25.8% for AGIs below $25k, 46.6% for AGIs $25k-50k, 86.1% for AGIs $50k-75k, 150.9% for AGIs $75k-100k, 204.0% for AGIs $100k-200k, 2910.0% for AGIs over 200k)
Net capital gain/loss in AGI: +$23,274 (reported on 17.5% of returns)
Here:
+$23,274
State:
+$48,178
(% of AGI for various income ranges: 45.9% for AGIs $25k-50k, 84.4% for AGIs $50k-75k, 178.2% for AGIs $75k-100k, 346.0% for AGIs $100k-200k, 26435.0% for AGIs over 200k)
Profit/loss from business: +$11,983 (reported on 14.9% of returns)
Here:
+$11,983
State:
+$20,792
(% of AGI for various income ranges: 120.8% for AGIs below $25k, 96.6% for AGIs $25k-50k, 173.3% for AGIs $50k-75k, 293.6% for AGIs $75k-100k, 1018.0% for AGIs $100k-200k)
Taxable individual retirement arrangement distribution: $26,195 (reported on 13.6% of returns)
01235:
$26,195
Massachusetts:
$22,790
(% of AGI for various income ranges: 107.3% for AGIs below $25k, 94.5% for AGIs $25k-50k, 385.0% for AGIs $50k-75k, 548.2% for AGIs $75k-100k, 2434.7% for AGIs $100k-200k)
Total itemized deductions: $27,338 (reported on 8.4% of returns)
Here:
$27,338
State:
$36,722
(% of AGI for various income ranges: 176.5% for AGIs below $25k, 467.2% for AGIs $50k-75k, 653.3% for AGIs $100k-200k, 6370.0% for AGIs over 200k)
Charity contributions: $3,422 (reported on 5.8% of returns)
Here:
$3,422
State:
$12,529
(% of AGI for various income ranges: 35.0% for AGIs $50k-75k, 44.7% for AGIs $100k-200k, 890.0% for AGIs over 200k)
Taxes paid: $8,585 (reported on 8.4% of returns)
01235:
$8,585
State:
$8,782
(% of AGI for various income ranges: 50.8% for AGIs below $25k, 158.9% for AGIs $50k-75k, 233.3% for AGIs $100k-200k, 1740.0% for AGIs over 200k)
Earned income credit: $1,562 (reported on 10.4% of returns)
Here:
$1,562
State:
$1,909
(% of AGI for various income ranges: 60.8% for AGIs below $25k, 31.7% for AGIs $25k-50k)
Percentage of individuals using paid preparers for their 2020 taxes: 90.3%
Here:
90%
State:
92%
(% for various income ranges: 87.8% for AGIs below $25k, 92.1% for AGIs $25k-50k, 88.5% for AGIs $50k-75k, 93.3% for AGIs $75k-100k, 92.6% for AGIs $100k-200k, 85.7% for AGIs over 200k)
Averages for the 2012 tax year for zip code 01235, filed in 2013:
Average Adjusted Gross Income (AGI) in 2012: $53,668 (Individual Income Tax Returns)
Here:
$53,668
State:
$81,425
Salary/wage: $46,820 (reported on 86.1% of returns)
Here:
$46,820
State:
$64,752
(% of AGI for various income ranges: 70.2% for AGIs below $25k, 76.8% for AGIs $25k-50k, 80.6% for AGIs $50k-75k, 78.4% for AGIs $75k-100k, 77.7% for AGIs $100k-200k, 57.7% for AGIs over 200k)
Taxable interest for individuals: $822 (reported on 36.5% of returns)
This zip code:
$822
Massachusetts:
$2,136
(% of AGI for various income ranges: 0.7% for AGIs below $25k, 0.4% for AGIs $25k-50k, 0.5% for AGIs $50k-75k, 0.8% for AGIs $75k-100k, 0.6% for AGIs $100k-200k, 0.4% for AGIs over 200k)
Ordinary dividends: $3,724 (reported on 24.8% of returns)
Here:
$3,724
State:
$9,473
(% of AGI for various income ranges: 2.0% for AGIs below $25k, 1.1% for AGIs $25k-50k, 1.8% for AGIs $50k-75k, 1.7% for AGIs $75k-100k, 2.7% for AGIs $100k-200k)
Net capital gain/loss in AGI: +$3,486 (reported on 15.3% of returns)
Here:
+$3,486
State:
+$31,437
(% of AGI for various income ranges: 0.7% for AGIs $50k-75k, 3.5% for AGIs $100k-200k)
Profit/loss from business: +$9,465 (reported on 14.6% of returns)
Here:
+$9,465
State:
+$20,662
(% of AGI for various income ranges: 5.5% for AGIs below $25k, 3.1% for AGIs $25k-50k, 2.1% for AGIs $50k-75k, 1.9% for AGIs $75k-100k, 3.2% for AGIs $100k-200k)
Taxable individual retirement arrangement distribution: $12,600 (reported on 10.9% of returns)
01235:
$12,600
Massachusetts:
$18,892
(% of AGI for various income ranges: 4.1% for AGIs below $25k, 3.0% for AGIs $25k-50k, 3.5% for AGIs $50k-75k, 3.9% for AGIs $100k-200k)
Total itemized deductions: $18,467 (20% of AGI, reported on 33.6% of returns)
Here:
$18,467
State:
$28,907
Here:
20.2% of AGI
State:
18.2% of AGI
(% of AGI for various income ranges: 7.5% for AGIs below $25k, 9.9% for AGIs $25k-50k, 11.5% for AGIs $50k-75k, 11.3% for AGIs $75k-100k, 13.7% for AGIs $100k-200k, 12.2% for AGIs over 200k)
Charity contributions: $1,661 (reported on 26.3% of returns)
Here:
$1,661
State:
$4,208
(% of AGI for various income ranges: 0.3% for AGIs below $25k, 0.6% for AGIs $25k-50k, 0.8% for AGIs $50k-75k, 0.7% for AGIs $75k-100k, 1.1% for AGIs $100k-200k, 1.0% for AGIs over 200k)
Taxes paid: $8,359 (reported on 33.6% of returns)
01235:
$8,359
State:
$13,303
(% of AGI for various income ranges: 2.6% for AGIs below $25k, 3.4% for AGIs $25k-50k, 4.4% for AGIs $50k-75k, 4.8% for AGIs $75k-100k, 6.7% for AGIs $100k-200k, 8.2% for AGIs over 200k)
Earned income credit: $2,035 (reported on 12.4% of returns)
Here:
$2,035
State:
$1,971
(% of AGI for various income ranges: 4.1% for AGIs below $25k, 0.7% for AGIs $25k-50k)
Percentage of individuals using paid preparers for their 2012 taxes: 53.3%
Here:
53%
State:
56%
(% for various income ranges: 45.8% for AGIs below $25k, 50.0% for AGIs $25k-50k, 60.9% for AGIs $50k-75k, 57.1% for AGIs $75k-100k, 75.0% for AGIs $100k-200k)
Averages for the 2004 tax year for zip code 01235, filed in 2005:
Average Adjusted Gross Income (AGI) in 2004: $44,290 (Individual Income Tax Returns)
Here:
$44,290
State:
$62,877
Salary/wage: $39,662 (reported on 87.4% of returns)
Here:
$39,662
State:
$52,969
(% of AGI for various income ranges: 89.0% for AGIs below $10k, 76.7% for AGIs $10k-25k, 79.5% for AGIs $25k-50k, 85.1% for AGIs $50k-75k, 82.1% for AGIs $75k-100k, 67.2% for AGIs over 100k)
Taxable interest for individuals: $972 (reported on 54.3% of returns)
This zip code:
$972
Massachusetts:
$1,945
(% of AGI for various income ranges: 2.4% for AGIs below $10k, 1.4% for AGIs $10k-25k, 1.2% for AGIs $25k-50k, 1.3% for AGIs $50k-75k, 1.0% for AGIs $75k-100k, 1.1% for AGIs over 100k)
Taxable dividends: $2,096 (reported on 26.6% of returns)
Here:
$2,096
State:
$5,323
(% of AGI for various income ranges: 2.7% for AGIs below $10k, 2.3% for AGIs $10k-25k, 1.3% for AGIs $25k-50k, 0.9% for AGIs $50k-75k, 1.2% for AGIs $75k-100k, 1.1% for AGIs over 100k)
Net capital gain/loss: +$3,985 (reported on 19.7% of returns)
Here:
+$3,985
State:
+$20,377
(% of AGI for various income ranges: 0.3% for AGIs below $10k, -0.2% for AGIs $10k-25k, 0.2% for AGIs $25k-50k, 0.8% for AGIs $50k-75k, 2.2% for AGIs $75k-100k, 4.6% for AGIs over 100k)
Profit/loss from business: +$10,714 (reported on 15.0% of returns)
Here:
+$10,714
State:
+$17,837
(% of AGI for various income ranges: 2.5% for AGIs below $10k, 4.8% for AGIs $10k-25k, 3.6% for AGIs $25k-50k, 2.0% for AGIs $50k-75k, 1.6% for AGIs $75k-100k, 6.5% for AGIs over 100k)
IRA payment deduction: $2,929 (reported on 3.1% of returns)
01235:
$2,929
Massachusetts:
$3,100
Total itemized deductions: $15,203 (20% of AGI, reported on 35.2% of returns)
Here:
$15,203
State:
$22,573
Here:
19.8% of AGI
State:
19.5% of AGI
(% of AGI for various income ranges: 7.9% for AGIs below $10k, 7.0% for AGIs $10k-25k, 10.8% for AGIs $25k-50k, 12.8% for AGIs $50k-75k, 15.4% for AGIs $75k-100k, 12.2% for AGIs over 100k)
Charity contributions deductions: $1,652 (2% of AGI, reported on 31.3% of returns)
Here:
$1,652
State:
$3,295
Here:
2.1% of AGI
State:
2.7% of AGI
(% of AGI for various income ranges: 0.6% for AGIs $10k-25k, 0.9% for AGIs $25k-50k, 0.9% for AGIs $50k-75k, 1.9% for AGIs $75k-100k, 1.4% for AGIs over 100k)
Total tax: $6,107 (reported on 80.6% of returns)
01235:
$6,107
State:
$11,494
(% of AGI for various income ranges: 2.4% for AGIs below $10k, 4.8% for AGIs $10k-25k, 7.6% for AGIs $25k-50k, 9.0% for AGIs $50k-75k, 10.4% for AGIs $75k-100k, 19.9% for AGIs over 100k)
Earned income credit: $1,604 (reported on 10.2% of returns)
Here:
$1,604
State:
$1,518
Percentage of individuals using paid preparers for their 2004 taxes: 52.1%
Here:
52%
State:
58%
(% for various income ranges: 43.3% for AGIs below $10k, 50.8% for AGIs $10k-25k, 56.2% for AGIs $25k-50k, 53.0% for AGIs $50k-75k, 52.2% for AGIs $75k-100k, 61.9% for AGIs over 100k)
Likely homosexual households (counted as self-reported same-sex unmarried-partner households)
Lesbian couples: 0.4% of all households
Gay men: 0.0% of all households
Household received Food Stamps/SNAP in the past 12 months: 198 Household did not receive Food Stamps/SNAP in the past 12 months: 888
Women who had a birth in the past 12 months: 26 (25 now married, 1 unmarried) Women who did not have a birth in the past 12 months: 461 (203 now married, 256 unmarried)
Housing units in zip code 01235 with a mortgage: 450 (122 second mortgage, 124 both second mortgage and home equity loan) Houses without a mortgage: 32
Median monthly owner costs for units with a mortgage: $1,894 Median monthly owner costs for units without a mortgage: $633
Residents with income below the poverty level in 2022:
This zip code:
8.2%
Whole state:
10.4%
Residents with income below 50% of the poverty level in 2022:
This zip code:
6.9%
Whole state:
5.1%
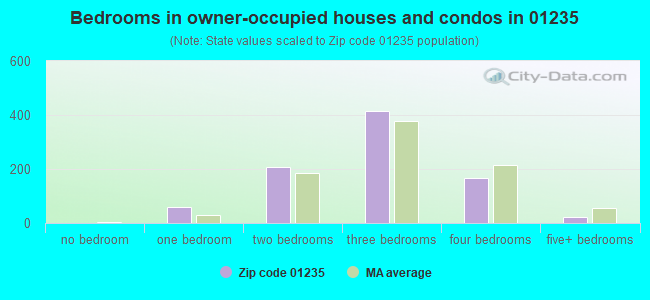
Median number of rooms in houses and condos:
Here:
5.9
State:
6.5
Median number of rooms in apartments:
Here:
3.8
State:
4.0
Notable locations in this zip code not listed on our city pages
Notable locations in zip code 01235: Bas-Ridge Country Club (A), Peru Fire Department (B), Hinsdale Fire Department (C), Hinsdale Public Library (D), Hinsdale Town Hall (E). Display/hide their locations on the map
Lakes and reservoirs: Muddy Pond (A), Tracy Pond (B), Garnet Lake (C), Ashmere Lake (D), Cleveland Brook Reservoir (E), Belmont Reservoir (F), Fernwood Reservoir (G), Plunkett Reservoir (H). Display/hide their locations on the map
Streams, rivers, and creeks: Cone Brook (A), Windsor Brook (B), Trout Brook (C), Tracy Brook (D), Russo Brook (E), Kilburn Brook (F), Frisell Brook (G), Cady Brook (H), Bilodeau Brook (I). Display/hide their locations on the map
Parks in zip code 01235 include: Stritch Sculpture Garden (1), Peru State Wildlife Management Area (2), Frances Rice Wildlife Refuge (3). Display/hide their locations on the map
Size of family households: 444 2-persons, 121 3-persons, 114 4-persons, 30 5-persons, 2 6-persons
Size of nonfamily households: 263 1-person, 101 2-persons, 6 4-persons
263 married couples with children.
58 single-parent households (20 men, 38 women).
95.1% of residents of 01235 zip code speak English at home.
3.4% of residents speak Spanish at home (31% very well, 27% well, 42% not well).
1.3% of residents speak other Indo-European language at home (68% very well, 32% not well).
Foreign born population: 29 (1.2%) (89.8% of them are naturalized citizens)
This zip code:
1.2%
Whole state:
18.0%
62%Romania
7%Greece
3%Sweden
3%England
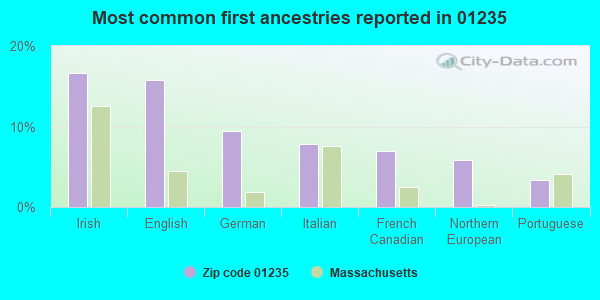
17%Irish
16%English
9%German
8%Italian
7%French Canadian
6%Northern European
3%Portuguese
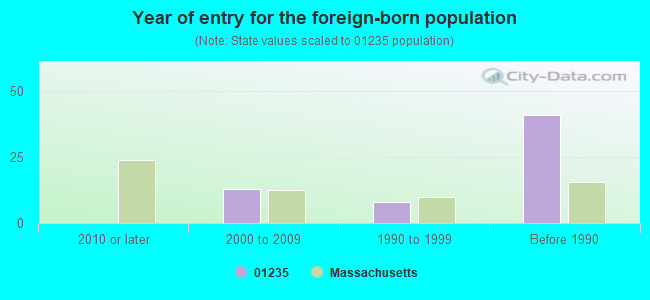
Year of entry for the foreign-born population
02010 or later
132000 to 2009
81990 to 1999
41Before 1990
Facilities with environmental interests located in this zip code:
BISSELVILLE ESTATE (1109 WASHINGTON RD in HINSDALE, MA)
(Integrated Compliance Information System) - ICIS-01-2000-0081, FORMAL ENFORCEMENT ACTION COMMUNITY WATER SYSTEM (SDWIS)
KITTREDGE ELEMETARY SCHOOL (80 MAPLE STREET in HINSDALE, MA)
(National Center for Education Statistics) - STATE ID-635035 Organizations: CENTRAL BERKSHIRE (SCHOOL DISTRICT)
Alternative names: KITTREDGE ELEMENTARY SCHOOL
ASHMERE HEIGHTS APARTMENTS WATER SERVICE (121 YVONNE DR in HINSDALE, MA)
(Integrated Compliance Information System) - ICIS-01-2000-0131, FORMAL ENFORCEMENT ACTION
ASHMERE LAKE NOMINEE (121 HEMLOCK_LN in HINSDALE, MA)
(Integrated Compliance Information System) - ICIS-01-2000-0132, FORMAL ENFORCEMENT ACTION
BELMONT RESERVOIR FILTER PLANT (144 LONGVIEW AVE in HINSDALE, MA)
National Pollutant Discharge Elimination System NON-MAJOR (Tracking pollutant discharge elimination systems) - permit Business SIC classification: WATER SUPPLY Alternative names: HINSDALE WATER DEPARTMENT
DUFOUR BROTHERS (SOUTH ST in HINSDALE, MA)
Conditionally Exempt Small Quantity Generators, less than 100 kg/month of hazardous waste (Resource Conservation and Recovery Act (tracking hazardous waste)) - notification Organizations: DUFOUR BROTHERS INC (CONTACT/OWNER)
Housing units lacking complete plumbing facilities: 1.5% Housing units lacking complete kitchen facilities: 1.3%
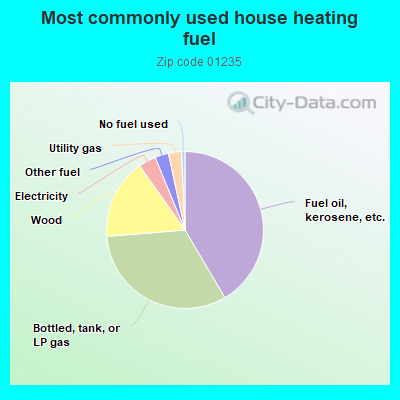
41.7%Fuel oil, kerosene, etc.
32.3%Bottled, tank, or LP gas
16.6%Wood
3.6%Electricity
2.8%Other fuel
2.7%Utility gas
0.7%No fuel used
Population in 1990: 2,559.
Place of birth for U.S.-born residents:
This state: 1,911
Northeast: 281
Midwest: 34
South: 78
West: 70
69% of the 01235 zip code residents lived in the same house 5 years ago. Out of people who lived in different houses, 76% lived in this county. Out of people who lived in different counties, 50% lived in Massachusetts.
98% of the 01235 zip code residents lived in the same house 1 year ago. Out of people who lived in different houses, 28% moved from this county. Out of people who lived in different houses, 28% moved from different county within same state. Out of people who lived in different houses, 56% moved from different state.
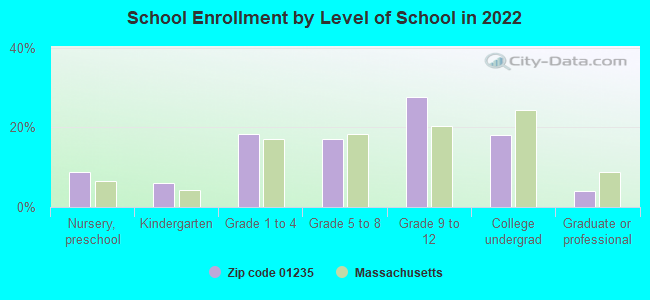
Private vs. public school enrollment:
Students in private schools in grades 1 to 8 (elementary and middle school): 7
Here:
5.8%
Massachusetts:
10.3%
Students in private schools in grades 9 to 12 (high school):
Here:
0.0%
Massachusetts:
12.3%
Students in private undergraduate colleges: 8
Here:
14.4%
Massachusetts:
51.2%
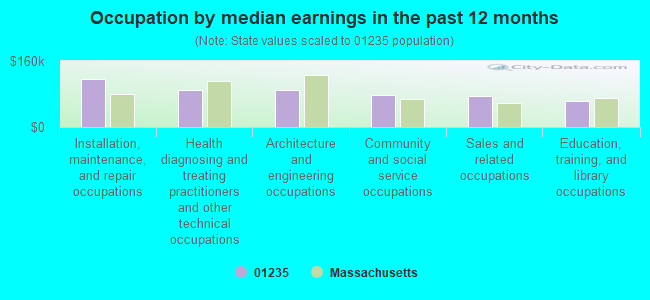
Occupation by median earnings in the past 12 months ($)
115,161Installation, maintenance, and repair occupations
90,742Health diagnosing and treating practitioners and other technical occupations
90,699Architecture and engineering occupations
78,314Community and social service occupations
76,138Sales and related occupations
63,727Education, training, and library occupations
Top industries in this zip code by the number of employees in 2005:
Accommodation and Food Services: Recreational and Vacation Camps (except Campgrounds) (5-9 employees: 2 establishments, 1-4 employees: 1 establishment)
Management of Companies and Enterprises: Corporate, Subsidiary, and Regional Managing Offices (10-19: 1)
Information: Data Processing, Hosting, and Related Services (10-19: 1)
Construction: Residential Remodelers (1-4: 6)
Health Care and Social Assistance: Residential Mental Retardation Facilities (5-9: 1)
Professional, Scientific, and Technical Services: Veterinary Services (5-9: 1)
Administrative and Support and Waste Management and Remediation Services: Other Services to Buildings and Dwellings (5-9: 1)
Fatal accident statistics in 2011:
Fatal accident count: 1
Vehicles involved in fatal accidents: 1
Fatal accidents caused by drunken drivers: 0
Fatalities: 1
Persons involved in fatal accidents: 1
Pedestrians involved in fatal accidents: 0
Home Mortgage Disclosure Act Aggregated Statistics For Year 2009 (Based on 4 partial tracts)
A) FHA, FSA/RHS & VA Home Purchase Loans
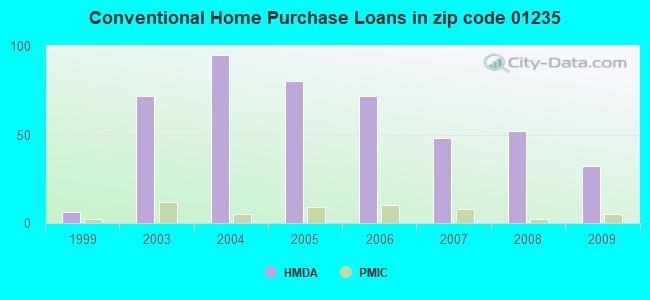
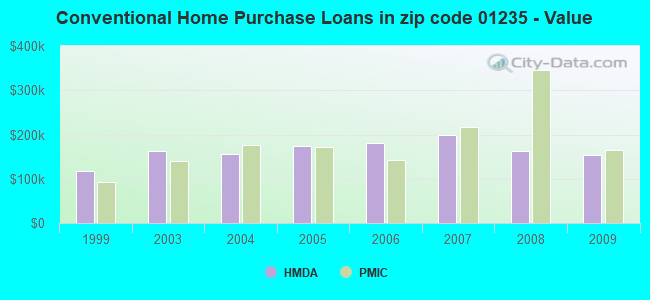
B) Conventional Home Purchase Loans
C) Refinancings
D) Home Improvement Loans
F) Non-occupant Loans on < 5 Family Dwellings (A B C & D)
G) Loans On Manufactured Home Dwelling (A B C & D)
Number
Average Value
Number
Average Value
Number
Average Value
Number
Average Value
Number
Average Value
Number
Average Value
LOANS ORIGINATED
6
$182,233
32
$153,580
138
$179,996
35
$116,649
17
$261,522
8
$26,952
APPLICATIONS APPROVED, NOT ACCEPTED
0
$0
2
$169,790
12
$183,964
0
$0
4
$281,998
0
$0
APPLICATIONS DENIED
1
$74,440
9
$102,634
48
$227,790
9
$140,438
5
$199,696
2
$74,470
APPLICATIONS WITHDRAWN
0
$0
3
$144,823
30
$207,536
4
$243,492
2
$267,635
0
$0
FILES CLOSED FOR INCOMPLETENESS
0
$0
0
$0
8
$140,889
0
$0
0
$0
0
$0
Aggregated Statistics For Year 2008 (Based on 4 partial tracts)
A) FHA, FSA/RHS & VA Home Purchase Loans
B) Conventional Home Purchase Loans
C) Refinancings
D) Home Improvement Loans
F) Non-occupant Loans on < 5 Family Dwellings (A B C & D)
G) Loans On Manufactured Home Dwelling (A B C & D)
Number
Average Value
Number
Average Value
Number
Average Value
Number
Average Value
Number
Average Value
Number
Average Value
LOANS ORIGINATED
2
$196,665
52
$161,841
93
$190,412
19
$74,623
24
$204,394
6
$31,162
APPLICATIONS APPROVED, NOT ACCEPTED
0
$0
1
$234,190
11
$125,442
2
$18,095
2
$94,235
2
$20,355
APPLICATIONS DENIED
0
$0
4
$139,165
40
$198,109
12
$75,758
1
$20,910
4
$15,902
APPLICATIONS WITHDRAWN
0
$0
6
$217,207
22
$208,290
2
$9,800
5
$251,280
1
$46,840
FILES CLOSED FOR INCOMPLETENESS
0
$0
0
$0
4
$290,072
1
$71,090
0
$0
0
$0
Aggregated Statistics For Year 2007 (Based on 4 partial tracts)
A) FHA, FSA/RHS & VA Home Purchase Loans
B) Conventional Home Purchase Loans
C) Refinancings
D) Home Improvement Loans
F) Non-occupant Loans on < 5 Family Dwellings (A B C & D)
G) Loans On Manufactured Home Dwelling (A B C & D)
Number
Average Value
Number
Average Value
Number
Average Value
Number
Average Value
Number
Average Value
Number
Average Value
LOANS ORIGINATED
2
$178,180
48
$198,159
92
$184,785
31
$57,320
18
$258,916
5
$23,824
APPLICATIONS APPROVED, NOT ACCEPTED
0
$0
4
$308,772
17
$129,249
4
$153,202
1
$204,920
0
$0
APPLICATIONS DENIED
0
$0
10
$136,421
53
$168,285
11
$70,247
2
$131,900
4
$39,770
APPLICATIONS WITHDRAWN
0
$0
3
$132,430
21
$192,720
5
$58,748
2
$95,350
0
$0
FILES CLOSED FOR INCOMPLETENESS
0
$0
0
$0
12
$258,753
1
$150,550
0
$0
0
$0
Aggregated Statistics For Year 2006 (Based on 4 partial tracts)
A) FHA, FSA/RHS & VA Home Purchase Loans
B) Conventional Home Purchase Loans
C) Refinancings
D) Home Improvement Loans
E) Loans on Dwellings For 5+ Families
F) Non-occupant Loans on < 5 Family Dwellings (A B C & D)
G) Loans On Manufactured Home Dwelling (A B C & D)
Number
Average Value
Number
Average Value
Number
Average Value
Number
Average Value
Number
Average Value
Number
Average Value
Number
Average Value
LOANS ORIGINATED
1
$302,780
72
$179,892
108
$139,555
38
$68,711
2
$173,395
24
$142,698
2
$37,695
APPLICATIONS APPROVED, NOT ACCEPTED
0
$0
10
$151,356
18
$172,733
3
$66,987
0
$0
3
$102,530
0
$0
APPLICATIONS DENIED
0
$0
10
$120,240
74
$166,299
16
$62,721
0
$0
2
$308,485
4
$53,160
APPLICATIONS WITHDRAWN
0
$0
14
$159,691
69
$179,332
2
$30,155
0
$0
2
$75,275
2
$27,140
FILES CLOSED FOR INCOMPLETENESS
0
$0
0
$0
14
$158,316
0
$0
0
$0
1
$106,220
0
$0
Aggregated Statistics For Year 2005 (Based on 4 partial tracts)
A) FHA, FSA/RHS & VA Home Purchase Loans
B) Conventional Home Purchase Loans
C) Refinancings
D) Home Improvement Loans
E) Loans on Dwellings For 5+ Families
F) Non-occupant Loans on < 5 Family Dwellings (A B C & D)
G) Loans On Manufactured Home Dwelling (A B C & D)
Number
Average Value
Number
Average Value
Number
Average Value
Number
Average Value
Number
Average Value
Number
Average Value
Number
Average Value
LOANS ORIGINATED
2
$97,255
80
$175,034
108
$150,721
28
$72,484
2
$30,155
31
$150,557
8
$50,134
APPLICATIONS APPROVED, NOT ACCEPTED
0
$0
16
$130,652
17
$125,543
5
$53,376
0
$0
5
$100,118
2
$163,325
APPLICATIONS DENIED
2
$59,560
11
$157,194
57
$147,180
17
$103,942
0
$0
4
$144,920
7
$66,083
APPLICATIONS WITHDRAWN
0
$0
20
$140,785
70
$165,444
7
$106,200
0
$0
3
$117,833
2
$127,970
FILES CLOSED FOR INCOMPLETENESS
0
$0
7
$139,607
9
$182,513
1
$25,090
0
$0
2
$181,500
0
$0
Aggregated Statistics For Year 2004 (Based on 4 partial tracts)
A) FHA, FSA/RHS & VA Home Purchase Loans
B) Conventional Home Purchase Loans
C) Refinancings
D) Home Improvement Loans
E) Loans on Dwellings For 5+ Families
F) Non-occupant Loans on < 5 Family Dwellings (A B C & D)
G) Loans On Manufactured Home Dwelling (A B C & D)
Number
Average Value
Number
Average Value
Number
Average Value
Number
Average Value
Number
Average Value
Number
Average Value
Number
Average Value
LOANS ORIGINATED
2
$73,880
95
$156,756
112
$131,262
31
$64,857
2
$135,700
29
$129,765
1
$16,730
APPLICATIONS APPROVED, NOT ACCEPTED
0
$0
13
$202,675
12
$167,905
6
$45,553
0
$0
3
$63,830
0
$0
APPLICATIONS DENIED
0
$0
25
$130,354
53
$108,717
7
$20,357
0
$0
11
$103,096
3
$19,923
APPLICATIONS WITHDRAWN
0
$0
8
$97,090
57
$120,301
3
$83,467
0
$0
6
$46,400
0
$0
FILES CLOSED FOR INCOMPLETENESS
0
$0
5
$154,488
10
$104,169
2
$23,000
0
$0
0
$0
0
$0
Aggregated Statistics For Year 2003 (Based on 2 partial tracts)
B) Conventional Home Purchase Loans
C) Refinancings
D) Home Improvement Loans
E) Loans on Dwellings For 5+ Families
F) Non-occupant Loans on < 5 Family Dwellings (A B C & D)
Number
Average Value
Number
Average Value
Number
Average Value
Number
Average Value
Number
Average Value
LOANS ORIGINATED
72
$163,638
155
$122,424
5
$89,564
3
$472,443
39
$163,964
APPLICATIONS APPROVED, NOT ACCEPTED
5
$177,618
14
$143,672
0
$0
0
$0
0
$0
APPLICATIONS DENIED
2
$113,085
47
$124,827
2
$7,540
0
$0
3
$193,500
APPLICATIONS WITHDRAWN
2
$101,775
44
$156,811
3
$58,803
0
$0
9
$107,891
FILES CLOSED FOR INCOMPLETENESS
0
$0
0
$0
0
$0
0
$0
0
$0
Aggregated Statistics For Year 1999 (Based on 1 partial tract)
B) Conventional Home Purchase Loans
C) Refinancings
D) Home Improvement Loans
F) Non-occupant Loans on < 5 Family Dwellings (A B C & D)
Detailed PMIC statistics for the following Tracts:9314.00
, 9323.00
2002 - 2018 National Fire Incident Reporting System (NFIRS) incidents
Based on the data from the years 2002 - 2018 the average number of fires per year is 7. The highest number of reported fires - 14 took place in 2005, and the least - 0 in 2013. The data has a constant trend.
When looking into fire subcategories, the most incidents belonged to: Structure Fires (67.8%), and Outside Fires (22.3%).
Fire incident types reported to NFIRS in Zip Code 01235


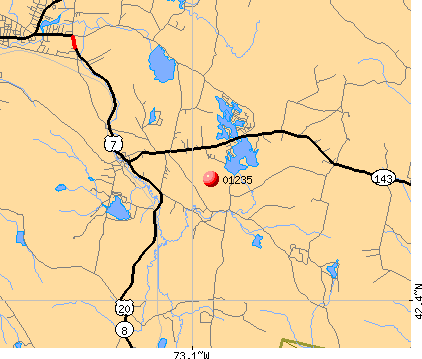 Nearest zip codes: 01243, 01226, 01270, 01098, 01223, 01026.


 Based on the data from the years 2002 - 2018 the average number of fires per year is 7. The highest number of reported fires - 14 took place in 2005, and the least - 0 in 2013. The data has a constant trend.
 When looking into fire subcategories, the most incidents belonged to: Structure Fires (67.8%), and Outside Fires (22.3%).