Estimated zip code population in 2022: 1,889 Zip code population in 2010: 1,701 Zip code population in 2000: 1,880
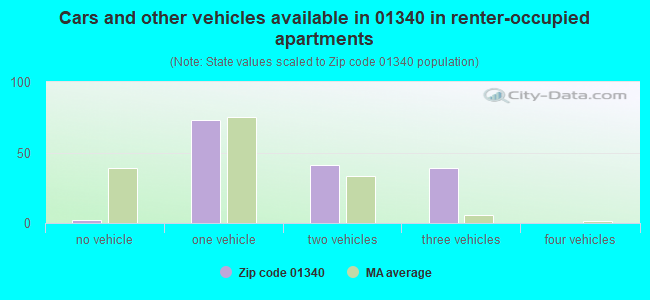
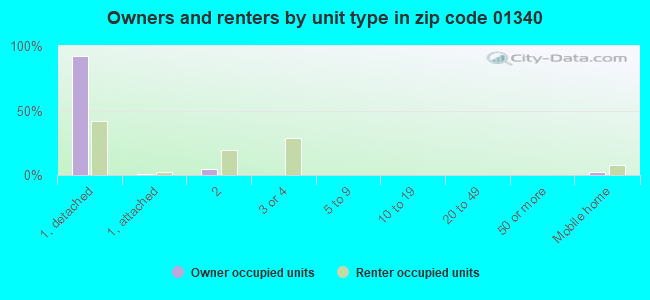
Houses and condos: 1,017 Renter-occupied apartments: 154
% of renters here:
18%
State:
38%
March 2022 cost of living index in zip code 01340: 86.5 (less than average, U.S. average is 100)
Land area: 44.2 sq. mi. Water area: 0.3 sq. mi.
Population density: 43 people per square mile
(very low).
OSM Map
Google Map
MSN Map
OSM Map
General Map
Google Map
MSN Map
OSM Map
Google Map
MSN Map
OSM Map
Google Map
MSN Map
Please wait while loading the map...
Real estate property taxes paid for housing units in 2022:
This zip code:
1.5% ($4,312)
Massachusetts:
1.0% ($5,536)
Median real estate property taxes paid for housing units with mortgages in 2022: $4,251 (1.5%) Median real estate property taxes paid for housing units with no mortgage in 2022: $4,465 (1.6%)
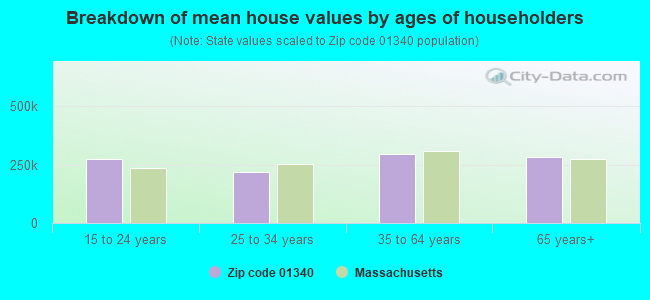
Estimated median house/condo value in 2022: $288,842
01340:
$288,842
Massachusetts:
$534,700
According to our research of Massachusetts and other state lists, there was 1 registered sex offender living in 01340 zip code as of May 28, 2024. The ratio of all residents to sex offenders in zip code 01340 is 1,713 to 1. The ratio of registered sex offenders to all residents in this zip code is near the state average.
Median resident age:
This zip code:
51.4 years
Massachusetts median age:
40.3 years
Average household size:
This zip code:
2.2 people
Massachusetts:
2.4 people
Averages for the 2020 tax year for zip code 01340, filed in 2021:
Average Adjusted Gross Income (AGI) in 2020: $59,529 (Individual Income Tax Returns)
Here:
$59,529
State:
$105,130
Salary/wage: $46,130 (reported on 78.7% of returns)
Here:
$46,130
State:
$82,951
(% of AGI for various income ranges: 1187.1% for AGIs below $25k, 3670.6% for AGIs $25k-50k, 5346.4% for AGIs $50k-75k, 9645.0% for AGIs $75k-100k, 21201.7% for AGIs $100k-200k)
Taxable interest for individuals: $941 (reported on 36.0% of returns)
This zip code:
$941
Massachusetts:
$2,361
(% of AGI for various income ranges: 24.3% for AGIs below $25k, 21.2% for AGIs $25k-50k, 30.0% for AGIs $50k-75k, 93.3% for AGIs $75k-100k, 236.7% for AGIs $100k-200k)
Ordinary dividends: $5,443 (reported on 23.6% of returns)
Here:
$5,443
State:
$10,365
(% of AGI for various income ranges: 61.4% for AGIs below $25k, 151.8% for AGIs $25k-50k, 98.2% for AGIs $50k-75k, 373.3% for AGIs $75k-100k, 778.3% for AGIs $100k-200k)
Net capital gain/loss in AGI: +$9,618 (reported on 19.1% of returns)
Here:
+$9,618
State:
+$48,178
(% of AGI for various income ranges: 40.0% for AGIs below $25k, 49.4% for AGIs $25k-50k, 190.0% for AGIs $50k-75k, 181.7% for AGIs $75k-100k, 1961.7% for AGIs $100k-200k)
Profit/loss from business: +$14,100 (reported on 18.0% of returns)
Here:
+$14,100
State:
+$20,792
(% of AGI for various income ranges: 115.0% for AGIs below $25k, 251.2% for AGIs $25k-50k, 577.3% for AGIs $50k-75k, 1721.7% for AGIs $100k-200k)
Taxable individual retirement arrangement distribution: $12,370 (reported on 11.2% of returns)
01340:
$12,370
Massachusetts:
$22,790
(% of AGI for various income ranges: 86.4% for AGIs below $25k, 146.5% for AGIs $25k-50k, 268.2% for AGIs $50k-75k, 953.3% for AGIs $75k-100k)
Total itemized deductions: $27,800 (reported on 4.5% of returns)
Here:
$27,800
State:
$36,722
(% of AGI for various income ranges: 292.4% for AGIs $25k-50k, 1025.0% for AGIs $75k-100k)
Charity contributions: $3,950 (reported on 2.2% of returns)
Here:
$3,950
State:
$12,529
(% of AGI for various income ranges: 46.5% for AGIs $25k-50k)
Taxes paid: $7,600 (reported on 5.6% of returns)
01340:
$7,600
State:
$8,782
(% of AGI for various income ranges: 102.4% for AGIs $25k-50k, 343.3% for AGIs $75k-100k)
Earned income credit: $1,782 (reported on 12.4% of returns)
Here:
$1,782
State:
$1,909
(% of AGI for various income ranges: 67.1% for AGIs below $25k, 60.0% for AGIs $25k-50k)
Percentage of individuals using paid preparers for their 2020 taxes: 91.0%
Here:
91%
State:
92%
(% for various income ranges: 92.0% for AGIs below $25k, 92.0% for AGIs $25k-50k, 93.3% for AGIs $50k-75k, 90.0% for AGIs $75k-100k, 85.7% for AGIs $100k-200k)
Averages for the 2012 tax year for zip code 01340, filed in 2013:
Average Adjusted Gross Income (AGI) in 2012: $47,425 (Individual Income Tax Returns)
Here:
$47,425
State:
$81,425
Salary/wage: $40,399 (reported on 81.7% of returns)
Here:
$40,399
State:
$64,752
(% of AGI for various income ranges: 67.1% for AGIs below $25k, 76.4% for AGIs $25k-50k, 77.6% for AGIs $50k-75k, 79.5% for AGIs $75k-100k, 55.9% for AGIs $100k-200k)
Taxable interest for individuals: $759 (reported on 39.8% of returns)
This zip code:
$759
Massachusetts:
$2,136
(% of AGI for various income ranges: 2.2% for AGIs below $25k, 0.5% for AGIs $25k-50k, 0.8% for AGIs $50k-75k, 0.2% for AGIs $75k-100k, 0.3% for AGIs $100k-200k)
Ordinary dividends: $4,015 (reported on 21.5% of returns)
Here:
$4,015
State:
$9,473
(% of AGI for various income ranges: 2.2% for AGIs below $25k, 2.9% for AGIs $25k-50k, 1.6% for AGIs $50k-75k, 0.4% for AGIs $75k-100k, 1.8% for AGIs $100k-200k)
Net capital gain/loss in AGI: +$2,186 (reported on 15.1% of returns)
Here:
+$2,186
State:
+$31,437
(% of AGI for various income ranges: 0.6% for AGIs $25k-50k, 0.6% for AGIs $50k-75k, 1.4% for AGIs $100k-200k)
Profit/loss from business: +$12,211 (reported on 20.4% of returns)
Here:
+$12,211
State:
+$20,662
(% of AGI for various income ranges: 11.2% for AGIs below $25k, 6.0% for AGIs $25k-50k, 4.2% for AGIs $50k-75k, 6.2% for AGIs $100k-200k)
Taxable individual retirement arrangement distribution: $13,425 (reported on 8.6% of returns)
01340:
$13,425
Massachusetts:
$18,892
(% of AGI for various income ranges: 4.6% for AGIs below $25k, 2.6% for AGIs $25k-50k, 6.6% for AGIs $50k-75k)
Total itemized deductions: $16,621 (21% of AGI, reported on 30.1% of returns)
Here:
$16,621
State:
$28,907
Here:
20.8% of AGI
State:
18.2% of AGI
(% of AGI for various income ranges: 10.9% for AGIs below $25k, 8.2% for AGIs $25k-50k, 10.6% for AGIs $50k-75k, 9.4% for AGIs $75k-100k, 12.4% for AGIs $100k-200k)
Charity contributions: $1,779 (reported on 20.4% of returns)
Here:
$1,779
State:
$4,208
(% of AGI for various income ranges: 0.8% for AGIs $25k-50k, 0.6% for AGIs $50k-75k, 0.6% for AGIs $75k-100k, 1.2% for AGIs $100k-200k)
Taxes paid: $7,714 (reported on 30.1% of returns)
01340:
$7,714
State:
$13,303
(% of AGI for various income ranges: 3.6% for AGIs below $25k, 3.1% for AGIs $25k-50k, 4.6% for AGIs $50k-75k, 4.3% for AGIs $75k-100k, 7.0% for AGIs $100k-200k)
Earned income credit: $2,017 (reported on 12.9% of returns)
Here:
$2,017
State:
$1,971
(% of AGI for various income ranges: 3.9% for AGIs below $25k, 0.8% for AGIs $25k-50k)
Percentage of individuals using paid preparers for their 2012 taxes: 58.1%
Here:
58%
State:
56%
(% for various income ranges: 52.9% for AGIs below $25k, 57.7% for AGIs $25k-50k, 62.5% for AGIs $50k-75k, 62.5% for AGIs $75k-100k, 66.7% for AGIs $100k-200k)
Averages for the 2004 tax year for zip code 01340, filed in 2005:
Average Adjusted Gross Income (AGI) in 2004: $38,550 (Individual Income Tax Returns)
Here:
$38,550
State:
$62,877
Salary/wage: $35,430 (reported on 80.6% of returns)
Here:
$35,430
State:
$52,969
(% of AGI for various income ranges: 96.2% for AGIs below $10k, 64.9% for AGIs $10k-25k, 80.9% for AGIs $25k-50k, 85.9% for AGIs $50k-75k, 74.2% for AGIs $75k-100k, 53.5% for AGIs over 100k)
Taxable interest for individuals: $1,037 (reported on 51.4% of returns)
This zip code:
$1,037
Massachusetts:
$1,945
(% of AGI for various income ranges: 6.8% for AGIs below $10k, 3.1% for AGIs $10k-25k, 1.6% for AGIs $25k-50k, 0.5% for AGIs $50k-75k, 0.4% for AGIs $75k-100k, 1.7% for AGIs over 100k)
Taxable dividends: $4,849 (reported on 24.6% of returns)
Here:
$4,849
State:
$5,323
(% of AGI for various income ranges: 4.7% for AGIs below $10k, 3.3% for AGIs $10k-25k, 2.0% for AGIs $25k-50k, 0.3% for AGIs $50k-75k, 0.2% for AGIs $75k-100k, 9.7% for AGIs over 100k)
Net capital gain/loss: +$8,276 (reported on 17.3% of returns)
Here:
+$8,276
State:
+$20,377
(% of AGI for various income ranges: 2.0% for AGIs below $10k, 1.4% for AGIs $10k-25k, 0.9% for AGIs $25k-50k, 3.0% for AGIs $50k-75k, 0.1% for AGIs $75k-100k, 12.3% for AGIs over 100k)
Profit/loss from business: +$15,335 (reported on 19.6% of returns)
Here:
+$15,335
State:
+$17,837
(% of AGI for various income ranges: 14.0% for AGIs below $10k, 12.6% for AGIs $10k-25k, 4.7% for AGIs $25k-50k, 3.0% for AGIs $50k-75k, 9.7% for AGIs $75k-100k, 13.0% for AGIs over 100k)
Profit/loss from farming: +$217 (reported on 2.4% of returns)
Here:
+$217
State:
-$2,642
IRA payment deduction: $2,529 (reported on 5.4% of returns)
01340:
$2,529
Massachusetts:
$3,100
Self-employed pension: $7,000 (reported on 1.1% of returns)
Here:
$7,000
Massachusetts:
$14,516
Total itemized deductions: $14,544 (22% of AGI, reported on 29.8% of returns)
Here:
$14,544
State:
$22,573
Here:
21.9% of AGI
State:
19.5% of AGI
(% of AGI for various income ranges: 12.5% for AGIs $10k-25k, 10.7% for AGIs $25k-50k, 12.7% for AGIs $50k-75k, 12.3% for AGIs $75k-100k, 9.8% for AGIs over 100k)
Charity contributions deductions: $1,849 (3% of AGI, reported on 23.8% of returns)
Here:
$1,849
State:
$3,295
Here:
2.6% of AGI
State:
2.7% of AGI
(% of AGI for various income ranges: 0.5% for AGIs $10k-25k, 1.2% for AGIs $25k-50k, 1.2% for AGIs $50k-75k, 1.3% for AGIs $75k-100k, 1.2% for AGIs over 100k)
Total tax: $4,972 (reported on 79.2% of returns)
01340:
$4,972
State:
$11,494
(% of AGI for various income ranges: 6.4% for AGIs below $10k, 5.7% for AGIs $10k-25k, 7.3% for AGIs $25k-50k, 7.8% for AGIs $50k-75k, 11.6% for AGIs $75k-100k, 18.3% for AGIs over 100k)
Earned income credit: $1,395 (reported on 12.1% of returns)
Here:
$1,395
State:
$1,518
Percentage of individuals using paid preparers for their 2004 taxes: 61.0%
Here:
61%
State:
58%
(% for various income ranges: 50.5% for AGIs below $10k, 59.3% for AGIs $10k-25k, 62.5% for AGIs $25k-50k, 68.0% for AGIs $50k-75k, 69.1% for AGIs $75k-100k, 72.1% for AGIs over 100k)
Likely homosexual households (counted as self-reported same-sex unmarried-partner households)
Lesbian couples: 0.0% of all households
Gay men: 0.5% of all households
Household received Food Stamps/SNAP in the past 12 months: 131 Household did not receive Food Stamps/SNAP in the past 12 months: 720
Women who had a birth in the past 12 months: 14 (15 now married, 0 unmarried) Women who did not have a birth in the past 12 months: 305 (108 now married, 198 unmarried)
Housing units in zip code 01340 with a mortgage: 385 (53 second mortgage, 2 home equity loan, 39 both second mortgage and home equity loan) Houses without a mortgage: 8
Median monthly owner costs for units with a mortgage: $1,608 Median monthly owner costs for units without a mortgage: $745
Residents with income below the poverty level in 2022:
This zip code:
7.4%
Whole state:
10.4%
Residents with income below 50% of the poverty level in 2022:
This zip code:
4.0%
Whole state:
5.1%
Median number of rooms in houses and condos:
Here:
6.3
State:
6.5
Median number of rooms in apartments:
Here:
4.1
State:
4.0
Notable locations in this zip code not listed on our city pages
Cemeteries: Cristian Hill (1), North River Cemetery (2), Branch Cemetery (3), Chandler Hill Cemetery (4), Brick School Cemetery (5). Display/hide their locations on the map
Streams, rivers, and creeks: Taylor Brook (A), East Branch North River (B), Fox Brook (C), Foundry Brook (D), Creamery Brook (E), Cary Brook (F), Browning Brook (G), Borden Brook (H), West Branch North River (I). Display/hide their locations on the map
Size of family households: 375 2-persons, 110 3-persons, 72 4-persons, 39 5-persons, 2 6-persons, 2 7-or-more-persons
Size of nonfamily households: 169 1-person, 79 2-persons, 2 4-persons
166 married couples with children.
69 single-parent households (19 men, 50 women).
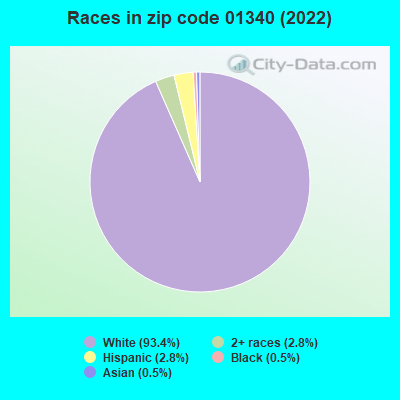
96.6% of residents of 01340 zip code speak English at home.
1.4% of residents speak Spanish at home (100% very well).
1.2% of residents speak other Indo-European language at home (100% very well).
0.4% of residents speak Asian or Pacific Island language at home (100% very well).
0.6% of residents speak other language at home (100% very well).
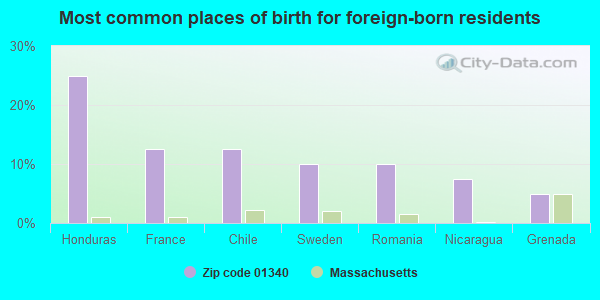
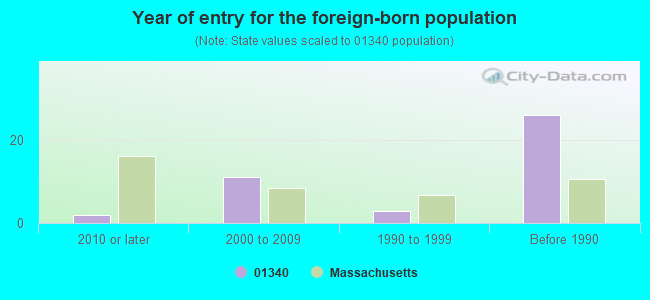
Foreign born population: 40 (2.1%) (92.4% of them are naturalized citizens)
This zip code:
2.1%
Whole state:
18.0%
25%Honduras
12%France
12%Chile
10%Sweden
10%Romania
8%Nicaragua
5%Grenada
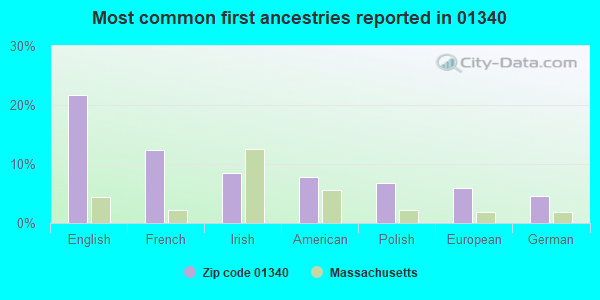
22%English
12%French
8%Irish
8%American
7%Polish
6%European
5%German
Year of entry for the foreign-born population
22010 or later
112000 to 2009
31990 to 1999
26Before 1990
Facilities with environmental interests located in this zip code:
BBA NONWOVENS SIMPSONVILLE INC (247 MAIN ROAD in COLRAIN, MA)
AIR MINOR (AIRS/AFS) CRITERIA AND HAZARDOUS AIR POLLUTANT INVENTORY (Inventory of air pollution sources) National Pollutant Discharge Elimination System MAJOR (Tracking pollutant discharge elimination systems) - permit - ICIS-, ENFORCEMENT/COMPLIANCE ACTIVITY Conditionally Exempt Small Quantity Generators, less than 100 kg/month of hazardous waste (Resource Conservation and Recovery Act (tracking hazardous waste)) - notification TRI REPORTER (Tracking of toxic chemicals releasing facilities) Business SIC classification: FINISHERS OF TEXTILES; NONCLASSIFIABLE ESTABLISHMENTS Organizations: BBA U.S. NONWOVENS (CONTACT/OWNER)
, VERATIC DIVISION OF INTERNATION PAPER (CONTACT/OWNER)
Alternative names: B B A NONWOVENS SIMPSONVILLE INC, BBA NONWOVENS SIMPSONVILLE INC. GRISWOLD PLANT, VERATEC
COLRAIN CENTRAL (22 JACKSONVILLE RD in COLRAIN, MA)
(National Center for Education Statistics) - STATE ID-717010 Organizations: MOHAWK TRAIL (SCHOOL DISTRICT)
AMERICAN FIBER & FINISHING INC (237 MAIN ROAD (ROUTE 112) in COLRAIN, MA)
AIR SYNTHETIC MINOR (AIRS/AFS) (Resource Conservation and Recovery Act (tracking hazardous waste)) TRI REPORTER (Tracking of toxic chemicals releasing facilities) Business SIC classification: BROADWOVEN FABRIC MILLS, COTTON; FINISHERS OF BROADWOVEN FABRICS OF COTTON Alternative names: AMERICAN FIBER & FINISHING MILL
COLRAIN FD #1 (9 RIVER ST in COLRAIN, MA)
(Integrated Compliance Information System) - ICIS-01-2001-0077, FORMAL ENFORCEMENT ACTION
BOSTLEY SANITARY SERVICE INC (NELSON RD in COLRAIN, MA)
(Resource Conservation and Recovery Act (tracking hazardous waste)) Organizations: MAURICE BEAUSOLEIL (CONTACT/OWNER)
COLRAIN TRANSFER STATION (CHARLEMONT ROAD AND ROUTE 112 in COLRAIN, MA)
CRITERIA AND HAZARDOUS AIR POLLUTANT INVENTORY (Inventory of air pollution sources) Conditionally Exempt Small Quantity Generators, less than 100 kg/month of hazardous waste (Resource Conservation and Recovery Act (tracking hazardous waste)) - notification Business SIC classification: REFUSE SYSTEMS Business NAICS classification: SOLID WASTE LANDFILL. Organizations: COLRAIN TOWN OF TRANSFER STATION (CONTACT/OPERATOR)
, BU & PR: TOWN OF COLRAIN (CONTACT/OWNER)
Alternative names: COLRAIN TOWN OF, COLRAIN TOWN OF TRANSFER STATION
COLRAIN (P.O. BOX 31 in COLRAIN, MA)
AIR MINOR (AIRS/AFS) Business SIC classification: GENERAL GOVERNMENT
Housing units lacking complete plumbing facilities: 5.9% Housing units lacking complete kitchen facilities: 5.9%
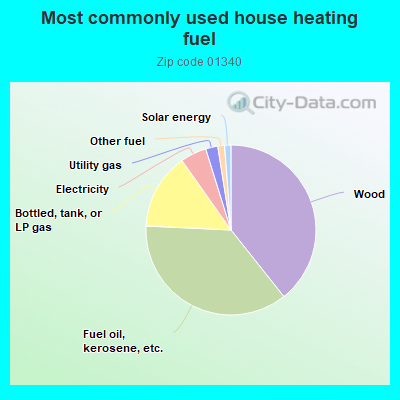
39.4%Wood
36.5%Fuel oil, kerosene, etc.
14.5%Bottled, tank, or LP gas
5.0%Electricity
2.3%Utility gas
1.3%Other fuel
1.2%Solar energy
Population in 1990: 2,050.
Place of birth for U.S.-born residents:
This state: 1,324
Northeast: 352
Midwest: 56
South: 54
West: 45
73% of the 01340 zip code residents lived in the same house 5 years ago. Out of people who lived in different houses, 74% lived in this county. Out of people who lived in different counties, 50% lived in Massachusetts.
90% of the 01340 zip code residents lived in the same house 1 year ago. Out of people who lived in different houses, 62% moved from this county. Out of people who lived in different houses, 13% moved from different county within same state. Out of people who lived in different houses, 17% moved from different state. Out of people who lived in different houses, 2% moved from abroad.
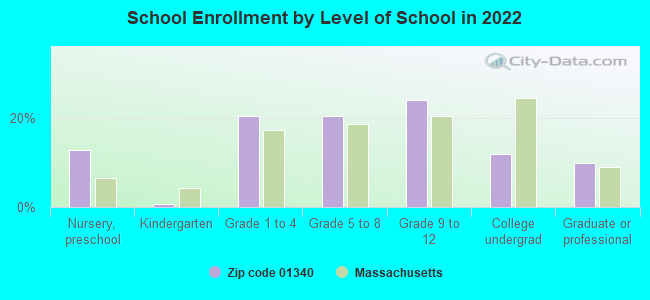
Private vs. public school enrollment:
Students in private schools in grades 1 to 8 (elementary and middle school): 12
Here:
10.2%
Massachusetts:
10.3%
Students in private schools in grades 9 to 12 (high school): 7
Here:
9.7%
Massachusetts:
12.3%
Students in private undergraduate colleges: 14
Here:
38.9%
Massachusetts:
51.2%
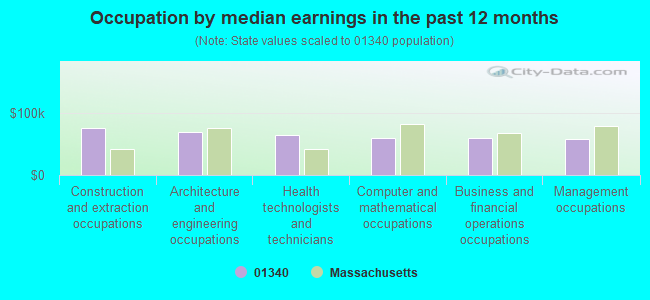
Occupation by median earnings in the past 12 months ($)
75,826Construction and extraction occupations
68,776Architecture and engineering occupations
63,896Health technologists and technicians
59,916Computer and mathematical occupations
59,663Business and financial operations occupations
58,439Management occupations
Top industries in this zip code by the number of employees in 2005:
Accommodation and Food Services: Limited-Service Restaurants (10-19 employees: 1 establishment)
Professional, Scientific, and Technical Services: Architectural Services (5-9: 1)
Administrative and Support and Waste Management and Remediation Services: Septic Tank and Related Services (5-9: 1)
Construction: Drywall and Insulation Contractors (1-4: 2)
Construction: Residential Remodelers (1-4: 1)
Home Mortgage Disclosure Act Aggregated Statistics For Year 2009 (Based on 2 partial tracts)
A) FHA, FSA/RHS & VA Home Purchase Loans
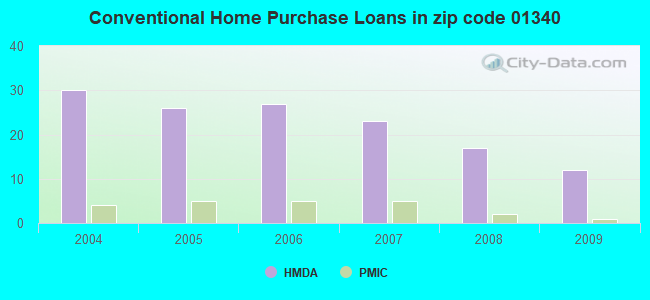
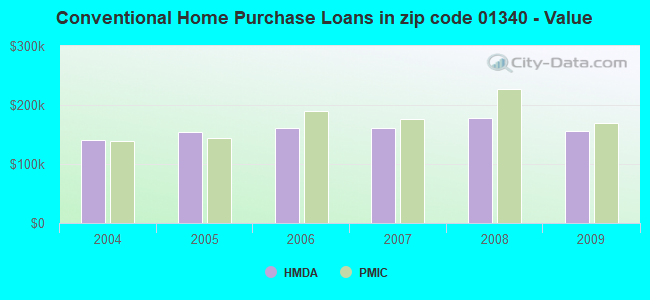
B) Conventional Home Purchase Loans
C) Refinancings
D) Home Improvement Loans
F) Non-occupant Loans on < 5 Family Dwellings (A B C & D)
G) Loans On Manufactured Home Dwelling (A B C & D)
Number
Average Value
Number
Average Value
Number
Average Value
Number
Average Value
Number
Average Value
Number
Average Value
LOANS ORIGINATED
2
$136,730
12
$155,117
59
$159,321
9
$110,508
5
$216,564
0
$0
APPLICATIONS APPROVED, NOT ACCEPTED
0
$0
2
$348,070
4
$187,970
2
$52,255
1
$475,510
0
$0
APPLICATIONS DENIED
1
$106,250
1
$145,730
18
$177,954
5
$74,316
1
$123,670
1
$96,960
APPLICATIONS WITHDRAWN
0
$0
2
$274,335
15
$170,271
0
$0
2
$263,590
0
$0
FILES CLOSED FOR INCOMPLETENESS
0
$0
0
$0
6
$203,017
1
$17,420
0
$0
0
$0
Aggregated Statistics For Year 2008 (Based on 2 partial tracts)
A) FHA, FSA/RHS & VA Home Purchase Loans
B) Conventional Home Purchase Loans
C) Refinancings
D) Home Improvement Loans
F) Non-occupant Loans on < 5 Family Dwellings (A B C & D)
G) Loans On Manufactured Home Dwelling (A B C & D)
Number
Average Value
Number
Average Value
Number
Average Value
Number
Average Value
Number
Average Value
Number
Average Value
LOANS ORIGINATED
4
$139,345
17
$178,415
39
$131,573
17
$73,497
8
$141,304
1
$38,900
APPLICATIONS APPROVED, NOT ACCEPTED
1
$154,440
2
$113,800
3
$124,443
1
$209,020
1
$64,450
1
$23,800
APPLICATIONS DENIED
1
$188,690
2
$55,155
20
$183,382
9
$96,316
2
$197,695
1
$54,580
APPLICATIONS WITHDRAWN
0
$0
0
$0
9
$154,504
1
$220,050
1
$145,150
0
$0
FILES CLOSED FOR INCOMPLETENESS
0
$0
0
$0
2
$103,055
1
$11,610
0
$0
0
$0
Aggregated Statistics For Year 2007 (Based on 2 partial tracts)
A) FHA, FSA/RHS & VA Home Purchase Loans
B) Conventional Home Purchase Loans
C) Refinancings
D) Home Improvement Loans
F) Non-occupant Loans on < 5 Family Dwellings (A B C & D)
G) Loans On Manufactured Home Dwelling (A B C & D)
Number
Average Value
Number
Average Value
Number
Average Value
Number
Average Value
Number
Average Value
Number
Average Value
LOANS ORIGINATED
2
$153,280
23
$160,750
49
$123,964
17
$65,164
8
$154,295
2
$126,860
APPLICATIONS APPROVED, NOT ACCEPTED
1
$125,410
1
$136,440
6
$178,342
2
$66,190
0
$0
0
$0
APPLICATIONS DENIED
0
$0
5
$183,934
37
$124,594
7
$70,087
3
$106,830
1
$55,160
APPLICATIONS WITHDRAWN
0
$0
2
$201,760
12
$162,132
0
$0
1
$232,240
1
$62,120
FILES CLOSED FOR INCOMPLETENESS
0
$0
1
$150,960
5
$226,782
0
$0
1
$74,900
0
$0
Aggregated Statistics For Year 2006 (Based on 2 partial tracts)
A) FHA, FSA/RHS & VA Home Purchase Loans
B) Conventional Home Purchase Loans
C) Refinancings
D) Home Improvement Loans
E) Loans on Dwellings For 5+ Families
F) Non-occupant Loans on < 5 Family Dwellings (A B C & D)
G) Loans On Manufactured Home Dwelling (A B C & D)
Number
Average Value
Number
Average Value
Number
Average Value
Number
Average Value
Number
Average Value
Number
Average Value
Number
Average Value
LOANS ORIGINATED
2
$178,245
27
$161,385
55
$123,045
21
$67,516
1
$156,760
10
$152,466
2
$19,450
APPLICATIONS APPROVED, NOT ACCEPTED
0
$0
7
$122,174
16
$141,340
2
$96,960
0
$0
3
$99,863
0
$0
APPLICATIONS DENIED
1
$138,180
9
$158,633
43
$156,154
16
$96,706
0
$0
2
$103,635
4
$56,028
APPLICATIONS WITHDRAWN
0
$0
3
$150,570
26
$181,237
2
$88,540
0
$0
1
$62,120
0
$0
FILES CLOSED FOR INCOMPLETENESS
0
$0
1
$760,590
10
$174,993
0
$0
0
$0
1
$34,840
0
$0
Aggregated Statistics For Year 2005 (Based on 2 partial tracts)
A) FHA, FSA/RHS & VA Home Purchase Loans
B) Conventional Home Purchase Loans
C) Refinancings
D) Home Improvement Loans
F) Non-occupant Loans on < 5 Family Dwellings (A B C & D)
G) Loans On Manufactured Home Dwelling (A B C & D)
Number
Average Value
Number
Average Value
Number
Average Value
Number
Average Value
Number
Average Value
Number
Average Value
LOANS ORIGINATED
1
$204,370
26
$154,462
76
$127,121
23
$75,074
6
$207,372
2
$38,320
APPLICATIONS APPROVED, NOT ACCEPTED
0
$0
4
$147,472
10
$134,061
3
$46,447
2
$164,310
0
$0
APPLICATIONS DENIED
0
$0
5
$126,106
49
$115,954
10
$103,173
1
$74,320
1
$75,480
APPLICATIONS WITHDRAWN
0
$0
8
$120,692
39
$151,135
3
$143,407
3
$184,823
2
$78,670
FILES CLOSED FOR INCOMPLETENESS
0
$0
3
$109,540
5
$132,028
1
$5,810
1
$105,670
0
$0
Aggregated Statistics For Year 2004 (Based on 2 partial tracts)
A) FHA, FSA/RHS & VA Home Purchase Loans
B) Conventional Home Purchase Loans
C) Refinancings
D) Home Improvement Loans
E) Loans on Dwellings For 5+ Families
F) Non-occupant Loans on < 5 Family Dwellings (A B C & D)
G) Loans On Manufactured Home Dwelling (A B C & D)
Detailed PMIC statistics for the following Tracts:0401.00
2002 - 2018 National Fire Incident Reporting System (NFIRS) incidents
Based on the data from the years 2002 - 2018 the average number of fires per year is 17. The highest number of fires - 37 took place in 2012, and the least - 2 in 2008. The data has a dropping trend.
When looking into fire subcategories, the most incidents belonged to: Structure Fires (59.5%), and Outside Fires (30.7%).
Fire incident types reported to NFIRS in Zip Code 01340


+$217
-$2,642
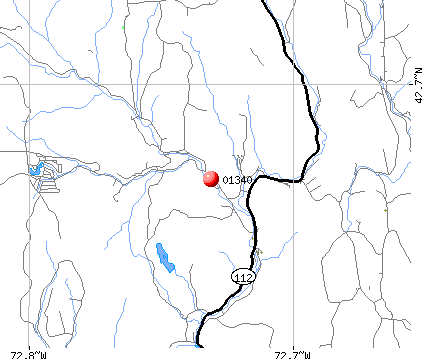 Nearest zip codes: 05358, 01370, 01346, 05342, 01301, 01337.


 Based on the data from the years 2002 - 2018 the average number of fires per year is 17. The highest number of fires - 37 took place in 2012, and the least - 2 in 2008. The data has a dropping trend.
 When looking into fire subcategories, the most incidents belonged to: Structure Fires (59.5%), and Outside Fires (30.7%).