Estimated zip code population in 2022: 763 Zip code population in 2010: 1,091 Zip code population in 2000: 1,613
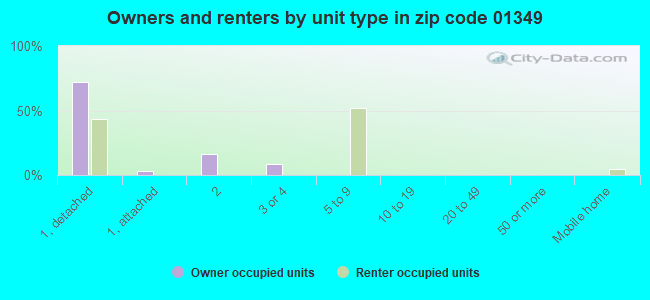
Houses and condos: 374 Renter-occupied apartments: 70
% of renters here:
20%
State:
38%
March 2022 cost of living index in zip code 01349: 107.6 (more than average, U.S. average is 100)
Land area: 7.7 sq. mi. Water area: 0.2 sq. mi.
Population density: 99 people per square mile
(very low).
OSM Map
Google Map
MSN Map
OSM Map
General Map
Google Map
MSN Map
OSM Map
Google Map
MSN Map
OSM Map
Google Map
MSN Map
Please wait while loading the map...
Real estate property taxes paid for housing units in 2022:
This zip code:
1.0% ($3,262)
Massachusetts:
1.0% ($5,536)
Median real estate property taxes paid for housing units with mortgages in 2022: $2,917 (0.9%) Median real estate property taxes paid for housing units with no mortgage in 2022: $3,428 (1.3%)
Business Search- 14 Million verified businesses
Males: 372
(48.7%)
Females: 391
(51.3%)
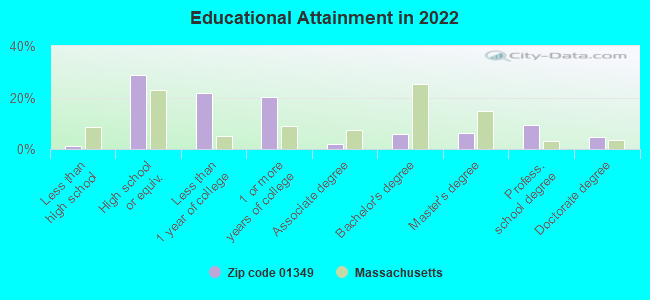
For population 25 years and over in 01349:
High school or higher: 98.5%
Bachelor's degree or higher: 26.0%
Graduate or professional degree: 20.2%
Unemployed: 1.6%
Mean travel time to work (commute): 20.9 minutes
For population 15 years and over in 01349:
Never married: 21.8%
Now married: 58.1%
Separated: 2.0%
Widowed: 0.7%
Divorced: 17.4%
Zip code 01349 compared to state average:
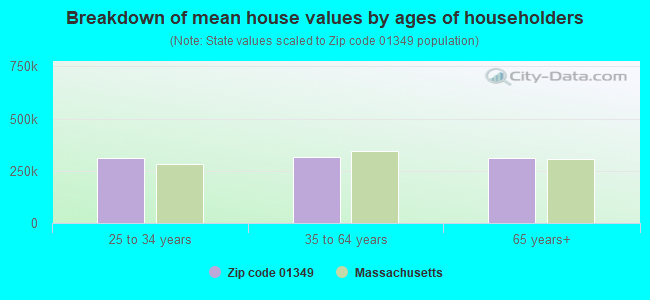
Median house value below state average.
Unemployed percentage below state average.
Black race population percentage significantly below state average.
Hispanic race population percentage significantly below state average.
Foreign-born population percentage significantly below state average.
Renting percentage below state average.
Length of stay since moving in significantly above state average.
Percentage of population with a bachelor's degree or higher below state average.
Averages for the 2020 tax year for zip code 01349, filed in 2021:
Average Adjusted Gross Income (AGI) in 2020: $51,795 (Individual Income Tax Returns)
Here:
$51,795
State:
$105,130
Salary/wage: $43,663 (reported on 88.4% of returns)
Here:
$43,663
State:
$82,951
(% of AGI for various income ranges: 1192.5% for AGIs below $25k, 3590.9% for AGIs $25k-50k, 7550.0% for AGIs $50k-75k, 7376.0% for AGIs $75k-100k)
Taxable interest for individuals: $342 (reported on 27.9% of returns)
This zip code:
$342
Massachusetts:
$2,361
(% of AGI for various income ranges: 3.8% for AGIs below $25k, 12.7% for AGIs $25k-50k, 42.0% for AGIs $50k-75k)
Ordinary dividends: $1,583 (reported on 14.0% of returns)
Here:
$1,583
State:
$10,365
(% of AGI for various income ranges: 41.2% for AGIs below $25k, 124.0% for AGIs $50k-75k)
Net capital gain/loss in AGI: +$6,580 (reported on 11.6% of returns)
Here:
+$6,580
State:
+$48,178
(% of AGI for various income ranges: 14.5% for AGIs $25k-50k, 626.0% for AGIs $75k-100k)
Profit/loss from business: +$10,000 (reported on 9.3% of returns)
Here:
+$10,000
State:
+$20,792
(% of AGI for various income ranges: 800.0% for AGIs $50k-75k)
Taxable individual retirement arrangement distribution: $8,125 (reported on 9.3% of returns)
01349:
$8,125
Massachusetts:
$22,790
(% of AGI for various income ranges: 295.5% for AGIs $25k-50k)
Total itemized deductions: $19,300 (reported on 4.7% of returns)
Here:
$19,300
State:
$36,722
(% of AGI for various income ranges: 350.9% for AGIs $25k-50k)
Taxes paid: $8,600 (reported on 4.7% of returns)
01349:
$8,600
State:
$8,782
(% of AGI for various income ranges: 156.4% for AGIs $25k-50k)
Earned income credit: $1,800 (reported on 11.6% of returns)
Here:
$1,800
State:
$1,909
(% of AGI for various income ranges: 112.5% for AGIs below $25k)
Percentage of individuals using paid preparers for their 2020 taxes: 90.7%
Here:
91%
State:
92%
(% for various income ranges: 91.7% for AGIs below $25k, 92.3% for AGIs $25k-50k, 87.5% for AGIs $50k-75k, 100.0% for AGIs $75k-100k, 80.0% for AGIs $100k-200k)
Averages for the 2012 tax year for zip code 01349, filed in 2013:
Average Adjusted Gross Income (AGI) in 2012: $41,737 (Individual Income Tax Returns)
Here:
$41,737
State:
$81,425
Salary/wage: $38,400 (reported on 85.4% of returns)
Here:
$38,400
State:
$64,752
(% of AGI for various income ranges: 76.1% for AGIs below $25k, 83.2% for AGIs $25k-50k, 84.3% for AGIs $50k-75k, 91.1% for AGIs $75k-100k, 60.5% for AGIs $100k-200k)
Taxable interest for individuals: $364 (reported on 34.1% of returns)
This zip code:
$364
Massachusetts:
$2,136
(% of AGI for various income ranges: 1.1% for AGIs below $25k, 0.5% for AGIs $25k-50k, 0.2% for AGIs $75k-100k)
Ordinary dividends: $580 (reported on 12.2% of returns)
Here:
$580
State:
$9,473
Net capital gain/loss in AGI: +$2,167 (reported on 7.3% of returns)
Here:
+$2,167
State:
+$31,437
Profit/loss from business: +$7,017 (reported on 14.6% of returns)
Here:
+$7,017
State:
+$20,662
Taxable individual retirement arrangement distribution: $4,650 (reported on 4.9% of returns)
01349:
$4,650
Massachusetts:
$18,892
Total itemized deductions: $15,480 (20% of AGI, reported on 24.4% of returns)
Here:
$15,480
State:
$28,907
Here:
20.0% of AGI
State:
18.2% of AGI
(% of AGI for various income ranges: 10.8% for AGIs $25k-50k, 9.6% for AGIs $50k-75k, 25.2% for AGIs $75k-100k)
Charity contributions: $840 (reported on 12.2% of returns)
Here:
$840
State:
$4,208
Taxes paid: $7,120 (reported on 24.4% of returns)
01349:
$7,120
State:
$13,303
(% of AGI for various income ranges: 4.2% for AGIs $25k-50k, 4.4% for AGIs $50k-75k, 12.9% for AGIs $75k-100k)
Earned income credit: $2,229 (reported on 17.1% of returns)
Here:
$2,229
State:
$1,971
(% of AGI for various income ranges: 7.1% for AGIs below $25k)
Percentage of individuals using paid preparers for their 2012 taxes: 46.3%
Here:
46%
State:
56%
(% for various income ranges: 43.8% for AGIs below $25k, 46.2% for AGIs $25k-50k, 50.0% for AGIs $50k-75k, 100.0% for AGIs $75k-100k)
Averages for the 2004 tax year for zip code 01349, filed in 2005:
Average Adjusted Gross Income (AGI) in 2004: $35,175 (Individual Income Tax Returns)
Here:
$35,175
State:
$62,877
Salary/wage: $33,774 (reported on 88.4% of returns)
Here:
$33,774
State:
$52,969
(% of AGI for various income ranges: 87.0% for AGIs below $10k, 76.6% for AGIs $10k-25k, 79.2% for AGIs $25k-50k, 91.1% for AGIs $50k-75k, 91.1% for AGIs $75k-100k, 91.7% for AGIs over 100k)
Taxable interest for individuals: $764 (reported on 48.0% of returns)
This zip code:
$764
Massachusetts:
$1,945
(% of AGI for various income ranges: 5.3% for AGIs below $10k, 2.6% for AGIs $10k-25k, 1.3% for AGIs $25k-50k, 0.6% for AGIs $50k-75k, 0.2% for AGIs $75k-100k)
Taxable dividends: $914 (reported on 20.0% of returns)
Here:
$914
State:
$5,323
(% of AGI for various income ranges: 11.2% for AGIs below $10k, 1.7% for AGIs $10k-25k, 0.3% for AGIs $25k-50k, 0.2% for AGIs $50k-75k)
Profit/loss from business: +$5,362 (reported on 11.6% of returns)
Here:
+$5,362
State:
+$17,837
IRA payment deduction: $2,273 (reported on 2.7% of returns)
01349:
$2,273
Massachusetts:
$3,100
Total itemized deductions: $12,703 (24% of AGI, reported on 31.5% of returns)
Here:
$12,703
State:
$22,573
Here:
23.5% of AGI
State:
19.5% of AGI
(% of AGI for various income ranges: 9.6% for AGIs $10k-25k, 13.4% for AGIs $25k-50k, 8.9% for AGIs $50k-75k, 11.9% for AGIs $75k-100k, 14.0% for AGIs over 100k)
Charity contributions deductions: $770 (1% of AGI, reported on 24.6% of returns)
Here:
$770
State:
$3,295
Here:
1.4% of AGI
State:
2.7% of AGI
(% of AGI for various income ranges: 0.6% for AGIs $10k-25k, 0.5% for AGIs $25k-50k, 0.5% for AGIs $50k-75k, 1.0% for AGIs $75k-100k)
Total tax: $3,991 (reported on 78.3% of returns)
01349:
$3,991
State:
$11,494
(% of AGI for various income ranges: 1.2% for AGIs below $10k, 5.4% for AGIs $10k-25k, 6.8% for AGIs $25k-50k, 9.9% for AGIs $50k-75k, 12.1% for AGIs $75k-100k, 14.8% for AGIs over 100k)
Earned income credit: $1,315 (reported on 13.3% of returns)
Here:
$1,315
State:
$1,518
Percentage of individuals using paid preparers for their 2004 taxes: 53.0%
Here:
53%
State:
58%
(% for various income ranges: 35.8% for AGIs below $10k, 51.7% for AGIs $10k-25k, 56.8% for AGIs $25k-50k, 61.3% for AGIs $50k-75k, 78.3% for AGIs $75k-100k)
Household received Food Stamps/SNAP in the past 12 months: 87 Household did not receive Food Stamps/SNAP in the past 12 months: 268
Women who had a birth in the past 12 months: 13 (0 now married, 11 unmarried) Women who did not have a birth in the past 12 months: 151 (117 now married, 30 unmarried)
Housing units in zip code 01349 with a mortgage: 182 (74 second mortgage, 67 both second mortgage and home equity loan) Median monthly owner costs for units with a mortgage: $1,520 Median monthly owner costs for units without a mortgage: $734
Residents with income below the poverty level in 2022:
This zip code:
16.5%
Whole state:
10.4%
Residents with income below 50% of the poverty level in 2022:
This zip code:
4.0%
Whole state:
5.1%
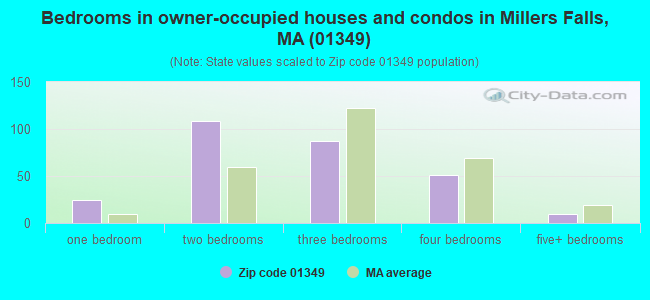
Median number of rooms in houses and condos:
Here:
5.5
State:
6.5
Median number of rooms in apartments:
Here:
4.9
State:
4.0
Notable locations in this zip code not listed on our city pages
Size of family households: 123 2-persons, 20 3-persons, 22 4-persons, 20 5-persons, 13 7-or-more-persons
Size of nonfamily households: 116 1-person, 36 2-persons, 1 5-persons
68 married couples with children.
89 single-parent households (67 men, 22 women).
88.7% of residents of 01349 zip code speak English at home.
0.1% of residents speak Spanish at home (100% very well).
2.8% of residents speak other Indo-European language at home (100% very well).
8.1% of residents speak other language at home (100% very well).
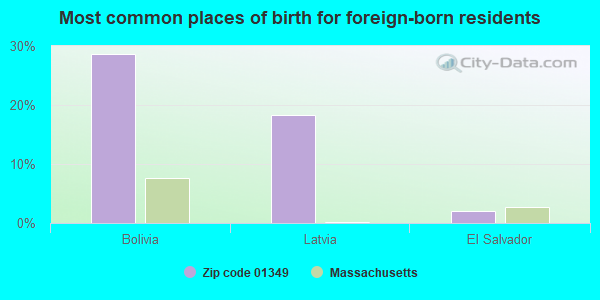
Foreign born population: 49 (6.5%) (81.5% of them are naturalized citizens)
This zip code:
6.5%
Whole state:
18.0%
29%Bolivia
18%Latvia
2%El Salvador
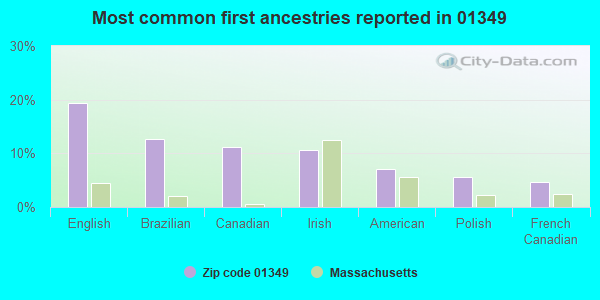
19%English
13%Brazilian
11%Canadian
11%Irish
7%American
6%Polish
5%French Canadian
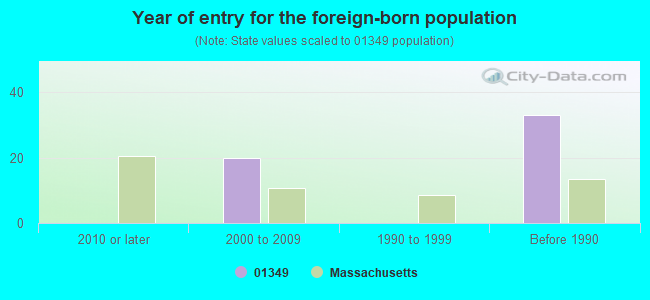
Year of entry for the foreign-born population
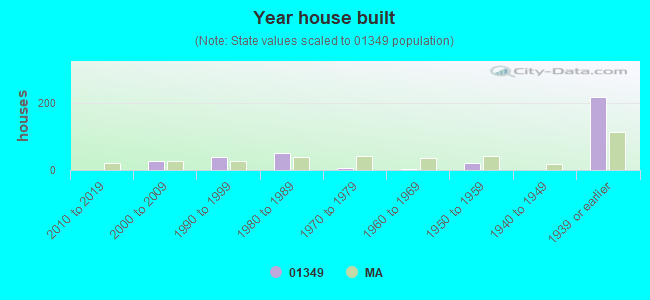
02010 or later
202000 to 2009
01990 to 1999
33Before 1990
Facilities with environmental interests located in this zip code:
RENOVATORS SUPPLY INC (28 BRIDGE ST in MONTAGUE, MA)
(Resource Conservation and Recovery Act (tracking hazardous waste)) Organizations: RENOVATORS SUPPLY CO INC (CONTACT/OWNER)
STRATHMORE PAPER COMPANY (MILL ROAD in MILLERS FALLS, MA)
National Pollutant Discharge Elimination System NON-MAJOR (Tracking pollutant discharge elimination systems) - permit
RENOVATORS SUPPLY INCORPORATED (STRACHAN STREET in MILLERS FALLS, MA)
TRI REPORTER (Tracking of toxic chemicals releasing facilities) Business SIC classification: PLASTICS FOAM PRODUCTS; ARCHITECTURAL AND ORNAMENTAL METALWORK; FABRICATED METAL PRODUCTS; LIGHTING EQUIPMENT
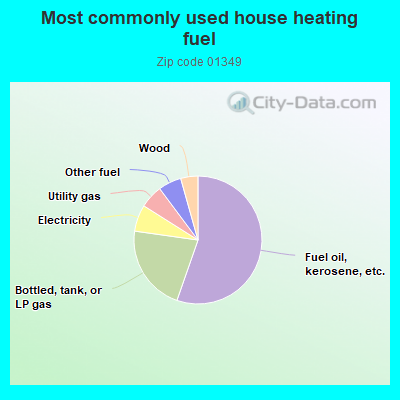
55.9%Fuel oil, kerosene, etc.
22.1%Bottled, tank, or LP gas
6.8%Electricity
5.9%Utility gas
5.9%Other fuel
4.4%Wood
Population in 1990: 1,893.
Place of birth for U.S.-born residents:
This state: 605
Northeast: 83
Midwest: 8
West: 2
58% of the 01349 zip code residents lived in the same house 5 years ago. Out of people who lived in different houses, 70% lived in this county. Out of people who lived in different counties, 50% lived in Massachusetts.
98% of the 01349 zip code residents lived in the same house 1 year ago. Out of people who lived in different houses, 117% moved from different county within same state.
Private vs. public school enrollment:
Students in private schools in grades 1 to 8 (elementary and middle school): 16
Here:
20.4%
Massachusetts:
10.3%
Students in private schools in grades 9 to 12 (high school):
Here:
0.0%
Massachusetts:
12.3%
Students in private undergraduate colleges:
Here:
0.0%
Massachusetts:
51.2%
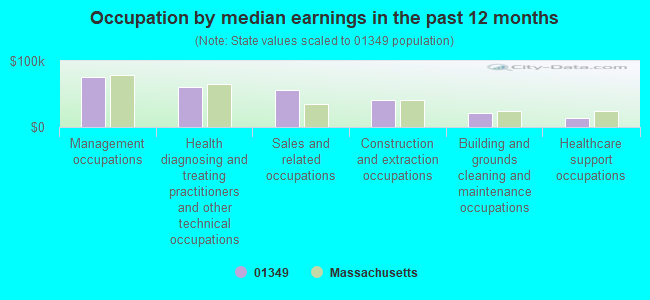
Occupation by median earnings in the past 12 months ($)
76,481Management occupations
60,218Health diagnosing and treating practitioners and other technical occupations
55,642Sales and related occupations
40,272Construction and extraction occupations
21,582Building and grounds cleaning and maintenance occupations
14,059Healthcare support occupations
Top industries in this zip code by the number of employees in 2005:
Accommodation and Food Services: Full-Service Restaurants (20-49 employees: 1 establishment)
Construction: Electrical Contractors (5-9: 1)
Construction: All Other Specialty Trade Contractors (5-9: 1)
Other Services (except Public Administration): Religious Organizations (1-4: 2)
Accommodation and Food Services: Drinking Places (Alcoholic Beverages) (1-4: 2)
Health Care and Social Assistance: Community Food Services (1-4: 1)
Professional, Scientific, and Technical Services: Advertising Agencies (1-4: 1)
Other Services (except Public Administration): Beauty Salons (1-4: 1)
People in group quarters in 2000:
3 people in homes or halfway houses for drug/alcohol abuse
Home Mortgage Disclosure Act Aggregated Statistics For Year 2009 (Based on 2 partial tracts)
A) FHA, FSA/RHS & VA Home Purchase Loans
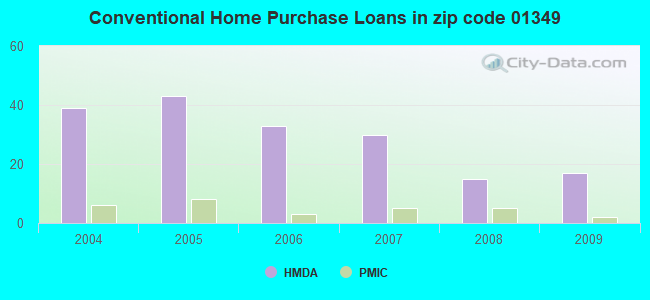
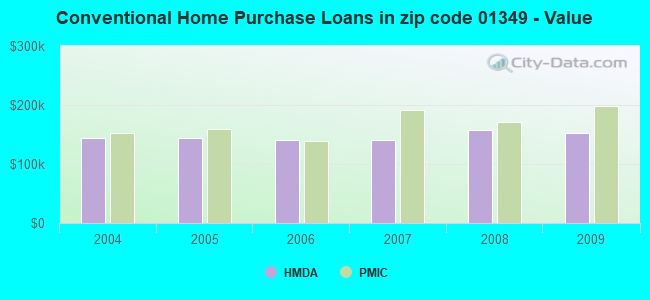
B) Conventional Home Purchase Loans
C) Refinancings
D) Home Improvement Loans
F) Non-occupant Loans on < 5 Family Dwellings (A B C & D)
G) Loans On Manufactured Home Dwelling (A B C & D)
Number
Average Value
Number
Average Value
Number
Average Value
Number
Average Value
Number
Average Value
Number
Average Value
LOANS ORIGINATED
6
$192,870
17
$151,962
58
$142,597
11
$81,785
5
$123,552
0
$0
APPLICATIONS APPROVED, NOT ACCEPTED
0
$0
1
$13,500
5
$114,804
1
$170,640
0
$0
0
$0
APPLICATIONS DENIED
0
$0
4
$119,340
16
$169,965
2
$58,050
4
$126,360
0
$0
APPLICATIONS WITHDRAWN
2
$156,060
2
$166,320
7
$144,334
1
$85,320
0
$0
0
$0
FILES CLOSED FOR INCOMPLETENESS
0
$0
1
$29,700
3
$86,760
0
$0
0
$0
1
$29,700
Aggregated Statistics For Year 2008 (Based on 2 partial tracts)
A) FHA, FSA/RHS & VA Home Purchase Loans
B) Conventional Home Purchase Loans
C) Refinancings
D) Home Improvement Loans
E) Loans on Dwellings For 5+ Families
F) Non-occupant Loans on < 5 Family Dwellings (A B C & D)
Number
Average Value
Number
Average Value
Number
Average Value
Number
Average Value
Number
Average Value
Number
Average Value
LOANS ORIGINATED
3
$156,600
15
$157,716
25
$153,209
10
$55,404
1
$221,400
1
$122,040
APPLICATIONS APPROVED, NOT ACCEPTED
0
$0
2
$169,290
3
$132,120
1
$135,000
0
$0
1
$86,400
APPLICATIONS DENIED
3
$160,020
2
$106,380
13
$167,815
5
$55,080
0
$0
1
$62,640
APPLICATIONS WITHDRAWN
2
$150,120
3
$101,880
8
$117,045
0
$0
0
$0
1
$102,600
FILES CLOSED FOR INCOMPLETENESS
0
$0
0
$0
2
$208,170
0
$0
0
$0
0
$0
Aggregated Statistics For Year 2007 (Based on 2 partial tracts)
A) FHA, FSA/RHS & VA Home Purchase Loans
B) Conventional Home Purchase Loans
C) Refinancings
D) Home Improvement Loans
E) Loans on Dwellings For 5+ Families
F) Non-occupant Loans on < 5 Family Dwellings (A B C & D)
Number
Average Value
Number
Average Value
Number
Average Value
Number
Average Value
Number
Average Value
Number
Average Value
LOANS ORIGINATED
3
$167,940
30
$139,878
35
$126,113
22
$68,015
1
$108,000
6
$165,870
APPLICATIONS APPROVED, NOT ACCEPTED
0
$0
3
$190,800
5
$135,648
3
$25,920
0
$0
1
$96,120
APPLICATIONS DENIED
0
$0
2
$129,060
28
$149,696
8
$80,258
0
$0
2
$147,150
APPLICATIONS WITHDRAWN
1
$86,940
2
$133,650
12
$133,065
2
$66,150
0
$0
1
$187,920
FILES CLOSED FOR INCOMPLETENESS
0
$0
1
$108,000
4
$173,745
0
$0
0
$0
1
$79,920
Aggregated Statistics For Year 2006 (Based on 2 partial tracts)
A) FHA, FSA/RHS & VA Home Purchase Loans
B) Conventional Home Purchase Loans
C) Refinancings
D) Home Improvement Loans
F) Non-occupant Loans on < 5 Family Dwellings (A B C & D)
G) Loans On Manufactured Home Dwelling (A B C & D)
Number
Average Value
Number
Average Value
Number
Average Value
Number
Average Value
Number
Average Value
Number
Average Value
LOANS ORIGINATED
1
$131,760
33
$141,365
54
$131,450
17
$86,749
4
$143,100
1
$34,020
APPLICATIONS APPROVED, NOT ACCEPTED
0
$0
4
$117,585
11
$131,662
4
$85,860
0
$0
0
$0
APPLICATIONS DENIED
0
$0
4
$158,895
35
$139,783
5
$58,860
1
$115,020
0
$0
APPLICATIONS WITHDRAWN
0
$0
2
$136,890
22
$149,924
3
$49,860
0
$0
0
$0
FILES CLOSED FOR INCOMPLETENESS
0
$0
1
$147,420
2
$152,550
0
$0
1
$72,900
0
$0
Aggregated Statistics For Year 2005 (Based on 2 partial tracts)
A) FHA, FSA/RHS & VA Home Purchase Loans
B) Conventional Home Purchase Loans
C) Refinancings
D) Home Improvement Loans
E) Loans on Dwellings For 5+ Families
F) Non-occupant Loans on < 5 Family Dwellings (A B C & D)
G) Loans On Manufactured Home Dwelling (A B C & D)
Number
Average Value
Number
Average Value
Number
Average Value
Number
Average Value
Number
Average Value
Number
Average Value
Number
Average Value
LOANS ORIGINATED
1
$165,240
43
$143,728
69
$120,545
24
$74,520
0
$0
8
$101,992
1
$27,000
APPLICATIONS APPROVED, NOT ACCEPTED
0
$0
7
$117,643
8
$108,945
1
$69,660
1
$120,960
0
$0
0
$0
APPLICATIONS DENIED
1
$97,740
3
$115,740
30
$120,042
14
$53,576
0
$0
2
$47,790
0
$0
APPLICATIONS WITHDRAWN
0
$0
5
$170,856
26
$136,911
2
$129,870
0
$0
2
$146,610
0
$0
FILES CLOSED FOR INCOMPLETENESS
0
$0
1
$173,880
6
$140,940
1
$40,500
0
$0
0
$0
0
$0
Aggregated Statistics For Year 2004 (Based on 2 partial tracts)
A) FHA, FSA/RHS & VA Home Purchase Loans
B) Conventional Home Purchase Loans
C) Refinancings
D) Home Improvement Loans
E) Loans on Dwellings For 5+ Families
F) Non-occupant Loans on < 5 Family Dwellings (A B C & D)
G) Loans On Manufactured Home Dwelling (A B C & D)


 Nearest zip codes: 01347, 01351, 01354, 01344, 01379, 01376.