Estimated zip code population in 2022: 7,165 Zip code population in 2010: 6,801 Zip code population in 2000: 6,200
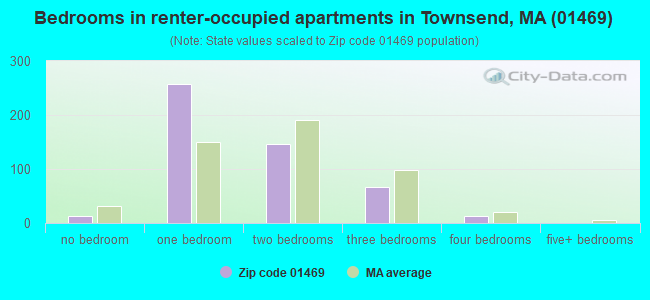
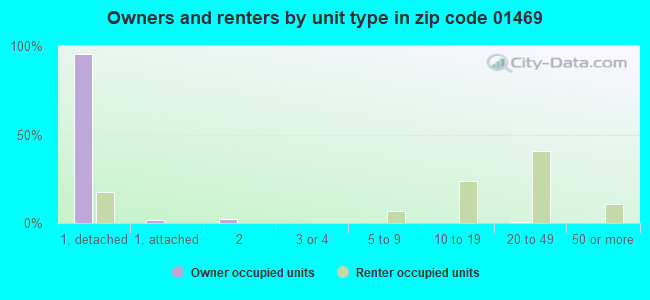
Houses and condos: 2,855 Renter-occupied apartments: 496
% of renters here:
17%
State:
38%
March 2022 cost of living index in zip code 01469: 111.2 (more than average, U.S. average is 100)
Land area: 22.9 sq. mi. Water area: 0.2 sq. mi.
Population density: 313 people per square mile
(very low).
OSM Map
Google Map
MSN Map
OSM Map
General Map
Google Map
MSN Map
OSM Map
Google Map
MSN Map
OSM Map
Google Map
MSN Map
Please wait while loading the map...
Real estate property taxes paid for housing units in 2022:
This zip code:
1.4% ($5,490)
Massachusetts:
1.0% ($5,536)
Median real estate property taxes paid for housing units with mortgages in 2022: $5,532 (1.3%) Median real estate property taxes paid for housing units with no mortgage in 2022: $5,403 (1.5%)
Business Search- 14 Million verified businesses
Males: 3,512
(49.0%)
Females: 3,653
(51.0%)
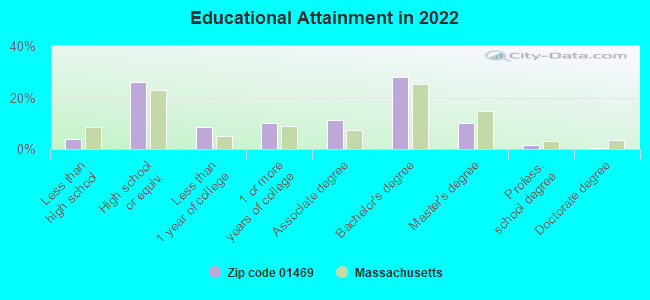
For population 25 years and over in 01469:
High school or higher: 95.6%
Bachelor's degree or higher: 40.0%
Graduate or professional degree: 12.0%
Unemployed: 3.4%
Mean travel time to work (commute): 40.8 minutes
For population 15 years and over in 01469:
Never married: 25.4%
Now married: 57.6%
Separated: 0.9%
Widowed: 4.7%
Divorced: 11.4%
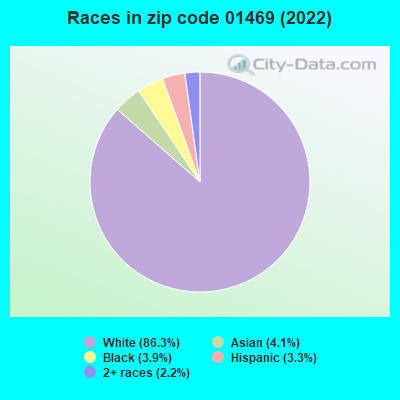
Zip code 01469 compared to state average:
Hispanic race population percentage significantly below state average.
Foreign-born population percentage significantly below state average.
Renting percentage below state average.
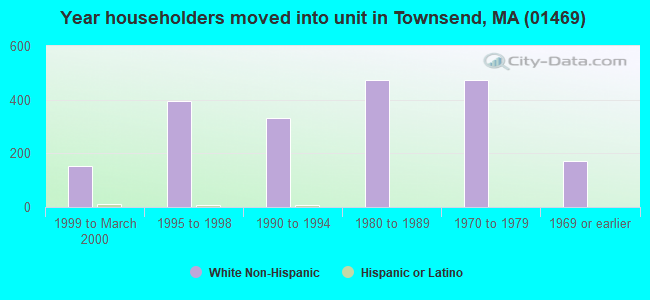
Length of stay since moving in significantly above state average.
Estimated median house/condo value in 2022: $401,771
01469:
$401,771
Massachusetts:
$534,700
According to our research of Massachusetts and other state lists, there were 2 registered sex offenders living in 01469 zip code as of May 28, 2024. The ratio of all residents to sex offenders in zip code 01469 is 3,768 to 1. The ratio of registered sex offenders to all residents in this zip code is much lower than the state average.
Median resident age:
This zip code:
41.3 years
Massachusetts median age:
40.3 years
Average household size:
This zip code:
2.5 people
Massachusetts:
2.4 people
Averages for the 2020 tax year for zip code 01469, filed in 2021:
Average Adjusted Gross Income (AGI) in 2020: $78,586 (Individual Income Tax Returns)
Here:
$78,586
State:
$105,130
Salary/wage: $70,736 (reported on 85.1% of returns)
Here:
$70,736
State:
$82,951
(% of AGI for various income ranges: 1060.7% for AGIs below $25k, 3624.9% for AGIs $25k-50k, 6038.1% for AGIs $50k-75k, 9400.7% for AGIs $75k-100k, 18422.9% for AGIs $100k-200k, 66817.1% for AGIs over 200k)
Taxable interest for individuals: $715 (reported on 52.3% of returns)
This zip code:
$715
Massachusetts:
$2,361
(% of AGI for various income ranges: 16.7% for AGIs below $25k, 24.2% for AGIs $25k-50k, 31.2% for AGIs $50k-75k, 50.4% for AGIs $75k-100k, 115.0% for AGIs $100k-200k, 378.6% for AGIs over 200k)
Ordinary dividends: $3,234 (reported on 20.1% of returns)
Here:
$3,234
State:
$10,365
(% of AGI for various income ranges: 23.0% for AGIs below $25k, 30.3% for AGIs $25k-50k, 67.9% for AGIs $50k-75k, 70.4% for AGIs $75k-100k, 135.4% for AGIs $100k-200k, 1268.6% for AGIs over 200k)
Net capital gain/loss in AGI: +$7,613 (reported on 16.8% of returns)
Here:
+$7,613
State:
+$48,178
(% of AGI for various income ranges: 4.6% for AGIs below $25k, 23.2% for AGIs $25k-50k, 89.3% for AGIs $50k-75k, 122.1% for AGIs $75k-100k, 247.7% for AGIs $100k-200k, 3642.9% for AGIs over 200k)
Profit/loss from business: +$14,424 (reported on 12.2% of returns)
Here:
+$14,424
State:
+$20,792
(% of AGI for various income ranges: 71.6% for AGIs below $25k, 164.4% for AGIs $25k-50k, 186.7% for AGIs $50k-75k, 234.6% for AGIs $75k-100k, 464.0% for AGIs $100k-200k, 1757.1% for AGIs over 200k)
Taxable individual retirement arrangement distribution: $19,521 (reported on 10.6% of returns)
01469:
$19,521
Massachusetts:
$22,790
(% of AGI for various income ranges: 83.4% for AGIs below $25k, 161.9% for AGIs $25k-50k, 215.2% for AGIs $50k-75k, 397.1% for AGIs $75k-100k, 597.1% for AGIs $100k-200k, 1468.6% for AGIs over 200k)
Total itemized deductions: $24,100 (reported on 9.8% of returns)
Here:
$24,100
State:
$36,722
(% of AGI for various income ranges: 201.2% for AGIs $25k-50k, 352.6% for AGIs $50k-75k, 454.6% for AGIs $75k-100k, 623.3% for AGIs $100k-200k, 2134.3% for AGIs over 200k)
Charity contributions: $4,271 (reported on 6.5% of returns)
Here:
$4,271
State:
$12,529
(% of AGI for various income ranges: 10.3% for AGIs $25k-50k, 11.0% for AGIs $50k-75k, 42.9% for AGIs $75k-100k, 89.2% for AGIs $100k-200k, 477.1% for AGIs over 200k)
Taxes paid: $8,814 (reported on 9.8% of returns)
01469:
$8,814
State:
$8,782
(% of AGI for various income ranges: 64.9% for AGIs $25k-50k, 136.7% for AGIs $50k-75k, 194.3% for AGIs $75k-100k, 226.2% for AGIs $100k-200k, 708.6% for AGIs over 200k)
Earned income credit: $1,864 (reported on 7.6% of returns)
Here:
$1,864
State:
$1,909
(% of AGI for various income ranges: 50.3% for AGIs below $25k, 36.4% for AGIs $25k-50k)
Percentage of individuals using paid preparers for their 2020 taxes: 91.1%
Here:
91%
State:
92%
(% for various income ranges: 89.9% for AGIs below $25k, 89.7% for AGIs $25k-50k, 92.6% for AGIs $50k-75k, 92.7% for AGIs $75k-100k, 91.9% for AGIs $100k-200k, 90.5% for AGIs over 200k)
Averages for the 2012 tax year for zip code 01469, filed in 2013:
Average Adjusted Gross Income (AGI) in 2012: $62,717 (Individual Income Tax Returns)
Here:
$62,717
State:
$81,425
Salary/wage: $58,503 (reported on 87.3% of returns)
Here:
$58,503
State:
$64,752
(% of AGI for various income ranges: 72.2% for AGIs below $25k, 78.0% for AGIs $25k-50k, 79.6% for AGIs $50k-75k, 82.0% for AGIs $75k-100k, 87.5% for AGIs $100k-200k, 69.3% for AGIs over 200k)
Taxable interest for individuals: $593 (reported on 42.9% of returns)
This zip code:
$593
Massachusetts:
$2,136
(% of AGI for various income ranges: 1.4% for AGIs below $25k, 0.6% for AGIs $25k-50k, 0.3% for AGIs $50k-75k, 0.3% for AGIs $75k-100k, 0.4% for AGIs $100k-200k, 0.2% for AGIs over 200k)
Ordinary dividends: $1,754 (reported on 19.9% of returns)
Here:
$1,754
State:
$9,473
(% of AGI for various income ranges: 1.1% for AGIs below $25k, 0.6% for AGIs $25k-50k, 0.5% for AGIs $50k-75k, 0.4% for AGIs $75k-100k, 0.4% for AGIs $100k-200k, 0.9% for AGIs over 200k)
Net capital gain/loss in AGI: +$2,633 (reported on 13.8% of returns)
Here:
+$2,633
State:
+$31,437
(% of AGI for various income ranges: 0.2% for AGIs $75k-100k, 0.5% for AGIs $100k-200k, 2.8% for AGIs over 200k)
Profit/loss from business: +$13,730 (reported on 14.4% of returns)
Here:
+$13,730
State:
+$20,662
(% of AGI for various income ranges: 6.4% for AGIs below $25k, 5.0% for AGIs $25k-50k, 2.8% for AGIs $50k-75k, 3.6% for AGIs $75k-100k, 3.0% for AGIs $100k-200k)
Taxable individual retirement arrangement distribution: $13,119 (reported on 9.2% of returns)
01469:
$13,119
Massachusetts:
$18,892
(% of AGI for various income ranges: 4.0% for AGIs below $25k, 2.0% for AGIs $25k-50k, 2.9% for AGIs $50k-75k, 2.3% for AGIs $75k-100k, 1.7% for AGIs $100k-200k)
Self-employment retirement plans: $9,500 (reported on 0.6% of returns)
01469:
$9,500
Massachusetts:
$20,669
Total itemized deductions: $20,221 (20% of AGI, reported on 44.4% of returns)
Here:
$20,221
State:
$28,907
Here:
19.8% of AGI
State:
18.2% of AGI
(% of AGI for various income ranges: 12.2% for AGIs below $25k, 12.0% for AGIs $25k-50k, 14.3% for AGIs $50k-75k, 16.8% for AGIs $75k-100k, 15.2% for AGIs $100k-200k, 11.0% for AGIs over 200k)
Charity contributions: $1,553 (reported on 33.7% of returns)
Here:
$1,553
State:
$4,208
(% of AGI for various income ranges: 0.5% for AGIs below $25k, 0.6% for AGIs $25k-50k, 0.7% for AGIs $50k-75k, 0.9% for AGIs $75k-100k, 1.0% for AGIs $100k-200k, 0.8% for AGIs over 200k)
Taxes paid: $9,408 (reported on 44.1% of returns)
01469:
$9,408
State:
$13,303
(% of AGI for various income ranges: 3.4% for AGIs below $25k, 4.0% for AGIs $25k-50k, 5.8% for AGIs $50k-75k, 7.3% for AGIs $75k-100k, 7.7% for AGIs $100k-200k, 6.7% for AGIs over 200k)
Earned income credit: $1,682 (reported on 9.5% of returns)
Here:
$1,682
State:
$1,971
(% of AGI for various income ranges: 3.1% for AGIs below $25k, 0.7% for AGIs $25k-50k)
Percentage of individuals using paid preparers for their 2012 taxes: 45.8%
Here:
46%
State:
56%
(% for various income ranges: 38.8% for AGIs below $25k, 43.3% for AGIs $25k-50k, 52.2% for AGIs $50k-75k, 50.0% for AGIs $75k-100k, 51.5% for AGIs $100k-200k, 62.5% for AGIs over 200k)
Averages for the 2004 tax year for zip code 01469, filed in 2005:
Average Adjusted Gross Income (AGI) in 2004: $52,791 (Individual Income Tax Returns)
Here:
$52,791
State:
$62,877
Salary/wage: $49,255 (reported on 90.4% of returns)
Here:
$49,255
State:
$52,969
(% of AGI for various income ranges: 98.4% for AGIs below $10k, 74.8% for AGIs $10k-25k, 85.7% for AGIs $25k-50k, 86.6% for AGIs $50k-75k, 89.5% for AGIs $75k-100k, 80.5% for AGIs over 100k)
Taxable interest for individuals: $731 (reported on 56.9% of returns)
This zip code:
$731
Massachusetts:
$1,945
(% of AGI for various income ranges: 3.3% for AGIs below $10k, 1.7% for AGIs $10k-25k, 0.7% for AGIs $25k-50k, 0.6% for AGIs $50k-75k, 0.8% for AGIs $75k-100k, 0.7% for AGIs over 100k)
Taxable dividends: $1,130 (reported on 24.2% of returns)
Here:
$1,130
State:
$5,323
(% of AGI for various income ranges: 1.4% for AGIs below $10k, 1.0% for AGIs $10k-25k, 0.5% for AGIs $25k-50k, 0.3% for AGIs $50k-75k, 0.5% for AGIs $75k-100k, 0.5% for AGIs over 100k)
Net capital gain/loss: +$5,593 (reported on 17.5% of returns)
Here:
+$5,593
State:
+$20,377
(% of AGI for various income ranges: -2.4% for AGIs below $10k, 0.8% for AGIs $10k-25k, -0.1% for AGIs $25k-50k, 0.3% for AGIs $50k-75k, 1.0% for AGIs $75k-100k, 4.2% for AGIs over 100k)
Profit/loss from business: +$11,625 (reported on 15.7% of returns)
Here:
+$11,625
State:
+$17,837
(% of AGI for various income ranges: 4.7% for AGIs below $10k, 5.7% for AGIs $10k-25k, 4.5% for AGIs $25k-50k, 4.8% for AGIs $50k-75k, 3.4% for AGIs $75k-100k, 2.0% for AGIs over 100k)
IRA payment deduction: $3,104 (reported on 3.4% of returns)
01469:
$3,104
Massachusetts:
$3,100
(% of AGI for various income ranges: 0.2% for AGIs $10k-25k, 0.3% for AGIs $25k-50k, 0.3% for AGIs $50k-75k, 0.3% for AGIs $75k-100k, 0.1% for AGIs over 100k)
Self-employed pension: $9,056 (reported on 0.5% of returns)
Here:
$9,056
Massachusetts:
$14,516
Total itemized deductions: $17,718 (21% of AGI, reported on 48.3% of returns)
Here:
$17,718
State:
$22,573
Here:
20.9% of AGI
State:
19.5% of AGI
(% of AGI for various income ranges: 13.7% for AGIs below $10k, 11.1% for AGIs $10k-25k, 15.6% for AGIs $25k-50k, 19.4% for AGIs $50k-75k, 19.0% for AGIs $75k-100k, 13.9% for AGIs over 100k)
Charity contributions deductions: $1,480 (2% of AGI, reported on 42.7% of returns)
Here:
$1,480
State:
$3,295
Here:
1.7% of AGI
State:
2.7% of AGI
(% of AGI for various income ranges: 0.3% for AGIs below $10k, 0.6% for AGIs $10k-25k, 1.0% for AGIs $25k-50k, 1.2% for AGIs $50k-75k, 1.3% for AGIs $75k-100k, 1.3% for AGIs over 100k)
Total tax: $7,145 (reported on 81.7% of returns)
01469:
$7,145
State:
$11,494
(% of AGI for various income ranges: 2.8% for AGIs below $10k, 5.0% for AGIs $10k-25k, 7.4% for AGIs $25k-50k, 8.2% for AGIs $50k-75k, 9.7% for AGIs $75k-100k, 16.0% for AGIs over 100k)
Earned income credit: $1,310 (reported on 6.8% of returns)
Here:
$1,310
State:
$1,518
Percentage of individuals using paid preparers for their 2004 taxes: 48.0%
Here:
48%
State:
58%
(% for various income ranges: 35.0% for AGIs below $10k, 46.6% for AGIs $10k-25k, 51.2% for AGIs $25k-50k, 54.5% for AGIs $50k-75k, 56.0% for AGIs $75k-100k, 47.7% for AGIs over 100k)
Household received Food Stamps/SNAP in the past 12 months: 174 Household did not receive Food Stamps/SNAP in the past 12 months: 2,631
Women who had a birth in the past 12 months: 34 (27 now married, 6 unmarried) Women who did not have a birth in the past 12 months: 1,586 (854 now married, 714 unmarried)
Housing units in zip code 01469 with a mortgage: 1,635 (282 second mortgage, 11 home equity loan, 201 both second mortgage and home equity loan) Median monthly owner costs for units with a mortgage: $2,336 Median monthly owner costs for units without a mortgage: $879
Residents with income below the poverty level in 2022:
This zip code:
7.3%
Whole state:
10.4%
Residents with income below 50% of the poverty level in 2022:
This zip code:
3.3%
Whole state:
5.1%
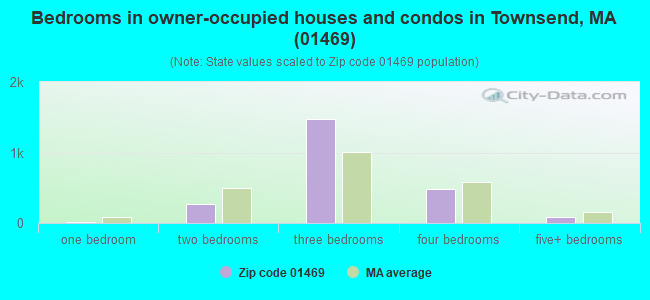
Median number of rooms in houses and condos:
Here:
6.5
State:
6.5
Median number of rooms in apartments:
Here:
3.5
State:
4.0
Notable locations in this zip code not listed on our city pages
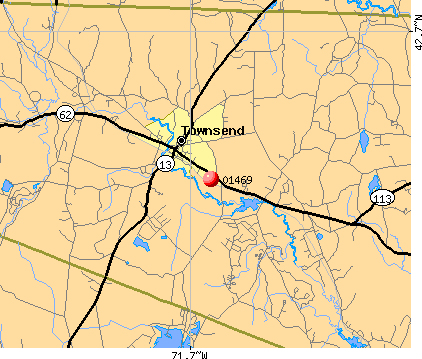
Notable locations in zip code 01469: Townsend Fire Department Station 3 Townsend Harbor (A), Townsend Fire Department Station 1 Annex (B), Townsend Fire Department Emergency Medical Service (C), Townsend Fire Department (D), Townsend Fire Department Headquarters (E), Hawthorne Brook Middle School Library (F), Townsend Public Library (G), Townsend Town Hall (H). Display/hide their locations on the map
Lakes, reservoirs, and swamps: Dead Pond (A), Graves Pond (B), Walker Pond (C), Harbor Pond (D), Bixby Reservoir (E), Squannacook River Reservoir (F), Wolf Swamp (G), Dead Swamp (H). Display/hide their locations on the map
1,157 married couples with children.
221 single-parent households (26 men, 195 women).
91.3% of residents of 01469 zip code speak English at home.
1.4% of residents speak Spanish at home (100% very well).
3.1% of residents speak other Indo-European language at home (84% very well, 12% well, 4% not well).
3.1% of residents speak Asian or Pacific Island language at home (74% very well, 7% well, 19% not well).
0.5% of residents speak other language at home (56% very well, 44% well).
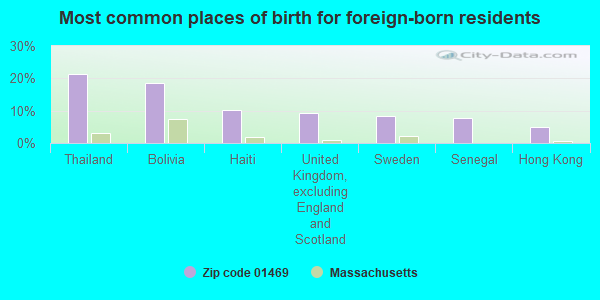
Foreign born population: 404 (5.6%) (86.5% of them are naturalized citizens)
This zip code:
5.6%
Whole state:
18.0%
21%Thailand
19%Bolivia
10%Haiti
9%United Kingdom, excluding England and Scotland
8%Sweden
8%Senegal
5%Hong Kong
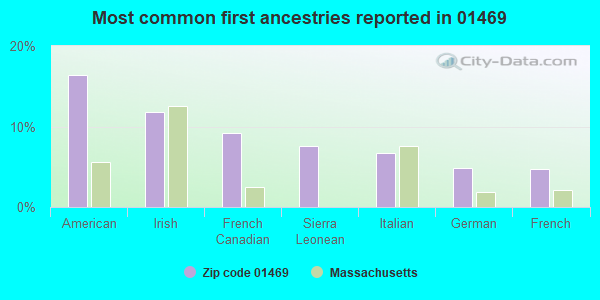
16%American
12%Irish
9%French Canadian
8%Sierra Leonean
7%Italian
5%German
5%French
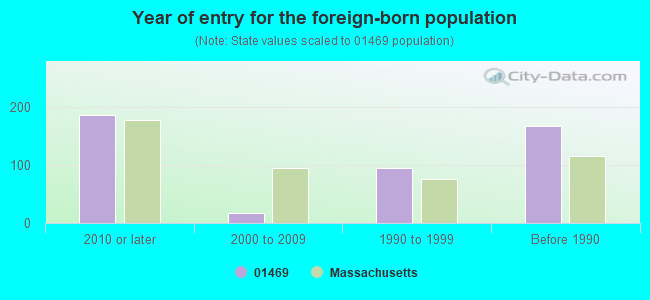
Year of entry for the foreign-born population
1862010 or later
172000 to 2009
941990 to 1999
167Before 1990
Facilities with environmental interests located in this zip code:
MIDDLESEX REG HIGH (19 MAIN STREET in TOWNSEND, MA)
AIR MINOR (AIRS/AFS) (National Center for Education Statistics) - STATE ID-735505 CRITERIA AND HAZARDOUS AIR POLLUTANT INVENTORY (Inventory of air pollution sources) Business SIC classification: ELEMENTARY AND SECONDARY SCHOOLS Organizations: NORTH MIDDLESEX (SCHOOL DISTRICT)
Alternative names: N MIDDLESEX REG HIGH, NORTH MIDDLESEX REGIONAL HIGH, NORTH MIDDLESEX REGIONAL HIGH SCHOOL
NEW ENGLAND BUSINESS SERVICE (12 SOUTH ST in TOWNSEND, MA)
AIR MINOR (AIRS/AFS) CRITERIA AND HAZARDOUS AIR POLLUTANT INVENTORY (Inventory of air pollution sources) HAZARDOUS WASTE BIENNIAL REPORTER (Resource Conservation and Recovery Act (tracking hazardous waste)) Large Quantity Generators, more that 1000 kg of hazardous waste/month (Resource Conservation and Recovery Act (tracking hazardous waste)) - notification Business SIC and NAICS classification: MANIFOLD BUSINESS FORMS
M J S METALS (60 TURNPIKE RD in TOWNSEND, MA)
COMPLIANCE ACTIVITY (Tracking inspections of insecticide, fungicide, and rodenticide, and toxic substances) (Resource Conservation and Recovery Act (tracking hazardous waste)) Business NAICS classification: SECONDARY SMELTING, REFINING, AND ALLOYING OF NONFERROUS METAL (EXCEPT COPPER AND ALUMINUM). Organizations: CRS METALS (CONTACT/OWNER)
Alternative names: MJS METALS
NEW ENGLAND TELE CO (RAILROAD ST in TOWNSEND, MA)
(Resource Conservation and Recovery Act (tracking hazardous waste))
M & M MACHINE (5 CENTER ST in TOWNSEND, MA)
(Resource Conservation and Recovery Act (tracking hazardous waste)) Organizations: EMIL F MORIN (CONTACT/OWNER)
BARO W & SONS (345 MAIN ST in TOWNSEND, MA)
Conditionally Exempt Small Quantity Generators, less than 100 kg/month of hazardous waste (Resource Conservation and Recovery Act (tracking hazardous waste)) - notification Organizations: WILLIAM W BARO (CONTACT/OWNER)
BRUCES AUTO BODY (277 MAIN ST in TOWNSEND, MA)
Conditionally Exempt Small Quantity Generators, less than 100 kg/month of hazardous waste (Resource Conservation and Recovery Act (tracking hazardous waste)) - notification Organizations: BRUCE E NASH (CONTACT/OWNER)
Housing units lacking complete plumbing facilities: 0.4% Housing units lacking complete kitchen facilities: 0.4%
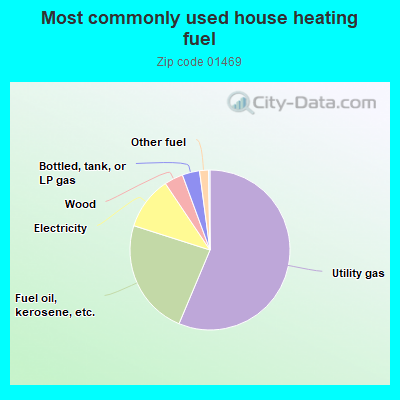
56.4%Utility gas
23.6%Fuel oil, kerosene, etc.
10.7%Electricity
3.8%Wood
3.5%Bottled, tank, or LP gas
1.8%Other fuel
Population in 1990: 6,112. Population change in the 1990s: +88 (+1.4%).
Place of birth for U.S.-born residents:
This state: 4,920
Northeast: 1,150
Midwest: 121
South: 236
West: 249
76% of the 01469 zip code residents lived in the same house 5 years ago. Out of people who lived in different houses, 61% lived in this county. Out of people who lived in different counties, 50% lived in Massachusetts.
91% of the 01469 zip code residents lived in the same house 1 year ago. Out of people who lived in different houses, 22% moved from this county. Out of people who lived in different houses, 43% moved from different county within same state. Out of people who lived in different houses, 39% moved from different state.
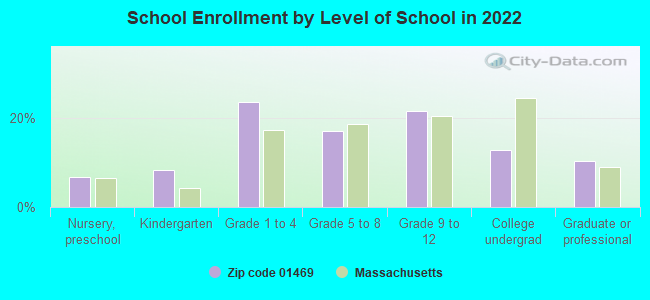
Private vs. public school enrollment:
Students in private schools in grades 1 to 8 (elementary and middle school): 103
Here:
13.3%
Massachusetts:
10.3%
Students in private schools in grades 9 to 12 (high school): 13
Here:
3.2%
Massachusetts:
12.3%
Students in private undergraduate colleges: 60
Here:
25.5%
Massachusetts:
51.2%
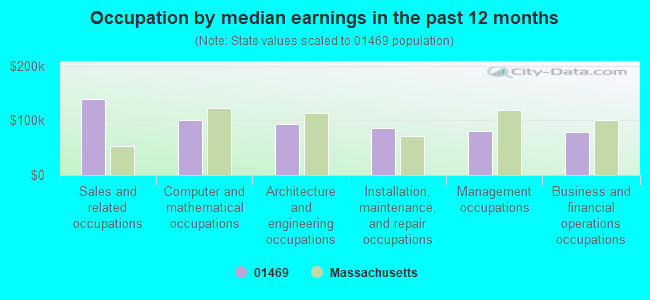
Occupation by median earnings in the past 12 months ($)
139,365Sales and related occupations
99,943Computer and mathematical occupations
93,168Architecture and engineering occupations
85,598Installation, maintenance, and repair occupations
81,095Management occupations
79,551Business and financial operations occupations
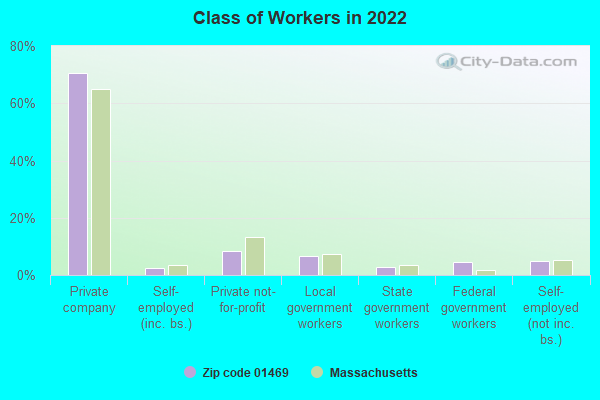
Companies with federal contracts located in this zip code:
BAKER, VICKI (25 ASH ST in TOWNSEND, MA; small business)
$8,403 with Army for Technical Assistance. Signed on 2002-08-26. Completion date: 2003-09-03.
Top industries in this zip code by the number of employees in 2005:
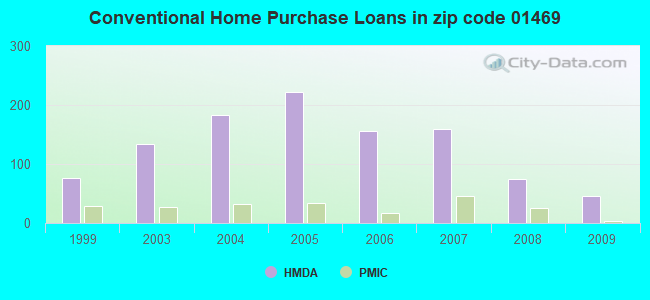
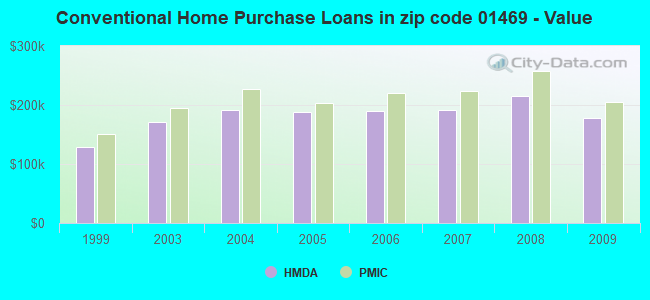
Detailed PMIC statistics for the following Tracts:3011.01
, 3011.02
2002 - 2018 National Fire Incident Reporting System (NFIRS) incidents
Based on the data from the years 2002 - 2018 the average number of fires per year is 13. The highest number of reported fires - 27 took place in 2016, and the least - 5 in 2002. The data has a rising trend.
When looking into fire subcategories, the most reports belonged to: Structure Fires (55.0%), and Outside Fires (31.1%).
Fire incident types reported to NFIRS in Zip Code 01469


 Nearest zip codes: 01474, 01462, 03033, 01463, 03048, 01464.


 Based on the data from the years 2002 - 2018 the average number of fires per year is 13. The highest number of reported fires - 27 took place in 2016, and the least - 5 in 2002. The data has a rising trend.
 When looking into fire subcategories, the most reports belonged to: Structure Fires (55.0%), and Outside Fires (31.1%).