Estimated zip code population in 2022: 3,512 Zip code population in 2010: 2,866 Zip code population in 2000: 2,380
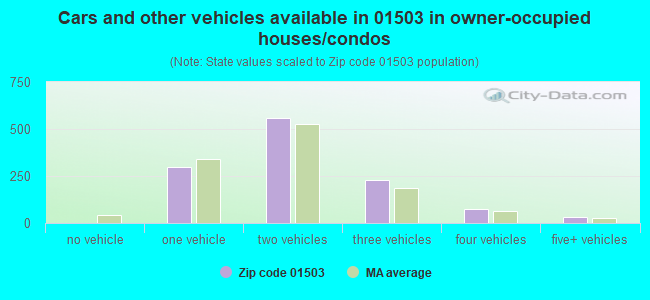
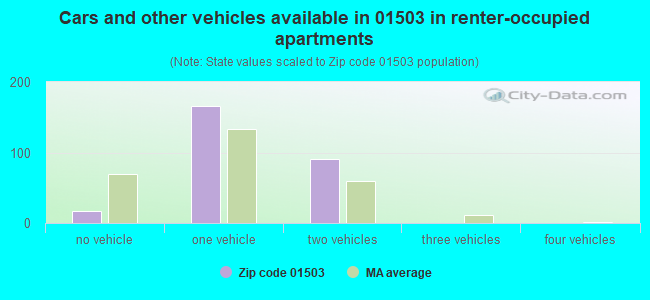
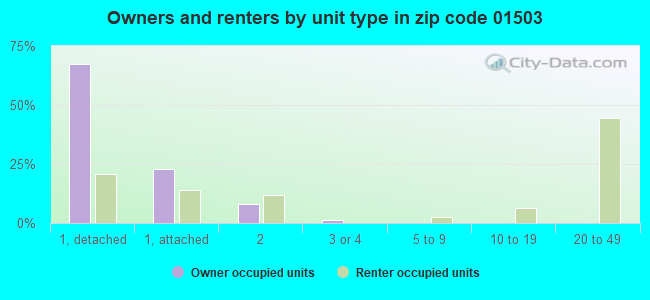
Houses and condos: 1,515 Renter-occupied apartments: 271
% of renters here:
19%
State:
38%
March 2022 cost of living index in zip code 01503: 117.1 (more than average, U.S. average is 100)
Land area: 13.0 sq. mi. Water area: 0.2 sq. mi.
Population density: 271 people per square mile
(very low).
OSM Map
Google Map
MSN Map
OSM Map
General Map
Google Map
MSN Map
OSM Map
Google Map
MSN Map
OSM Map
Google Map
MSN Map
Please wait while loading the map...
Real estate property taxes paid for housing units in 2022:
This zip code:
1.1% ($6,696)
Massachusetts:
1.0% ($5,536)
Median real estate property taxes paid for housing units with mortgages in 2022: $6,631 (1.1%) Median real estate property taxes paid for housing units with no mortgage in 2022: $6,756 (1.1%)
Business Search- 14 Million verified businesses
Males: 1,672
(47.6%)
Females: 1,840
(52.4%)
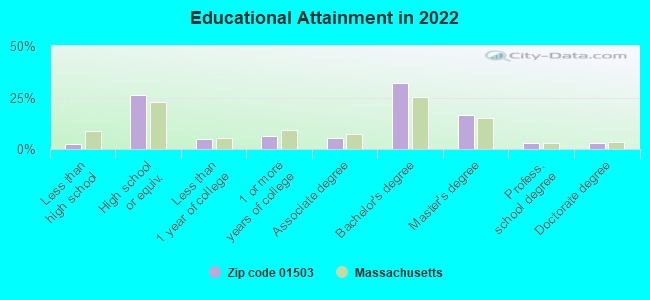
For population 25 years and over in 01503:
High school or higher: 98.1%
Bachelor's degree or higher: 54.6%
Graduate or professional degree: 22.3%
Unemployed: 3.5%
Mean travel time to work (commute): 35.1 minutes
For population 15 years and over in 01503:
Never married: 22.2%
Now married: 59.4%
Separated: 0.6%
Widowed: 6.3%
Divorced: 11.5%
Zip code 01503 compared to state average:
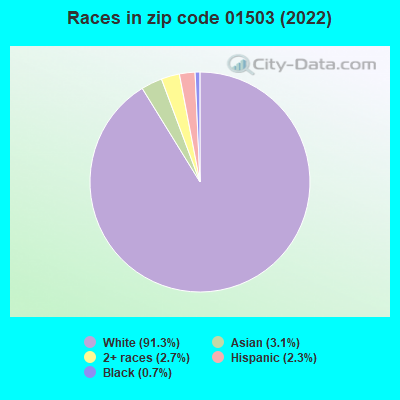
Black race population percentage significantly below state average.
Hispanic race population percentage significantly below state average.
Median age significantly above state average.
Foreign-born population percentage significantly below state average.
Renting percentage below state average.
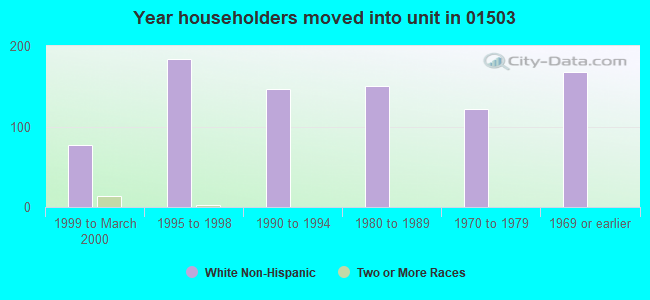
Length of stay since moving in significantly above state average.
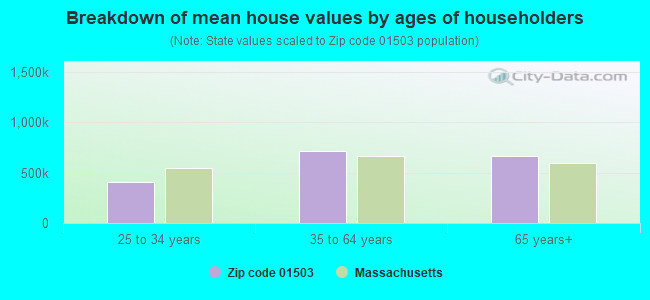
Estimated median house/condo value in 2022: $630,170
01503:
$630,170
Massachusetts:
$534,700
According to our research of Massachusetts and other state lists, there were 2 registered sex offenders living in 01503 zip code as of June 03, 2024. The ratio of all residents to sex offenders in zip code 01503 is 1,552 to 1. The ratio of registered sex offenders to all residents in this zip code is near the state average.
Median resident age:
This zip code:
50.3 years
Massachusetts median age:
40.3 years
Average household size:
This zip code:
2.4 people
Massachusetts:
2.4 people
Averages for the 2020 tax year for zip code 01503, filed in 2021:
Average Adjusted Gross Income (AGI) in 2020: $114,015 (Individual Income Tax Returns)
Here:
$114,015
State:
$105,130
Salary/wage: $99,461 (reported on 80.5% of returns)
Here:
$99,461
State:
$82,951
(% of AGI for various income ranges: 1062.2% for AGIs below $25k, 4048.2% for AGIs $25k-50k, 7536.4% for AGIs $50k-75k, 9880.0% for AGIs $75k-100k, 17854.3% for AGIs $100k-200k, 84378.9% for AGIs over 200k)
Taxable interest for individuals: $1,179 (reported on 52.1% of returns)
This zip code:
$1,179
Massachusetts:
$2,361
(% of AGI for various income ranges: 27.0% for AGIs below $25k, 45.9% for AGIs $25k-50k, 92.1% for AGIs $50k-75k, 61.5% for AGIs $75k-100k, 118.7% for AGIs $100k-200k, 567.8% for AGIs over 200k)
Ordinary dividends: $7,706 (reported on 32.6% of returns)
Here:
$7,706
State:
$10,365
(% of AGI for various income ranges: 44.8% for AGIs below $25k, 117.3% for AGIs $25k-50k, 176.4% for AGIs $50k-75k, 200.8% for AGIs $75k-100k, 530.9% for AGIs $100k-200k, 2966.7% for AGIs over 200k)
Net capital gain/loss in AGI: +$18,019 (reported on 30.5% of returns)
Here:
+$18,019
State:
+$48,178
(% of AGI for various income ranges: 1.9% for AGIs below $25k, 21.4% for AGIs $25k-50k, 266.4% for AGIs $50k-75k, 175.4% for AGIs $75k-100k, 814.8% for AGIs $100k-200k, 8804.4% for AGIs over 200k)
Profit/loss from business: +$30,097 (reported on 15.3% of returns)
Here:
+$30,097
State:
+$20,792
(% of AGI for various income ranges: 137.8% for AGIs below $25k, 208.2% for AGIs $25k-50k, 521.4% for AGIs $50k-75k, 813.1% for AGIs $75k-100k, 907.0% for AGIs $100k-200k, 4472.2% for AGIs over 200k)
Taxable individual retirement arrangement distribution: $27,465 (reported on 13.7% of returns)
01503:
$27,465
Massachusetts:
$22,790
(% of AGI for various income ranges: 85.2% for AGIs below $25k, 164.1% for AGIs $25k-50k, 243.6% for AGIs $50k-75k, 611.5% for AGIs $75k-100k, 856.5% for AGIs $100k-200k, 3826.7% for AGIs over 200k)
Total itemized deductions: $31,209 (reported on 17.4% of returns)
Here:
$31,209
State:
$36,722
(% of AGI for various income ranges: 438.6% for AGIs $25k-50k, 602.9% for AGIs $50k-75k, 574.6% for AGIs $75k-100k, 1350.0% for AGIs $100k-200k, 5153.3% for AGIs over 200k)
Charity contributions: $7,159 (reported on 14.2% of returns)
Here:
$7,159
State:
$12,529
(% of AGI for various income ranges: 13.0% for AGIs below $25k, 54.3% for AGIs $50k-75k, 226.5% for AGIs $100k-200k, 1445.6% for AGIs over 200k)
Taxes paid: $9,197 (reported on 17.4% of returns)
01503:
$9,197
State:
$8,782
(% of AGI for various income ranges: 117.3% for AGIs $25k-50k, 187.1% for AGIs $50k-75k, 216.2% for AGIs $75k-100k, 433.9% for AGIs $100k-200k, 1373.3% for AGIs over 200k)
Earned income credit: $1,511 (reported on 4.7% of returns)
Here:
$1,511
State:
$1,909
(% of AGI for various income ranges: 27.8% for AGIs below $25k, 27.7% for AGIs $25k-50k)
Percentage of individuals using paid preparers for their 2020 taxes: 91.1%
Here:
91%
State:
92%
(% for various income ranges: 88.6% for AGIs below $25k, 87.9% for AGIs $25k-50k, 95.7% for AGIs $50k-75k, 90.9% for AGIs $75k-100k, 92.5% for AGIs $100k-200k, 92.9% for AGIs over 200k)
Averages for the 2012 tax year for zip code 01503, filed in 2013:
Average Adjusted Gross Income (AGI) in 2012: $93,341 (Individual Income Tax Returns)
Here:
$93,341
State:
$81,425
Salary/wage: $79,386 (reported on 82.8% of returns)
Here:
$79,386
State:
$64,752
(% of AGI for various income ranges: 62.6% for AGIs below $25k, 70.9% for AGIs $25k-50k, 70.0% for AGIs $50k-75k, 73.8% for AGIs $75k-100k, 78.7% for AGIs $100k-200k, 63.5% for AGIs over 200k)
Taxable interest for individuals: $1,156 (reported on 56.3% of returns)
This zip code:
$1,156
Massachusetts:
$2,136
(% of AGI for various income ranges: 1.9% for AGIs below $25k, 0.9% for AGIs $25k-50k, 1.1% for AGIs $50k-75k, 0.9% for AGIs $75k-100k, 0.4% for AGIs $100k-200k, 0.6% for AGIs over 200k)
Ordinary dividends: $11,554 (reported on 33.1% of returns)
Here:
$11,554
State:
$9,473
(% of AGI for various income ranges: 2.8% for AGIs below $25k, 3.0% for AGIs $25k-50k, 2.3% for AGIs $50k-75k, 0.7% for AGIs $75k-100k, 1.2% for AGIs $100k-200k, 8.1% for AGIs over 200k)
Net capital gain/loss in AGI: +$5,870 (reported on 24.5% of returns)
Here:
+$5,870
State:
+$31,437
(% of AGI for various income ranges: 0.3% for AGIs $75k-100k, 0.7% for AGIs $100k-200k, 3.4% for AGIs over 200k)
Profit/loss from business: +$19,760 (reported on 16.6% of returns)
Here:
+$19,760
State:
+$20,662
(% of AGI for various income ranges: 8.7% for AGIs below $25k, 3.8% for AGIs $25k-50k, 4.0% for AGIs $50k-75k, 6.3% for AGIs $75k-100k, 4.1% for AGIs $100k-200k, 1.7% for AGIs over 200k)
Taxable individual retirement arrangement distribution: $15,595 (reported on 14.6% of returns)
01503:
$15,595
Massachusetts:
$18,892
(% of AGI for various income ranges: 7.5% for AGIs below $25k, 3.4% for AGIs $25k-50k, 4.4% for AGIs $50k-75k, 2.4% for AGIs $75k-100k, 4.1% for AGIs $100k-200k)
Total itemized deductions: $27,591 (18% of AGI, reported on 51.7% of returns)
Here:
$27,591
State:
$28,907
Here:
18.4% of AGI
State:
18.2% of AGI
(% of AGI for various income ranges: 20.5% for AGIs below $25k, 15.6% for AGIs $25k-50k, 16.4% for AGIs $50k-75k, 19.1% for AGIs $75k-100k, 17.6% for AGIs $100k-200k, 11.7% for AGIs over 200k)
Charity contributions: $2,726 (reported on 43.0% of returns)
Here:
$2,726
State:
$4,208
(% of AGI for various income ranges: 0.7% for AGIs below $25k, 1.0% for AGIs $25k-50k, 1.8% for AGIs $50k-75k, 1.1% for AGIs $75k-100k, 1.2% for AGIs $100k-200k, 1.3% for AGIs over 200k)
Taxes paid: $13,686 (reported on 51.7% of returns)
01503:
$13,686
State:
$13,303
(% of AGI for various income ranges: 7.3% for AGIs below $25k, 5.9% for AGIs $25k-50k, 7.0% for AGIs $50k-75k, 8.3% for AGIs $75k-100k, 8.7% for AGIs $100k-200k, 6.9% for AGIs over 200k)
Earned income credit: $1,567 (reported on 6.0% of returns)
Here:
$1,567
State:
$1,971
(% of AGI for various income ranges: 1.9% for AGIs below $25k, 0.5% for AGIs $25k-50k)
Percentage of individuals using paid preparers for their 2012 taxes: 53.0%
Here:
53%
State:
56%
(% for various income ranges: 45.5% for AGIs below $25k, 46.4% for AGIs $25k-50k, 57.1% for AGIs $50k-75k, 57.1% for AGIs $75k-100k, 59.4% for AGIs $100k-200k, 66.7% for AGIs over 200k)
Averages for the 2004 tax year for zip code 01503, filed in 2005:
Average Adjusted Gross Income (AGI) in 2004: $76,999 (Individual Income Tax Returns)
Here:
$76,999
State:
$62,877
Salary/wage: $63,006 (reported on 83.1% of returns)
Here:
$63,006
State:
$52,969
(% of AGI for various income ranges: 125.7% for AGIs below $10k, 54.1% for AGIs $10k-25k, 76.3% for AGIs $25k-50k, 75.7% for AGIs $50k-75k, 77.1% for AGIs $75k-100k, 63.5% for AGIs over 100k)
Taxable interest for individuals: $1,344 (reported on 70.5% of returns)
This zip code:
$1,344
Massachusetts:
$1,945
(% of AGI for various income ranges: 12.8% for AGIs below $10k, 4.3% for AGIs $10k-25k, 1.4% for AGIs $25k-50k, 1.3% for AGIs $50k-75k, 1.3% for AGIs $75k-100k, 0.9% for AGIs over 100k)
Taxable dividends: $3,440 (reported on 38.0% of returns)
Here:
$3,440
State:
$5,323
(% of AGI for various income ranges: 7.8% for AGIs below $10k, 4.0% for AGIs $10k-25k, 1.3% for AGIs $25k-50k, 0.9% for AGIs $50k-75k, 1.0% for AGIs $75k-100k, 1.8% for AGIs over 100k)
Net capital gain/loss: +$7,246 (reported on 31.6% of returns)
Here:
+$7,246
State:
+$20,377
(% of AGI for various income ranges: -2.6% for AGIs below $10k, -1.3% for AGIs $10k-25k, 0.6% for AGIs $25k-50k, 1.1% for AGIs $50k-75k, 1.0% for AGIs $75k-100k, 4.4% for AGIs over 100k)
Profit/loss from business: +$18,779 (reported on 19.6% of returns)
Here:
+$18,779
State:
+$17,837
(% of AGI for various income ranges: 8.4% for AGIs below $10k, 7.3% for AGIs $10k-25k, 7.1% for AGIs $25k-50k, 5.5% for AGIs $50k-75k, 7.2% for AGIs $75k-100k, 3.6% for AGIs over 100k)
Profit/loss from farming: +$143 (reported on 1.0% of returns)
Here:
+$143
State:
-$2,642
IRA payment deduction: $3,603 (reported on 4.7% of returns)
01503:
$3,603
Massachusetts:
$3,100
(% of AGI for various income ranges: 1.1% for AGIs $10k-25k, 0.5% for AGIs $50k-75k, 0.3% for AGIs $75k-100k, 0.1% for AGIs over 100k)
Self-employed pension: $13,444 (reported on 2.0% of returns)
Here:
$13,444
Massachusetts:
$14,516
Total itemized deductions: $23,001 (18% of AGI, reported on 50.1% of returns)
Here:
$23,001
State:
$22,573
Here:
18.1% of AGI
State:
19.5% of AGI
(% of AGI for various income ranges: 21.5% for AGIs below $10k, 18.9% for AGIs $10k-25k, 12.6% for AGIs $25k-50k, 17.4% for AGIs $50k-75k, 21.0% for AGIs $75k-100k, 13.3% for AGIs over 100k)
Charity contributions deductions: $2,760 (2% of AGI, reported on 46.0% of returns)
Here:
$2,760
State:
$3,295
Here:
2.1% of AGI
State:
2.7% of AGI
(% of AGI for various income ranges: 1.3% for AGIs below $10k, 1.2% for AGIs $10k-25k, 0.9% for AGIs $25k-50k, 1.8% for AGIs $50k-75k, 1.7% for AGIs $75k-100k, 1.8% for AGIs over 100k)
Total tax: $12,724 (reported on 84.9% of returns)
01503:
$12,724
State:
$11,494
(% of AGI for various income ranges: 3.9% for AGIs below $10k, 5.9% for AGIs $10k-25k, 8.6% for AGIs $25k-50k, 9.8% for AGIs $50k-75k, 10.3% for AGIs $75k-100k, 17.0% for AGIs over 100k)
Earned income credit: $1,453 (reported on 4.0% of returns)
Here:
$1,453
State:
$1,518
Percentage of individuals using paid preparers for their 2004 taxes: 56.8%
Here:
57%
State:
58%
(% for various income ranges: 49.1% for AGIs below $10k, 57.5% for AGIs $10k-25k, 54.7% for AGIs $25k-50k, 64.7% for AGIs $50k-75k, 54.9% for AGIs $75k-100k, 59.9% for AGIs over 100k)
Likely homosexual households (counted as self-reported same-sex unmarried-partner households)
Lesbian couples: 0.0% of all households
Gay men: 0.8% of all households
Household received Food Stamps/SNAP in the past 12 months: 101 Household did not receive Food Stamps/SNAP in the past 12 months: 1,337
Women who had a birth in the past 12 months: 30 (31 now married, 0 unmarried) Women who did not have a birth in the past 12 months: 622 (282 now married, 337 unmarried)
Housing units in zip code 01503 with a mortgage: 623 (76 second mortgage, 41 both second mortgage and home equity loan) Median monthly owner costs for units with a mortgage: $2,928 Median monthly owner costs for units without a mortgage: $1,060
Residents with income below the poverty level in 2022:
This zip code:
5.1%
Whole state:
10.4%
Residents with income below 50% of the poverty level in 2022:
This zip code:
3.6%
Whole state:
5.1%
Median number of rooms in houses and condos:
Here:
7.4
State:
6.5
Median number of rooms in apartments:
Here:
3.4
State:
4.0
Notable locations in this zip code not listed on our city pages
Notable locations in zip code 01503: Berlin Orchards (A), Pinecrest Country Club (B), Berlin Town Hall (C), Berlin Town Fire Department (D), Northbrook Greenhouses (E), Tolman Greenhouse (F). Display/hide their locations on the map
In group quarters: 6 (-1 institutionalized population)
Size of family households: 580 2-persons, 159 3-persons, 107 4-persons, 71 5-persons, 61 6-persons
Size of nonfamily households: 365 1-person, 111 2-persons, 8 3-persons
464 married couples with children.
63 single-parent households (30 men, 33 women).
91.6% of residents of 01503 zip code speak English at home.
0.5% of residents speak Spanish at home (100% very well).
4.8% of residents speak other Indo-European language at home (68% very well, 10% well, 10% not well, 12% not at all).
2.8% of residents speak Asian or Pacific Island language at home (87% very well, 13% not well).
0.4% of residents speak other language at home (100% very well).
Foreign born population: 269 (7.7%) (67.6% of them are naturalized citizens)
This zip code:
7.7%
Whole state:
18.0%
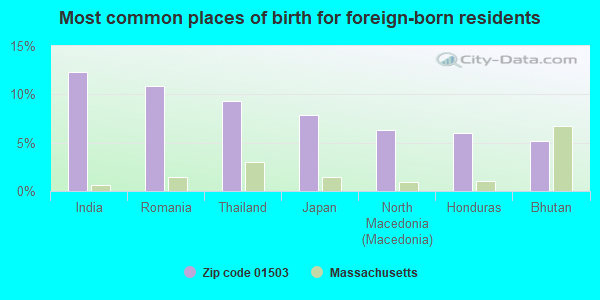
12%India
11%Romania
9%Thailand
8%Japan
6%North Macedonia (Macedonia)
6%Honduras
5%Bhutan
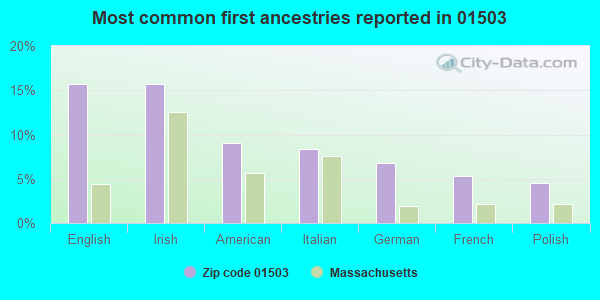
16%English
16%Irish
9%American
8%Italian
7%German
5%French
4%Polish
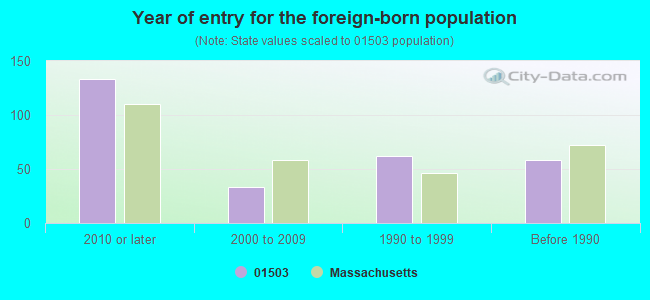
Year of entry for the foreign-born population
1332010 or later
332000 to 2009
621990 to 1999
58Before 1990
Facilities with environmental interests located in this zip code:
BERLIN EXXON (267 CENTRAL ST in BERLIN, MA)
STATE MASTER (MA-EPICS) - RCRAINFO-MAC300000213, HAZARDOUS WASTE PROGRAM Small Quantity Generators, between 100 kg and 1000 kg of hazardous waste/month (Resource Conservation and Recovery Act (tracking hazardous waste)) HAZARDOUS WASTE BIENNIAL REPORTER (Resource Conservation and Recovery Act (tracking hazardous waste)) (Resource Conservation and Recovery Act (tracking hazardous waste)) Organizations: EXXONMOBIL OIL CORPORATION (CONTACT/OPERATOR)
, CUMBERLAND FARMS INC (CONTACT/OPERATOR)
Alternative names: CUMBERLAND FARMS INC, EXXON COMPANY USA, EXXON CO USA 35744, EXXON DIV OF CFI 70003, EXXON RAS 35744
BERLIN MEMORIAL (34 SOUTH STREET in BERLIN, MA)
(National Center for Education Statistics) - STATE ID-028005
BERLIN STONE CO (332 SAWYER HILL RD in BERLIN, MA)
(Resource Conservation and Recovery Act (tracking hazardous waste)) Business NAICS classification: CRUSHED AND BROKEN GRANITE MINING AND QUARRYING.; ASPHALT PAVING MIXTURE AND BLOCK MANUFACTURING. Organizations: BU & PR: MASSACHUSETTS BROKEN STONE CO (CONTACT/OWNER)
KENS EXXON (CENTRAL ST RTE 62 AND 495 in BERLIN, MA)
(Resource Conservation and Recovery Act (tracking hazardous waste)) Organizations: EXXON COMPANY (CONTACT/OWNER)
ATLAS AUTO BODY (319 OLD CENTRAL ST in BERLIN, MA)
Conditionally Exempt Small Quantity Generators, less than 100 kg/month of hazardous waste (Resource Conservation and Recovery Act (tracking hazardous waste)) - notification Organizations: RICHARD BABINEAU (CONTACT/OWNER)
BENS SERVICE STATION (51 WEST ST in BERLIN, MA)
Small Quantity Generators, between 100 kg and 1000 kg of hazardous waste/month (Resource Conservation and Recovery Act (tracking hazardous waste)) - notification Organizations: PHILIP ZUKATYNSKI (CONTACT/OWNER)
BERLIN (BERLIN in BERLIN, MA)
AIR MINOR (AIRS/AFS) Business SIC classification: GENERAL GOVERNMENT
MASSACHUSETTS BROKEN STONE COMPANY (SAWYER HILL RD in BERLIN, MA)
AIR SYNTHETIC MINOR (AIRS/AFS) CRITERIA AND HAZARDOUS AIR POLLUTANT INVENTORY (Inventory of air pollution sources)
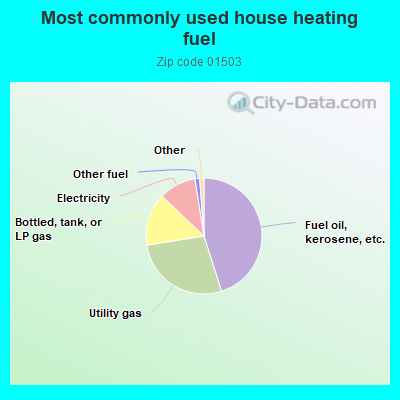
45.2%Fuel oil, kerosene, etc.
27.4%Utility gas
14.7%Bottled, tank, or LP gas
10.4%Electricity
1.3%Other fuel
0.6%Solar energy
0.6%Wood
Population in 1990: 2,293. Population change in the 1990s: +87 (+3.8%).
Place of birth for U.S.-born residents:
This state: 2,395
Northeast: 451
Midwest: 211
South: 59
West: 95
71% of the 01503 zip code residents lived in the same house 5 years ago. Out of people who lived in different houses, 32% lived in this county. Out of people who lived in different counties, 50% lived in Massachusetts.
89% of the 01503 zip code residents lived in the same house 1 year ago. Out of people who lived in different houses, 22% moved from this county. Out of people who lived in different houses, 44% moved from different county within same state. Out of people who lived in different houses, 38% moved from different state.
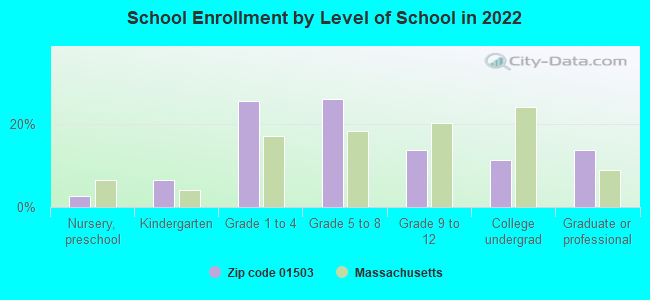
Private vs. public school enrollment:
Students in private schools in grades 1 to 8 (elementary and middle school): 58
Here:
16.2%
Massachusetts:
10.3%
Students in private schools in grades 9 to 12 (high school): 38
Here:
39.7%
Massachusetts:
12.3%
Students in private undergraduate colleges: 9
Here:
11.7%
Massachusetts:
51.2%
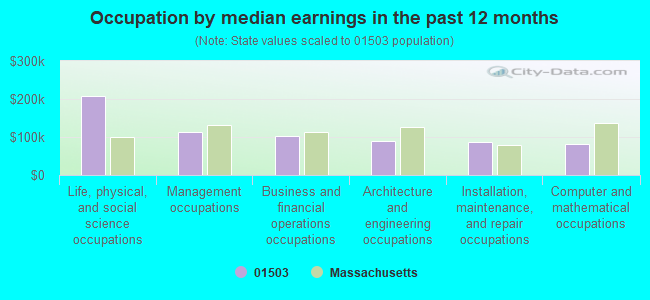
Occupation by median earnings in the past 12 months ($)
206,997Life, physical, and social science occupations
112,175Management occupations
103,374Business and financial operations occupations
90,198Architecture and engineering occupations
87,599Installation, maintenance, and repair occupations
82,184Computer and mathematical occupations
Companies with federal contracts located in this zip code:
COLLINS, SUZANNE (15 BOYLSTON RD in BERLIN, MA; small business)
$5,884 with Army for Technical Assistance. Signed on 2002-05-22. Completion date: 2002-09-30.
Top industries in this zip code by the number of employees in 2005:
Other Services (except Public Administration): Religious Organizations (10-19 employees: 1 establishment, 5-9 employees: 1 establishment)
Construction: Site Preparation Contractors (5-9: 1, 1-4: 4)
Construction: New Multifamily Housing Construction (except Operative Builders) (10-19: 1)
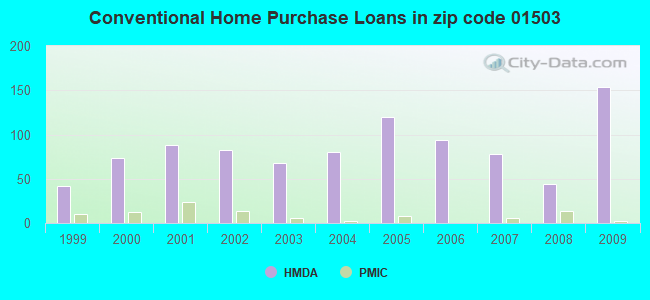
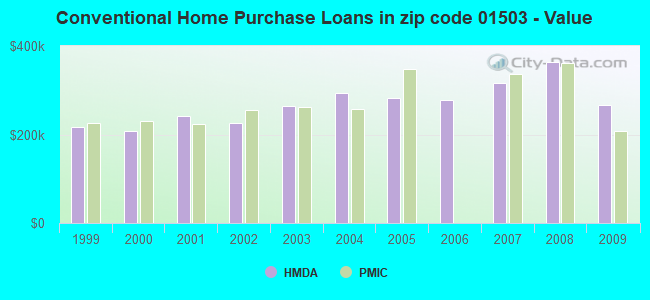
Detailed PMIC statistics for the following Tracts:7171.00
2002 - 2018 National Fire Incident Reporting System (NFIRS) incidents
Based on the data from the years 2002 - 2018 the average number of fires per year is 29. The highest number of reported fires - 47 took place in 2007, and the least - 11 in 2002. The data has a rising trend.
When looking into fire subcategories, the most reports belonged to: Outside Fires (38.9%), and Structure Fires (34.6%).
Fire incident types reported to NFIRS in Zip Code 01503


+$143
-$2,642
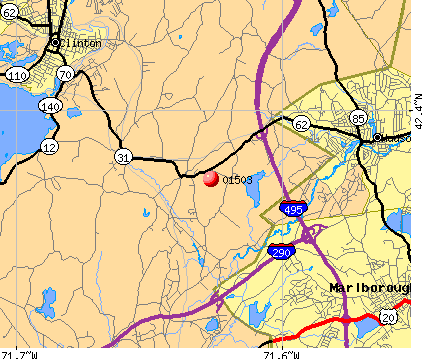 Nearest zip codes: 01510, 01532, 01740, 01561, 01505, 01749.


 Based on the data from the years 2002 - 2018 the average number of fires per year is 29. The highest number of reported fires - 47 took place in 2007, and the least - 11 in 2002. The data has a rising trend.
 When looking into fire subcategories, the most reports belonged to: Outside Fires (38.9%), and Structure Fires (34.6%).