Estimated zip code population in 2022: 3,174 Zip code population in 2010: 3,190 Zip code population in 2000: 2,724
Houses and condos: 1,331 Renter-occupied apartments: 183
% of renters here:
14%
State:
38%
March 2022 cost of living index in zip code 01529: 125.8 (high, U.S. average is 100)
Land area: 4.9 sq. mi. Water area: 0.1 sq. mi.
Population density: 647 people per square mile
(low).
OSM Map
Google Map
MSN Map
OSM Map
General Map
Google Map
MSN Map
OSM Map
Google Map
MSN Map
OSM Map
Google Map
MSN Map
Please wait while loading the map...
Real estate property taxes paid for housing units in 2022:
This zip code:
1.2% ($4,973)
Massachusetts:
1.0% ($5,536)
Median real estate property taxes paid for housing units with mortgages in 2022: $4,753 (1.2%) Median real estate property taxes paid for housing units with no mortgage in 2022: $6,082 (1.3%)
Business Search- 14 Million verified businesses
Males: 1,576
(49.6%)
Females: 1,598
(50.4%)
For population 25 years and over in 01529:
High school or higher: 91.9%
Bachelor's degree or higher: 30.3%
Graduate or professional degree: 9.2%
Unemployed: 2.2%
Mean travel time to work (commute): 29.4 minutes
For population 15 years and over in 01529:
Never married: 26.3%
Now married: 59.9%
Separated: 0.4%
Widowed: 4.4%
Divorced: 9.0%
Zip code 01529 compared to state average:
Unemployed percentage below state average.
Black race population percentage significantly below state average.
Hispanic race population percentage significantly below state average.
Median age above state average.
Foreign-born population percentage significantly below state average.
Renting percentage significantly below state average.
Length of stay since moving in significantly above state average.
Estimated median house/condo value in 2022: $421,992
01529:
$421,992
Massachusetts:
$534,700
Median resident age:
This zip code:
48.3 years
Massachusetts median age:
40.3 years
Average household size:
This zip code:
2.4 people
Massachusetts:
2.4 people
Averages for the 2020 tax year for zip code 01529, filed in 2021:
Average Adjusted Gross Income (AGI) in 2020: $71,865 (Individual Income Tax Returns)
Here:
$71,865
State:
$105,130
Salary/wage: $67,063 (reported on 85.8% of returns)
Here:
$67,063
State:
$82,951
(% of AGI for various income ranges: 1201.9% for AGIs below $25k, 3888.9% for AGIs $25k-50k, 6313.3% for AGIs $50k-75k, 9112.3% for AGIs $75k-100k, 19106.5% for AGIs $100k-200k, 48272.5% for AGIs over 200k)
Taxable interest for individuals: $580 (reported on 32.0% of returns)
This zip code:
$580
Massachusetts:
$2,361
(% of AGI for various income ranges: 7.7% for AGIs below $25k, 12.9% for AGIs $25k-50k, 16.2% for AGIs $50k-75k, 20.0% for AGIs $75k-100k, 57.5% for AGIs $100k-200k, 195.0% for AGIs over 200k)
Ordinary dividends: $1,808 (reported on 14.2% of returns)
Here:
$1,808
State:
$10,365
(% of AGI for various income ranges: 3.5% for AGIs below $25k, 7.5% for AGIs $25k-50k, 13.3% for AGIs $50k-75k, 58.5% for AGIs $75k-100k, 96.5% for AGIs $100k-200k, 262.5% for AGIs over 200k)
Net capital gain/loss in AGI: +$6,210 (reported on 12.4% of returns)
Here:
+$6,210
State:
+$48,178
(% of AGI for various income ranges: 6.1% for AGIs $25k-50k, 50.0% for AGIs $50k-75k, 345.0% for AGIs $100k-200k, 1250.0% for AGIs over 200k)
Profit/loss from business: +$9,771 (reported on 12.4% of returns)
Here:
+$9,771
State:
+$20,792
(% of AGI for various income ranges: 82.6% for AGIs below $25k, 169.3% for AGIs $25k-50k, 90.5% for AGIs $50k-75k, 302.3% for AGIs $75k-100k, 276.0% for AGIs $100k-200k, 467.5% for AGIs over 200k)
Taxable individual retirement arrangement distribution: $12,736 (reported on 6.5% of returns)
01529:
$12,736
Massachusetts:
$22,790
(% of AGI for various income ranges: 63.5% for AGIs below $25k, 51.8% for AGIs $25k-50k, 257.6% for AGIs $50k-75k, 259.0% for AGIs $100k-200k)
Total itemized deductions: $23,100 (reported on 9.5% of returns)
Here:
$23,100
State:
$36,722
(% of AGI for various income ranges: 153.5% for AGIs below $25k, 320.5% for AGIs $50k-75k, 474.6% for AGIs $75k-100k, 965.0% for AGIs $100k-200k)
Charity contributions: $4,070 (reported on 5.9% of returns)
Here:
$4,070
State:
$12,529
(% of AGI for various income ranges: 31.9% for AGIs $50k-75k, 170.0% for AGIs $100k-200k)
Taxes paid: $7,825 (reported on 9.5% of returns)
01529:
$7,825
State:
$8,782
(% of AGI for various income ranges: 44.2% for AGIs below $25k, 118.6% for AGIs $50k-75k, 155.4% for AGIs $75k-100k, 332.0% for AGIs $100k-200k)
Earned income credit: $1,755 (reported on 6.5% of returns)
Here:
$1,755
State:
$1,909
(% of AGI for various income ranges: 35.5% for AGIs below $25k, 29.6% for AGIs $25k-50k)
Percentage of individuals using paid preparers for their 2020 taxes: 92.9%
Here:
93%
State:
92%
(% for various income ranges: 93.3% for AGIs below $25k, 94.6% for AGIs $25k-50k, 88.9% for AGIs $50k-75k, 94.4% for AGIs $75k-100k, 94.1% for AGIs $100k-200k, 87.5% for AGIs over 200k)
Averages for the 2012 tax year for zip code 01529, filed in 2013:
Average Adjusted Gross Income (AGI) in 2012: $59,926 (Individual Income Tax Returns)
Here:
$59,926
State:
$81,425
Salary/wage: $55,761 (reported on 91.6% of returns)
Here:
$55,761
State:
$64,752
(% of AGI for various income ranges: 78.9% for AGIs below $25k, 82.3% for AGIs $25k-50k, 81.3% for AGIs $50k-75k, 87.0% for AGIs $75k-100k, 89.9% for AGIs $100k-200k, 81.7% for AGIs over 200k)
Taxable interest for individuals: $385 (reported on 38.7% of returns)
This zip code:
$385
Massachusetts:
$2,136
(% of AGI for various income ranges: 0.4% for AGIs below $25k, 0.3% for AGIs $25k-50k, 0.2% for AGIs $50k-75k, 0.4% for AGIs $100k-200k, 0.1% for AGIs over 200k)
Ordinary dividends: $904 (reported on 16.8% of returns)
Here:
$904
State:
$9,473
(% of AGI for various income ranges: 0.6% for AGIs below $25k, 0.4% for AGIs $25k-50k, 0.1% for AGIs $75k-100k, 0.2% for AGIs $100k-200k, 0.4% for AGIs over 200k)
Net capital gain/loss in AGI: +$1,006 (reported on 11.0% of returns)
Here:
+$1,006
State:
+$31,437
(% of AGI for various income ranges: 0.2% for AGIs $100k-200k, 1.1% for AGIs over 200k)
Profit/loss from business: +$9,805 (reported on 13.5% of returns)
Here:
+$9,805
State:
+$20,662
(% of AGI for various income ranges: 3.6% for AGIs below $25k, 3.7% for AGIs $25k-50k, 4.0% for AGIs $50k-75k, 3.5% for AGIs $75k-100k, 0.9% for AGIs $100k-200k)
Taxable individual retirement arrangement distribution: $14,670 (reported on 6.5% of returns)
01529:
$14,670
Massachusetts:
$18,892
(% of AGI for various income ranges: 2.3% for AGIs below $25k, 1.5% for AGIs $25k-50k, 3.5% for AGIs $50k-75k, 2.0% for AGIs $100k-200k)
Total itemized deductions: $20,610 (21% of AGI, reported on 44.5% of returns)
Here:
$20,610
State:
$28,907
Here:
21.0% of AGI
State:
18.2% of AGI
(% of AGI for various income ranges: 9.6% for AGIs below $25k, 12.1% for AGIs $25k-50k, 17.6% for AGIs $50k-75k, 17.6% for AGIs $75k-100k, 16.6% for AGIs $100k-200k, 12.5% for AGIs over 200k)
Charity contributions: $1,596 (reported on 35.5% of returns)
Here:
$1,596
State:
$4,208
(% of AGI for various income ranges: 0.3% for AGIs below $25k, 0.6% for AGIs $25k-50k, 1.0% for AGIs $50k-75k, 0.8% for AGIs $75k-100k, 1.1% for AGIs $100k-200k, 1.1% for AGIs over 200k)
Taxes paid: $8,819 (reported on 44.5% of returns)
01529:
$8,819
State:
$13,303
(% of AGI for various income ranges: 2.6% for AGIs below $25k, 3.5% for AGIs $25k-50k, 6.4% for AGIs $50k-75k, 7.3% for AGIs $75k-100k, 7.8% for AGIs $100k-200k, 7.3% for AGIs over 200k)
Earned income credit: $1,893 (reported on 9.0% of returns)
Here:
$1,893
State:
$1,971
(% of AGI for various income ranges: 2.9% for AGIs below $25k, 0.8% for AGIs $25k-50k)
Percentage of individuals using paid preparers for their 2012 taxes: 55.5%
Here:
55%
State:
56%
(% for various income ranges: 47.1% for AGIs below $25k, 57.6% for AGIs $25k-50k, 56.5% for AGIs $50k-75k, 61.1% for AGIs $75k-100k, 64.0% for AGIs $100k-200k, 60.0% for AGIs over 200k)
Averages for the 2004 tax year for zip code 01529, filed in 2005:
Average Adjusted Gross Income (AGI) in 2004: $49,281 (Individual Income Tax Returns)
Here:
$49,281
State:
$62,877
Salary/wage: $47,089 (reported on 92.2% of returns)
Here:
$47,089
State:
$52,969
(% of AGI for various income ranges: 101.3% for AGIs below $10k, 77.8% for AGIs $10k-25k, 85.8% for AGIs $25k-50k, 86.0% for AGIs $50k-75k, 89.8% for AGIs $75k-100k, 91.8% for AGIs over 100k)
Taxable interest for individuals: $452 (reported on 50.7% of returns)
This zip code:
$452
Massachusetts:
$1,945
(% of AGI for various income ranges: 1.9% for AGIs below $10k, 1.1% for AGIs $10k-25k, 0.3% for AGIs $25k-50k, 0.9% for AGIs $50k-75k, 0.2% for AGIs $75k-100k, 0.2% for AGIs over 100k)
Taxable dividends: $576 (reported on 18.2% of returns)
Here:
$576
State:
$5,323
(% of AGI for various income ranges: 0.7% for AGIs below $10k, 0.4% for AGIs $10k-25k, 0.4% for AGIs $25k-50k, 0.1% for AGIs $50k-75k, 0.2% for AGIs $75k-100k, 0.1% for AGIs over 100k)
Net capital gain/loss: +$309 (reported on 12.3% of returns)
Here:
+$309
State:
+$20,377
(% of AGI for various income ranges: -1.3% for AGIs below $10k, 0.3% for AGIs $10k-25k, -0.1% for AGIs $25k-50k, 0.3% for AGIs $50k-75k, -0.1% for AGIs $75k-100k, 0.1% for AGIs over 100k)
Profit/loss from business: +$13,619 (reported on 13.4% of returns)
Here:
+$13,619
State:
+$17,837
(% of AGI for various income ranges: 6.0% for AGIs below $10k, 2.5% for AGIs $10k-25k, 3.2% for AGIs $25k-50k, 4.8% for AGIs $50k-75k, 4.9% for AGIs $75k-100k, 2.4% for AGIs over 100k)
IRA payment deduction: $2,759 (reported on 2.0% of returns)
01529:
$2,759
Massachusetts:
$3,100
Total itemized deductions: $18,299 (24% of AGI, reported on 49.1% of returns)
Here:
$18,299
State:
$22,573
Here:
24.2% of AGI
State:
19.5% of AGI
(% of AGI for various income ranges: 15.9% for AGIs below $10k, 12.7% for AGIs $10k-25k, 14.7% for AGIs $25k-50k, 20.8% for AGIs $50k-75k, 22.0% for AGIs $75k-100k, 17.0% for AGIs over 100k)
Charity contributions deductions: $1,518 (2% of AGI, reported on 43.7% of returns)
Here:
$1,518
State:
$3,295
Here:
2.0% of AGI
State:
2.7% of AGI
(% of AGI for various income ranges: 1.0% for AGIs $10k-25k, 1.0% for AGIs $25k-50k, 1.3% for AGIs $50k-75k, 1.4% for AGIs $75k-100k, 1.6% for AGIs over 100k)
Total tax: $5,914 (reported on 82.8% of returns)
01529:
$5,914
State:
$11,494
(% of AGI for various income ranges: 2.4% for AGIs below $10k, 5.0% for AGIs $10k-25k, 7.4% for AGIs $25k-50k, 7.9% for AGIs $50k-75k, 8.9% for AGIs $75k-100k, 15.4% for AGIs over 100k)
Earned income credit: $1,417 (reported on 8.7% of returns)
Here:
$1,417
State:
$1,518
Percentage of individuals using paid preparers for their 2004 taxes: 58.7%
Here:
59%
State:
58%
(% for various income ranges: 45.8% for AGIs below $10k, 53.7% for AGIs $10k-25k, 57.1% for AGIs $25k-50k, 65.8% for AGIs $50k-75k, 68.3% for AGIs $75k-100k, 67.8% for AGIs over 100k)
Household received Food Stamps/SNAP in the past 12 months: 67 Household did not receive Food Stamps/SNAP in the past 12 months: 1,209
Women who had a birth in the past 12 months: 23 (12 now married, 10 unmarried) Women who did not have a birth in the past 12 months: 654 (315 now married, 334 unmarried)
Housing units in zip code 01529 with a mortgage: 763 (101 second mortgage, 4 home equity loan, 85 both second mortgage and home equity loan) Houses without a mortgage: 16
Median monthly owner costs for units with a mortgage: $2,192 Median monthly owner costs for units without a mortgage: $860
Residents with income below the poverty level in 2022:
This zip code:
8.1%
Whole state:
10.4%
Residents with income below 50% of the poverty level in 2022:
This zip code:
4.9%
Whole state:
5.1%
Median number of rooms in houses and condos:
Here:
6.6
State:
6.5
Median number of rooms in apartments:
Here:
4.5
State:
4.0
Notable locations in this zip code not listed on our city pages
Notable locations in zip code 01529: Millville Fire Department Station 1 Headquarters (A), Millville Fire Department Station 2 (B), Chestnut Hill Meeting House (C), Millville Free Public Library (D), Chestnut Hill Community Center (E). Display/hide their locations on the map
In group quarters: 4 (-1 institutionalized population)
Size of family households: 440 2-persons, 249 3-persons, 131 4-persons, 58 5-persons, 28 6-persons, 4 7-or-more-persons
Size of nonfamily households: 290 1-person, 92 2-persons, 5 3-persons
404 married couples with children.
130 single-parent households (14 men, 116 women).
86.5% of residents of 01529 zip code speak English at home.
0.8% of residents speak Spanish at home (100% very well).
11.3% of residents speak other Indo-European language at home (97% very well, 3% not well).
0.2% of residents speak Asian or Pacific Island language at home (100% very well).
0.5% of residents speak other language at home (100% well).
Foreign born population: 201 (6.3%) (62.7% of them are naturalized citizens)
This zip code:
6.3%
Whole state:
18.0%
19%Serbia
11%North Macedonia (Macedonia)
10%Japan
8%Egypt
7%Mexico
15%French Canadian
12%Irish
11%Canadian
10%French
6%European
6%English
6%Italian
Year of entry for the foreign-born population
182010 or later
312000 to 2009
581990 to 1999
114Before 1990
Facilities with environmental interests located in this zip code:
MILLVILLE ELEM (122 BERTHELETTE WAY in MILLVILLE, MA)
(National Center for Education Statistics) - STATE ID-622010 Organizations: BLACKSTONE-MILLVILLE (SCHOOL DISTRICT)
ALGONQUIN GAS TRANSMISSION CO VALVE 39 (KEMPTON RD in MILLVILLE, MA)
Small Quantity Generators, between 100 kg and 1000 kg of hazardous waste/month (Resource Conservation and Recovery Act (tracking hazardous waste)) - notification Organizations: DUKE ENERGY CORP VAVLE 39 (CONTACT/OPERATOR)
, ALGONQUIN GAS TRANSMISSION COMPANY (CONTACT/OWNER)
MILLVILLE (MILLVILLE in MILLVILLE, MA)
AIR MINOR (AIRS/AFS) Business SIC classification: GENERAL GOVERNMENT
BLACKSTONE MILLVILLE REGNL HIGH SCHOOL (175 LINCOLN ST in MILLVILLE, MA)
COMPLIANCE ACTIVITY (Tracking inspections of insecticide, fungicide, and rodenticide, and toxic substances)
MILLVILLE LANDFILL (RTE 122 in MILLVILLE, MA)
CRITERIA AND HAZARDOUS AIR POLLUTANT INVENTORY (Inventory of air pollution sources) Business SIC classification: REFUSE SYSTEMS Business NAICS classification: SOLID WASTE LANDFILL.
KEMPTON ROAD (KEMPTON ROAD in MILLVILLE, MA)
SUPERFUND (Superfund database) Alternative names: KEMPTON ROAD SITE, MILLVILLE SITE
Housing units lacking complete plumbing facilities: 1.9% Housing units lacking complete kitchen facilities: 1.0%
80.7%Fuel oil, kerosene, etc.
6.1%Other fuel
4.2%Bottled, tank, or LP gas
4.1%Utility gas
2.9%Wood
2.2%Electricity
Population in 1990: 2,236. Population change in the 1990s: +488 (+21.8%).
Place of birth for U.S.-born residents:
This state: 1,391
Northeast: 1,212
Midwest: 78
South: 196
West: 68
62% of the 01529 zip code residents lived in the same house 5 years ago. Out of people who lived in different houses, 54% lived in this county. Out of people who lived in different counties, 50% lived in Massachusetts.
97% of the 01529 zip code residents lived in the same house 1 year ago. Out of people who lived in different houses, 34% moved from this county. Out of people who lived in different houses, 35% moved from different county within same state. Out of people who lived in different houses, 27% moved from different state. Out of people who lived in different houses, 11% moved from abroad.
Private vs. public school enrollment:
Students in private schools in grades 1 to 8 (elementary and middle school): 121
Here:
45.9%
Massachusetts:
10.3%
Students in private schools in grades 9 to 12 (high school): 44
Here:
18.8%
Massachusetts:
12.3%
Students in private undergraduate colleges: 41
Here:
32.3%
Massachusetts:
51.2%
Occupation by median earnings in the past 12 months ($)
104,302Management occupations
94,275Law enforcement workers including supervisors
94,183Architecture and engineering occupations
90,173Business and financial operations occupations
86,360Installation, maintenance, and repair occupations
82,819Health diagnosing and treating practitioners and other technical occupations
Companies with federal contracts located in this zip code:
ALCONADA, SCOTT (83 HOPE ST APT 3 in MILLVILLE, MA; small business) : $28,205 in 2 contractsin 2002
$17,297 with Army for Personal Services Contracts. Signed on 2002-08-27. Completion date: 2003-06-23.
$10,908, same as above.Signed on 2002-06-20. Completion date: 2003-06-23.
MARCOTHE, RENE E CUSTOM WELDIN (44 IRONSTONE ST in MILLVILLE, MA; small business) : $7,258 in 4 contractsfrom 2005 to 2006
$2,500 with Army for Maintenance, Repair and Rebuilding of Equipment -- Miscellaneous. Signed on 2006-02-09. Completion date: 2007-01-31.
$2,500 with Army for Maintenance, Repair or Alteration of Real Property -- Exhibit Design (Non-Building). Signed on 2005-05-27. Completion date: 2005-09-30.
$2,500 with U.S. Army Corps of Engineers - civil program financing only for Maintenance, Repair or Alteration of Real Property -- Exhibit Design (Non-Building). Signed on 2005-05-27. Completion date: 2005-09-30.
-$242 with Army for Maintenance, Repair or Alteration of Real Property -- Exhibit Design (Non-Building). Signed on 2006-05-15. Completion date: 2005-09-30.
Top industries in this zip code by the number of employees in 2005:
Administrative and Support and Waste Management and Remediation Services: Landscaping Services (10-19 employees: 1 establishment, 1-4 employees: 3 establishments)
Accommodation and Food Services: Limited-Service Restaurants (5-9: 1)
Finance and Insurance: Real Estate Credit (5-9: 1)
Other Services (except Public Administration): Religious Organizations (5-9: 1)
Construction: New Single-Family Housing Construction (except Operative Builders) (1-4: 3)
Other Services (except Public Administration): General Automotive Repair (1-4: 2)
Other Services (except Public Administration): Commercial and Industrial Machinery and Equipment (except Automotive and Electronic) Repair and Maintenance (1-4: 2)
Construction: Plumbing, Heating, and Air-Conditioning Contractors (1-4: 2)
People in group quarters in 2010:
2 people in other noninstitutional facilities
Fatal accident statistics in 2011:
Fatal accident count: 1
Vehicles involved in fatal accidents: 1
Fatal accidents caused by drunken drivers: 1
Fatalities: 1
Persons involved in fatal accidents: 1
Pedestrians involved in fatal accidents: 0
Fatal accident statistics in 2010:
Fatal accident count: 1
Vehicles involved in fatal accidents: 1
Fatal accidents caused by drunken drivers: 1
Fatalities: 1
Persons involved in fatal accidents: 1
Pedestrians involved in fatal accidents: 0
Home Mortgage Disclosure Act Aggregated Statistics For Year 2009 (Based on 4 partial tracts)
A) FHA, FSA/RHS & VA Home Purchase Loans
B) Conventional Home Purchase Loans
C) Refinancings
D) Home Improvement Loans
F) Non-occupant Loans on < 5 Family Dwellings (A B C & D)
Number
Average Value
Number
Average Value
Number
Average Value
Number
Average Value
Number
Average Value
LOANS ORIGINATED
24
$215,846
30
$204,808
207
$203,976
10
$53,814
2
$252,315
APPLICATIONS APPROVED, NOT ACCEPTED
6
$178,722
2
$107,430
10
$174,845
0
$0
2
$107,430
APPLICATIONS DENIED
4
$252,808
2
$65,050
65
$227,022
0
$0
0
$0
APPLICATIONS WITHDRAWN
2
$273,995
2
$177,410
47
$228,743
6
$143,568
0
$0
FILES CLOSED FOR INCOMPLETENESS
0
$0
0
$0
22
$227,942
2
$172,480
0
$0
Aggregated Statistics For Year 2008 (Based on 4 partial tracts)
A) FHA, FSA/RHS & VA Home Purchase Loans
B) Conventional Home Purchase Loans
C) Refinancings
D) Home Improvement Loans
F) Non-occupant Loans on < 5 Family Dwellings (A B C & D)
G) Loans On Manufactured Home Dwelling (A B C & D)
Number
Average Value
Number
Average Value
Number
Average Value
Number
Average Value
Number
Average Value
Number
Average Value
LOANS ORIGINATED
24
$204,840
49
$303,645
116
$196,865
16
$119,628
2
$221,760
0
$0
APPLICATIONS APPROVED, NOT ACCEPTED
0
$0
0
$0
8
$294,201
2
$12,815
0
$0
0
$0
APPLICATIONS DENIED
0
$0
12
$277,447
77
$249,242
8
$37,699
8
$114,576
2
$98,560
APPLICATIONS WITHDRAWN
0
$0
8
$269,561
35
$272,251
2
$44,350
2
$236,545
0
$0
FILES CLOSED FOR INCOMPLETENESS
0
$0
4
$368,122
6
$303,565
4
$65,542
0
$0
0
$0
Aggregated Statistics For Year 2007 (Based on 4 partial tracts)
A) FHA, FSA/RHS & VA Home Purchase Loans
B) Conventional Home Purchase Loans
C) Refinancings
D) Home Improvement Loans
E) Loans on Dwellings For 5+ Families
F) Non-occupant Loans on < 5 Family Dwellings (A B C & D)
G) Loans On Manufactured Home Dwelling (A B C & D)
Number
Average Value
Number
Average Value
Number
Average Value
Number
Average Value
Number
Average Value
Number
Average Value
Number
Average Value
LOANS ORIGINATED
6
$195,807
67
$212,537
166
$191,860
55
$92,467
2
$344,960
10
$131,873
2
$103,490
APPLICATIONS APPROVED, NOT ACCEPTED
0
$0
8
$160,652
39
$223,756
8
$69,731
0
$0
4
$170,015
0
$0
APPLICATIONS DENIED
0
$0
22
$143,360
106
$192,824
26
$45,868
0
$0
4
$156,218
0
$0
APPLICATIONS WITHDRAWN
2
$242,460
6
$75,892
53
$204,633
6
$26,940
0
$0
4
$72,935
2
$202,050
FILES CLOSED FOR INCOMPLETENESS
0
$0
4
$322,785
28
$179,943
0
$0
0
$0
2
$234,575
0
$0
Aggregated Statistics For Year 2006 (Based on 4 partial tracts)
A) FHA, FSA/RHS & VA Home Purchase Loans
B) Conventional Home Purchase Loans
C) Refinancings
D) Home Improvement Loans
E) Loans on Dwellings For 5+ Families
F) Non-occupant Loans on < 5 Family Dwellings (A B C & D)
Number
Average Value
Number
Average Value
Number
Average Value
Number
Average Value
Number
Average Value
Number
Average Value
LOANS ORIGINATED
0
$0
79
$202,809
201
$186,411
59
$115,599
2
$197,120
16
$171,371
APPLICATIONS APPROVED, NOT ACCEPTED
0
$0
6
$210,262
39
$167,704
4
$34,990
0
$0
0
$0
APPLICATIONS DENIED
0
$0
22
$217,728
146
$204,640
28
$106,445
0
$0
12
$166,402
APPLICATIONS WITHDRAWN
2
$237,530
10
$179,971
103
$179,743
2
$15,770
0
$0
4
$137,490
FILES CLOSED FOR INCOMPLETENESS
0
$0
0
$0
22
$212,710
0
$0
0
$0
0
$0
Aggregated Statistics For Year 2005 (Based on 4 partial tracts)
A) FHA, FSA/RHS & VA Home Purchase Loans
B) Conventional Home Purchase Loans
C) Refinancings
D) Home Improvement Loans
F) Non-occupant Loans on < 5 Family Dwellings (A B C & D)
G) Loans On Manufactured Home Dwelling (A B C & D)
Number
Average Value
Number
Average Value
Number
Average Value
Number
Average Value
Number
Average Value
Number
Average Value
LOANS ORIGINATED
4
$212,398
128
$186,756
286
$184,032
43
$147,748
18
$217,051
0
$0
APPLICATIONS APPROVED, NOT ACCEPTED
0
$0
12
$224,388
30
$170,837
2
$34,495
4
$132,562
2
$121,230
APPLICATIONS DENIED
2
$179,380
18
$166,676
112
$190,256
16
$98,929
8
$220,528
0
$0
APPLICATIONS WITHDRAWN
0
$0
30
$170,640
99
$210,421
10
$118,863
4
$244,922
0
$0
FILES CLOSED FOR INCOMPLETENESS
0
$0
6
$181,678
24
$271,861
0
$0
6
$423,152
0
$0
Aggregated Statistics For Year 2004 (Based on 4 partial tracts)
A) FHA, FSA/RHS & VA Home Purchase Loans
B) Conventional Home Purchase Loans
C) Refinancings
D) Home Improvement Loans
F) Non-occupant Loans on < 5 Family Dwellings (A B C & D)
G) Loans On Manufactured Home Dwelling (A B C & D)
Number
Average Value
Number
Average Value
Number
Average Value
Number
Average Value
Number
Average Value
Number
Average Value
LOANS ORIGINATED
10
$195,740
132
$197,553
327
$180,742
43
$70,551
10
$156,316
0
$0
APPLICATIONS APPROVED, NOT ACCEPTED
0
$0
12
$188,085
35
$187,658
4
$104,472
2
$351,860
0
$0
APPLICATIONS DENIED
2
$168,540
32
$187,757
106
$176,199
30
$97,180
12
$289,273
2
$49,280
APPLICATIONS WITHDRAWN
0
$0
16
$201,678
77
$183,962
0
$0
10
$255,270
0
$0
FILES CLOSED FOR INCOMPLETENESS
0
$0
0
$0
59
$179,713
2
$24,640
2
$261,185
0
$0
Aggregated Statistics For Year 2003 (Based on 4 partial tracts)
A) FHA, FSA/RHS & VA Home Purchase Loans
B) Conventional Home Purchase Loans
C) Refinancings
D) Home Improvement Loans
F) Non-occupant Loans on < 5 Family Dwellings (A B C & D)
Number
Average Value
Number
Average Value
Number
Average Value
Number
Average Value
Number
Average Value
LOANS ORIGINATED
6
$204,677
142
$189,971
716
$154,483
16
$79,957
18
$121,557
APPLICATIONS APPROVED, NOT ACCEPTED
0
$0
12
$230,302
75
$152,308
6
$40,410
4
$133,550
APPLICATIONS DENIED
2
$166,565
14
$164,173
168
$182,195
6
$22,340
14
$183,885
APPLICATIONS WITHDRAWN
6
$208,618
12
$166,731
95
$156,161
6
$23,327
4
$60,122
FILES CLOSED FOR INCOMPLETENESS
0
$0
4
$156,710
8
$178,148
0
$0
0
$0
Aggregated Statistics For Year 2002 (Based on 4 partial tracts)
A) FHA, FSA/RHS & VA Home Purchase Loans
B) Conventional Home Purchase Loans
C) Refinancings
D) Home Improvement Loans
F) Non-occupant Loans on < 5 Family Dwellings (A B C & D)
Number
Average Value
Number
Average Value
Number
Average Value
Number
Average Value
Number
Average Value
LOANS ORIGINATED
18
$133,494
101
$190,543
483
$143,412
41
$35,337
14
$87,859
APPLICATIONS APPROVED, NOT ACCEPTED
4
$166,568
14
$164,032
65
$139,167
2
$29,570
0
$0
APPLICATIONS DENIED
2
$82,790
10
$130,691
77
$127,258
12
$57,986
4
$196,628
APPLICATIONS WITHDRAWN
0
$0
12
$201,227
108
$138,550
2
$31,540
2
$90,675
FILES CLOSED FOR INCOMPLETENESS
0
$0
4
$131,578
12
$135,848
2
$65,050
0
$0
Aggregated Statistics For Year 2001 (Based on 4 partial tracts)
A) FHA, FSA/RHS & VA Home Purchase Loans
B) Conventional Home Purchase Loans
C) Refinancings
D) Home Improvement Loans
F) Non-occupant Loans on < 5 Family Dwellings (A B C & D)
Number
Average Value
Number
Average Value
Number
Average Value
Number
Average Value
Number
Average Value
LOANS ORIGINATED
22
$135,027
130
$161,593
349
$123,293
30
$41,658
12
$110,058
APPLICATIONS APPROVED, NOT ACCEPTED
4
$145,375
10
$94,026
35
$101,714
20
$52,631
2
$82,790
APPLICATIONS DENIED
2
$118,270
10
$148,628
110
$102,932
26
$41,319
6
$89,690
APPLICATIONS WITHDRAWN
4
$121,722
0
$0
69
$109,444
8
$39,424
2
$124,185
FILES CLOSED FOR INCOMPLETENESS
0
$0
2
$83,775
4
$93,632
4
$22,175
2
$19,710
Aggregated Statistics For Year 2000 (Based on 4 partial tracts)
A) FHA, FSA/RHS & VA Home Purchase Loans
B) Conventional Home Purchase Loans
C) Refinancings
D) Home Improvement Loans
F) Non-occupant Loans on < 5 Family Dwellings (A B C & D)
Number
Average Value
Number
Average Value
Number
Average Value
Number
Average Value
Number
Average Value
LOANS ORIGINATED
16
$118,149
83
$128,603
77
$90,803
20
$24,246
4
$89,198
APPLICATIONS APPROVED, NOT ACCEPTED
0
$0
10
$113,738
14
$64,064
8
$26,611
0
$0
APPLICATIONS DENIED
0
$0
18
$154,849
35
$85,775
24
$38,274
0
$0
APPLICATIONS WITHDRAWN
4
$80,820
8
$96,342
32
$89,505
8
$61,846
4
$48,295
FILES CLOSED FOR INCOMPLETENESS
0
$0
2
$70,965
10
$177,014
2
$29,570
0
$0
Aggregated Statistics For Year 1999 (Based on 2 partial tracts)
A) FHA, FSA/RHS & VA Home Purchase Loans
B) Conventional Home Purchase Loans
C) Refinancings
D) Home Improvement Loans
F) Non-occupant Loans on < 5 Family Dwellings (A B C & D)
Detailed PMIC statistics for the following Tracts:7481.00
2002 - 2018 National Fire Incident Reporting System (NFIRS) incidents
Based on the data from the years 2002 - 2018 the average number of fires per year is 13. The highest number of reported fires - 28 took place in 2002, and the least - 2 in 2014. The data has a declining trend.
When looking into fire subcategories, the most reports belonged to: Structure Fires (48.4%), and Outside Fires (42.3%).
Fire incident types reported to NFIRS in Zip Code 01529


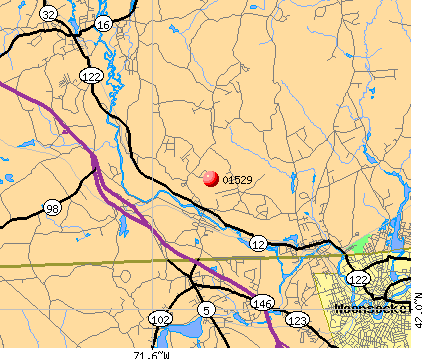 Nearest zip codes: 02876, 01504, 01569, 01756, 02896, 02895.


 Based on the data from the years 2002 - 2018 the average number of fires per year is 13. The highest number of reported fires - 28 took place in 2002, and the least - 2 in 2014. The data has a declining trend.
 When looking into fire subcategories, the most reports belonged to: Structure Fires (48.4%), and Outside Fires (42.3%).