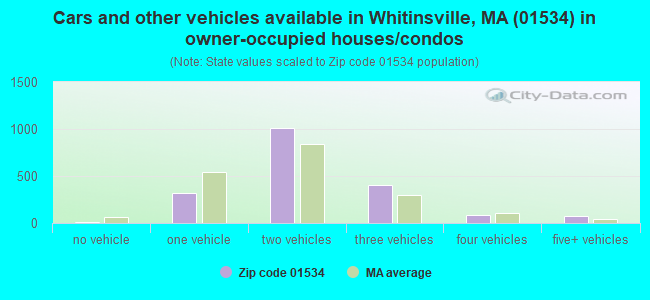
Estimated zip code population in 2022: 5,891 Zip code population in 2010: 5,631 Zip code population in 2000: 4,742
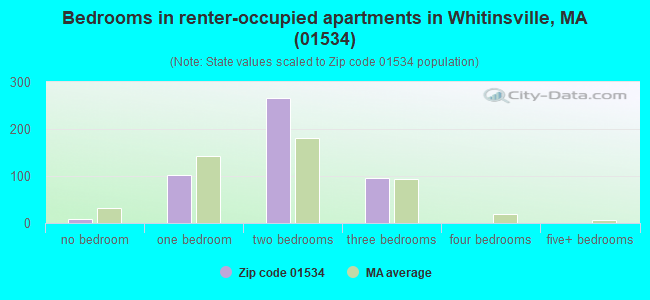
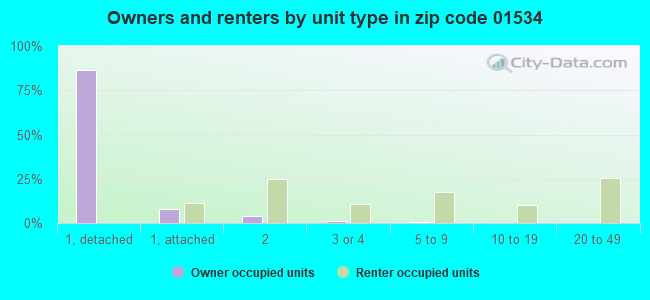
Houses and condos: 2,477 Renter-occupied apartments: 474
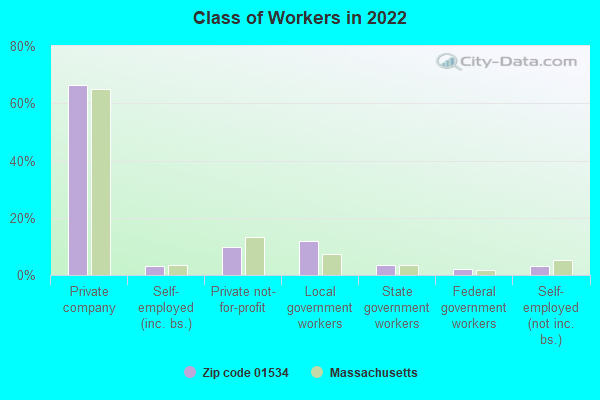
% of renters here:
20%
State:
38%
March 2022 cost of living index in zip code 01534: 124.8 (high, U.S. average is 100)
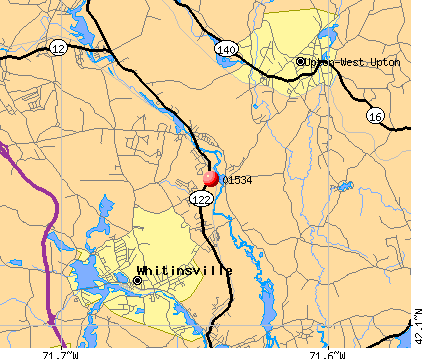
Land area: 8.8 sq. mi. Water area: 0.1 sq. mi.
Population density: 673 people per square mile
(low).
OSM Map
Google Map
MSN Map
OSM Map
General Map
Google Map
MSN Map
OSM Map
Google Map
MSN Map
OSM Map
Google Map
MSN Map
Please wait while loading the map...
Real estate property taxes paid for housing units in 2022:
This zip code:
1.0% ($4,557)
Massachusetts:
1.0% ($5,536)
Median real estate property taxes paid for housing units with mortgages in 2022: $4,614 (1.0%) Median real estate property taxes paid for housing units with no mortgage in 2022: $4,289 (1.0%)
Business Search- 14 Million verified businesses
Males: 2,900
(49.2%)
Females: 2,991
(50.8%)
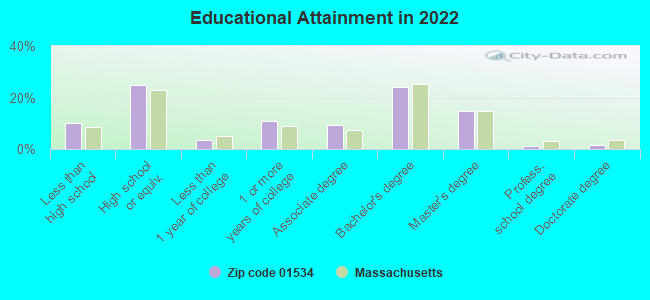
For population 25 years and over in 01534:
High school or higher: 89.0%
Bachelor's degree or higher: 41.0%
Graduate or professional degree: 17.2%
Unemployed: 4.6%
Mean travel time to work (commute): 28.5 minutes
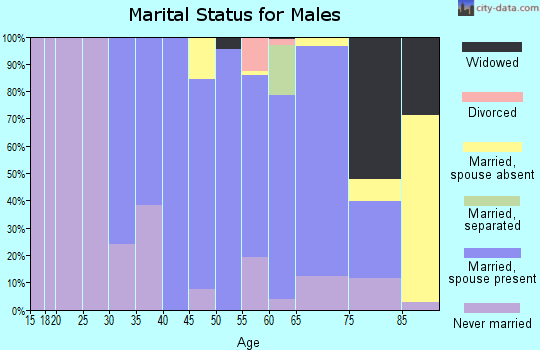
For population 15 years and over in 01534:
Never married: 23.9%
Now married: 60.5%
Separated: 0.4%
Widowed: 6.4%
Divorced: 8.9%
Zip code 01534 compared to state average:
Black race population percentage significantly below state average.
Hispanic race population percentage below state average.
Median age above state average.
Foreign-born population percentage significantly below state average.
Renting percentage below state average.
Length of stay since moving in above state average.
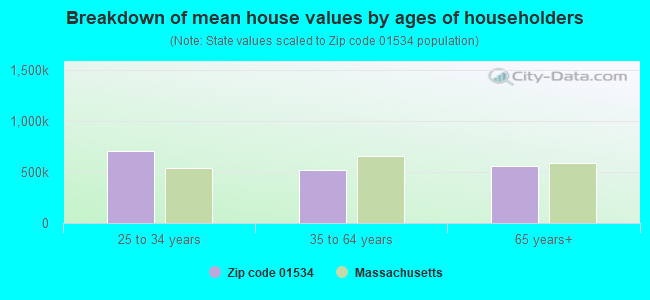
Estimated median house/condo value in 2022: $467,959
01534:
$467,959
Massachusetts:
$534,700
According to our research of Massachusetts and other state lists, there were 3 registered sex offenders living in 01534 zip code as of May 28, 2024. The ratio of all residents to sex offenders in zip code 01534 is 2,166 to 1. The ratio of registered sex offenders to all residents in this zip code is lower than the state average.
Median resident age:
This zip code:
47.6 years
Massachusetts median age:
40.3 years
Average household size:
This zip code:
2.4 people
Massachusetts:
2.4 people
Averages for the 2020 tax year for zip code 01534, filed in 2021:
Average Adjusted Gross Income (AGI) in 2020: $92,630 (Individual Income Tax Returns)
Here:
$92,630
State:
$105,130
Salary/wage: $82,796 (reported on 86.4% of returns)
Here:
$82,796
State:
$82,951
(% of AGI for various income ranges: 1149.4% for AGIs below $25k, 3613.8% for AGIs $25k-50k, 6491.2% for AGIs $50k-75k, 9546.5% for AGIs $75k-100k, 19928.6% for AGIs $100k-200k, 65540.8% for AGIs over 200k)
Taxable interest for individuals: $900 (reported on 41.8% of returns)
This zip code:
$900
Massachusetts:
$2,361
(% of AGI for various income ranges: 13.7% for AGIs below $25k, 21.4% for AGIs $25k-50k, 38.1% for AGIs $50k-75k, 93.9% for AGIs $75k-100k, 95.1% for AGIs $100k-200k, 242.5% for AGIs over 200k)
Ordinary dividends: $3,281 (reported on 23.8% of returns)
Here:
$3,281
State:
$10,365
(% of AGI for various income ranges: 19.6% for AGIs below $25k, 48.4% for AGIs $25k-50k, 67.5% for AGIs $50k-75k, 143.9% for AGIs $75k-100k, 149.8% for AGIs $100k-200k, 827.5% for AGIs over 200k)
Net capital gain/loss in AGI: +$8,906 (reported on 22.0% of returns)
Here:
+$8,906
State:
+$48,178
(% of AGI for various income ranges: 60.2% for AGIs $25k-50k, 48.4% for AGIs $50k-75k, 174.3% for AGIs $75k-100k, 339.5% for AGIs $100k-200k, 3353.3% for AGIs over 200k)
Profit/loss from business: +$16,190 (reported on 12.1% of returns)
Here:
+$16,190
State:
+$20,792
(% of AGI for various income ranges: 74.7% for AGIs below $25k, 95.4% for AGIs $25k-50k, 153.8% for AGIs $50k-75k, 401.3% for AGIs $75k-100k, 473.0% for AGIs $100k-200k, 1672.5% for AGIs over 200k)
Taxable individual retirement arrangement distribution: $20,597 (reported on 10.2% of returns)
01534:
$20,597
Massachusetts:
$22,790
(% of AGI for various income ranges: 95.7% for AGIs below $25k, 95.4% for AGIs $25k-50k, 224.1% for AGIs $50k-75k, 339.6% for AGIs $75k-100k, 691.6% for AGIs $100k-200k, 1133.3% for AGIs over 200k)
Self-employed (Keogh) retirement plans: $21,100 (reported on 0.6% of returns)
01534:
$21,100
Massachusetts:
$26,868
(% of AGI for various income ranges: 98.1% for AGIs $100k-200k)
Total itemized deductions: $25,637 (reported on 13.3% of returns)
Here:
$25,637
State:
$36,722
(% of AGI for various income ranges: 240.6% for AGIs $25k-50k, 398.1% for AGIs $50k-75k, 588.7% for AGIs $75k-100k, 927.9% for AGIs $100k-200k, 2669.2% for AGIs over 200k)
Charity contributions: $4,606 (reported on 10.2% of returns)
Here:
$4,606
State:
$12,529
(% of AGI for various income ranges: 8.4% for AGIs $25k-50k, 30.3% for AGIs $50k-75k, 37.0% for AGIs $75k-100k, 130.5% for AGIs $100k-200k, 612.5% for AGIs over 200k)
Taxes paid: $8,495 (reported on 13.3% of returns)
01534:
$8,495
State:
$8,782
(% of AGI for various income ranges: 50.6% for AGIs $25k-50k, 142.5% for AGIs $50k-75k, 206.5% for AGIs $75k-100k, 357.0% for AGIs $100k-200k, 778.3% for AGIs over 200k)
Earned income credit: $1,800 (reported on 7.1% of returns)
Here:
$1,800
State:
$1,909
(% of AGI for various income ranges: 47.8% for AGIs below $25k, 34.0% for AGIs $25k-50k)
Percentage of individuals using paid preparers for their 2020 taxes: 91.3%
Here:
91%
State:
92%
(% for various income ranges: 90.7% for AGIs below $25k, 90.8% for AGIs $25k-50k, 93.0% for AGIs $50k-75k, 91.4% for AGIs $75k-100k, 91.8% for AGIs $100k-200k, 90.6% for AGIs over 200k)
Averages for the 2012 tax year for zip code 01534, filed in 2013:
Average Adjusted Gross Income (AGI) in 2012: $71,755 (Individual Income Tax Returns)
Here:
$71,755
State:
$81,425
Salary/wage: $68,577 (reported on 89.5% of returns)
Here:
$68,577
State:
$64,752
(% of AGI for various income ranges: 76.9% for AGIs below $25k, 81.0% for AGIs $25k-50k, 81.1% for AGIs $50k-75k, 84.5% for AGIs $75k-100k, 89.1% for AGIs $100k-200k, 86.1% for AGIs over 200k)
Taxable interest for individuals: $673 (reported on 46.7% of returns)
This zip code:
$673
Massachusetts:
$2,136
(% of AGI for various income ranges: 1.2% for AGIs below $25k, 0.8% for AGIs $25k-50k, 0.7% for AGIs $50k-75k, 0.4% for AGIs $75k-100k, 0.2% for AGIs $100k-200k, 0.5% for AGIs over 200k)
Ordinary dividends: $2,119 (reported on 23.5% of returns)
Here:
$2,119
State:
$9,473
(% of AGI for various income ranges: 1.8% for AGIs below $25k, 0.8% for AGIs $25k-50k, 0.7% for AGIs $50k-75k, 0.6% for AGIs $75k-100k, 0.5% for AGIs $100k-200k, 0.9% for AGIs over 200k)
Net capital gain/loss in AGI: +$2,804 (reported on 17.9% of returns)
Here:
+$2,804
State:
+$31,437
(% of AGI for various income ranges: 0.2% for AGIs below $25k, 0.2% for AGIs $50k-75k, 0.5% for AGIs $100k-200k, 2.1% for AGIs over 200k)
Profit/loss from business: +$13,989 (reported on 13.0% of returns)
Here:
+$13,989
State:
+$20,662
(% of AGI for various income ranges: 3.6% for AGIs below $25k, 2.6% for AGIs $25k-50k, 3.3% for AGIs $50k-75k, 2.7% for AGIs $75k-100k, 2.6% for AGIs $100k-200k, 1.6% for AGIs over 200k)
Taxable individual retirement arrangement distribution: $12,122 (reported on 9.5% of returns)
01534:
$12,122
Massachusetts:
$18,892
(% of AGI for various income ranges: 4.1% for AGIs below $25k, 2.1% for AGIs $25k-50k, 1.8% for AGIs $50k-75k, 1.9% for AGIs $75k-100k, 1.9% for AGIs $100k-200k)
Total itemized deductions: $23,046 (19% of AGI, reported on 44.6% of returns)
Here:
$23,046
State:
$28,907
Here:
19.0% of AGI
State:
18.2% of AGI
(% of AGI for various income ranges: 9.6% for AGIs below $25k, 9.5% for AGIs $25k-50k, 13.3% for AGIs $50k-75k, 16.9% for AGIs $75k-100k, 16.3% for AGIs $100k-200k, 13.2% for AGIs over 200k)
Charity contributions: $2,288 (reported on 36.8% of returns)
Here:
$2,288
State:
$4,208
(% of AGI for various income ranges: 0.5% for AGIs below $25k, 0.6% for AGIs $25k-50k, 0.9% for AGIs $50k-75k, 1.2% for AGIs $75k-100k, 1.4% for AGIs $100k-200k, 1.4% for AGIs over 200k)
Taxes paid: $10,250 (reported on 44.2% of returns)
01534:
$10,250
State:
$13,303
(% of AGI for various income ranges: 2.5% for AGIs below $25k, 2.9% for AGIs $25k-50k, 4.9% for AGIs $50k-75k, 6.6% for AGIs $75k-100k, 7.5% for AGIs $100k-200k, 7.3% for AGIs over 200k)
Earned income credit: $1,978 (reported on 9.5% of returns)
Here:
$1,978
State:
$1,971
(% of AGI for various income ranges: 3.8% for AGIs below $25k, 0.8% for AGIs $25k-50k)
Percentage of individuals using paid preparers for their 2012 taxes: 51.2%
Here:
51%
State:
56%
(% for various income ranges: 41.9% for AGIs below $25k, 53.6% for AGIs $25k-50k, 57.1% for AGIs $50k-75k, 51.9% for AGIs $75k-100k, 55.9% for AGIs $100k-200k, 60.0% for AGIs over 200k)
Averages for the 2004 tax year for zip code 01534, filed in 2005:
Average Adjusted Gross Income (AGI) in 2004: $59,126 (Individual Income Tax Returns)
Here:
$59,126
State:
$62,877
Salary/wage: $55,928 (reported on 89.6% of returns)
Here:
$55,928
State:
$52,969
(% of AGI for various income ranges: 95.5% for AGIs below $10k, 74.4% for AGIs $10k-25k, 84.8% for AGIs $25k-50k, 87.9% for AGIs $50k-75k, 90.8% for AGIs $75k-100k, 82.2% for AGIs over 100k)
Taxable interest for individuals: $653 (reported on 62.4% of returns)
This zip code:
$653
Massachusetts:
$1,945
(% of AGI for various income ranges: 3.7% for AGIs below $10k, 1.4% for AGIs $10k-25k, 0.6% for AGIs $25k-50k, 0.8% for AGIs $50k-75k, 0.6% for AGIs $75k-100k, 0.6% for AGIs over 100k)
Taxable dividends: $1,325 (reported on 25.2% of returns)
Here:
$1,325
State:
$5,323
(% of AGI for various income ranges: 2.2% for AGIs below $10k, 1.3% for AGIs $10k-25k, 0.6% for AGIs $25k-50k, 0.3% for AGIs $50k-75k, 0.5% for AGIs $75k-100k, 0.5% for AGIs over 100k)
Net capital gain/loss: +$8,358 (reported on 20.9% of returns)
Here:
+$8,358
State:
+$20,377
(% of AGI for various income ranges: -1.8% for AGIs below $10k, 0.2% for AGIs $10k-25k, -0.2% for AGIs $25k-50k, 0.2% for AGIs $50k-75k, 0.5% for AGIs $75k-100k, 6.3% for AGIs over 100k)
Profit/loss from business: +$14,115 (reported on 14.3% of returns)
Here:
+$14,115
State:
+$17,837
(% of AGI for various income ranges: 3.5% for AGIs below $10k, 7.4% for AGIs $10k-25k, 5.0% for AGIs $25k-50k, 2.7% for AGIs $50k-75k, 2.8% for AGIs $75k-100k, 3.0% for AGIs over 100k)
IRA payment deduction: $2,867 (reported on 2.5% of returns)
01534:
$2,867
Massachusetts:
$3,100
Self-employed pension: $10,462 (reported on 0.5% of returns)
Here:
$10,462
Massachusetts:
$14,516
Total itemized deductions: $19,961 (21% of AGI, reported on 46.9% of returns)
Here:
$19,961
State:
$22,573
Here:
20.8% of AGI
State:
19.5% of AGI
(% of AGI for various income ranges: 8.5% for AGIs below $10k, 12.2% for AGIs $10k-25k, 12.3% for AGIs $25k-50k, 17.9% for AGIs $50k-75k, 19.5% for AGIs $75k-100k, 15.2% for AGIs over 100k)
Charity contributions deductions: $2,143 (2% of AGI, reported on 41.8% of returns)
Here:
$2,143
State:
$3,295
Here:
2.2% of AGI
State:
2.7% of AGI
(% of AGI for various income ranges: 0.8% for AGIs $10k-25k, 1.1% for AGIs $25k-50k, 1.4% for AGIs $50k-75k, 1.6% for AGIs $75k-100k, 1.8% for AGIs over 100k)
Total tax: $8,491 (reported on 83.5% of returns)
01534:
$8,491
State:
$11,494
(% of AGI for various income ranges: 2.6% for AGIs below $10k, 5.2% for AGIs $10k-25k, 7.8% for AGIs $25k-50k, 8.4% for AGIs $50k-75k, 9.4% for AGIs $75k-100k, 16.5% for AGIs over 100k)
Earned income credit: $1,492 (reported on 7.7% of returns)
Here:
$1,492
State:
$1,518
Percentage of individuals using paid preparers for their 2004 taxes: 51.2%
Here:
51%
State:
58%
(% for various income ranges: 37.9% for AGIs below $10k, 51.6% for AGIs $10k-25k, 49.7% for AGIs $25k-50k, 57.5% for AGIs $50k-75k, 53.8% for AGIs $75k-100k, 58.3% for AGIs over 100k)
Likely homosexual households (counted as self-reported same-sex unmarried-partner households)
Lesbian couples: 0.0% of all households
Gay men: 0.7% of all households
Household received Food Stamps/SNAP in the past 12 months: 157 Household did not receive Food Stamps/SNAP in the past 12 months: 2,189
Women who had a birth in the past 12 months: 68 (65 now married, 5 unmarried) Women who did not have a birth in the past 12 months: 1,163 (597 now married, 554 unmarried)
Housing units in zip code 01534 with a mortgage: 1,381 (329 second mortgage, 14 home equity loan, 294 both second mortgage and home equity loan) Houses without a mortgage: 17
Median monthly owner costs for units with a mortgage: $2,496 Median monthly owner costs for units without a mortgage: $866
Residents with income below the poverty level in 2022:
This zip code:
3.0%
Whole state:
10.4%
Residents with income below 50% of the poverty level in 2022:
This zip code:
1.8%
Whole state:
5.1%
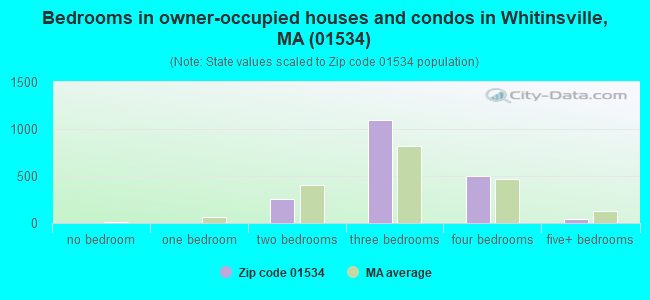
Median number of rooms in houses and condos:
Here:
7.0
State:
6.5
Median number of rooms in apartments:
Here:
3.9
State:
4.0
Notable locations in this zip code not listed on our city pages
In group quarters: 171 (-1 institutionalized population)
Size of family households: 1,013 2-persons, 369 3-persons, 263 4-persons, 126 5-persons, 19 6-persons, 15 7-or-more-persons
Size of nonfamily households: 463 1-person, 92 2-persons, 15 4-persons
715 married couples with children.
240 single-parent households (98 men, 142 women).
87.1% of residents of 01534 zip code speak English at home.
5.9% of residents speak Spanish at home (79% very well, 19% well, 2% not at all).
3.0% of residents speak other Indo-European language at home (74% very well, 26% well).
2.7% of residents speak Asian or Pacific Island language at home (51% very well, 11% well, 38% not well).
0.7% of residents speak other language at home (76% very well, 13% well, 11% not well).
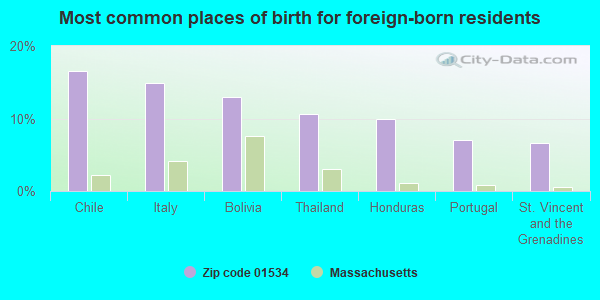
Foreign born population: 302 (5.1%) (62.0% of them are naturalized citizens)
This zip code:
5.1%
Whole state:
18.0%
17%Chile
15%Italy
13%Bolivia
11%Thailand
10%Honduras
7%Portugal
7%St. Vincent and the Grenadines
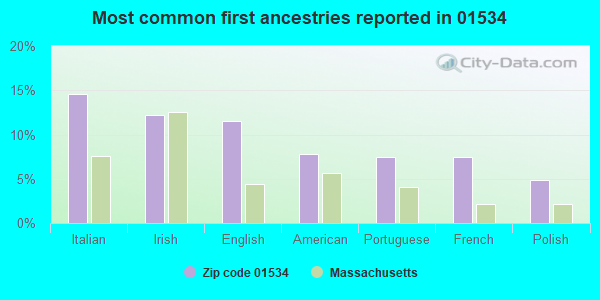
15%Italian
12%Irish
12%English
8%American
7%Portuguese
7%French
5%Polish
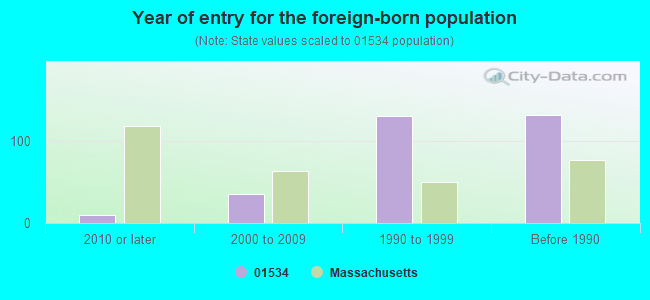
Year of entry for the foreign-born population
102010 or later
352000 to 2009
1311990 to 1999
132Before 1990
Facilities with environmental interests located in this zip code:
NORTHBRIDGE WWTP (643 PROVIDENCE ROAD in NORTHBRIDGE, MA)
(Integrated Compliance Information System) - ICIS-01-2000-0238, FORMAL ENFORCEMENT ACTION (Integrated Compliance Information System) - ICIS-01-1998-0039, FORMAL ENFORCEMENT ACTION National Pollutant Discharge Elimination System MAJOR (Tracking pollutant discharge elimination systems) - permit Business SIC classification: SEWERAGE SYSTEMS Alternative names: NORTHBRIDGE W W T P, NORTHBRIDGE WPCF, TOWN OF NORTHBRIDGE WWTP
A T F DAVIDSON (355 MAIN STREET in NORTHBRIDGE, MA)
AIR MINOR (AIRS/AFS) SUPERFUND (Superfund database) TSD (Resource Conservation and Recovery Act (tracking hazardous waste)) - notification (Resource Conservation and Recovery Act (tracking hazardous waste)) Business SIC classification: GENERAL INDUSTRIAL MACHINERY AND EQUIPMENT Business NAICS classification: TEXTILE MACHINERY MANUFACTURING.; PRINTING MACHINERY AND EQUIPMENT MANUFACTURING.; OFFICE MACHINERY MANUFACTURING. Organizations: ATF DAVIDSON-DITTO INC (CONTACT/OWNER)
Alternative names: ATF DAVIDSON CO, COVITCH PROPERTY, COVITCH PROPERTY/ATF DAVIDSON CO (FMR)
CHURCH AVENUE (50 TO 84 CHURCH AVENUE in NORTHBRIDGE, MA)
(Integrated Compliance Information System) - ICIS-01-1995-0088, FORMAL ENFORCEMENT ACTION Alternative names: CHURCH AVE NORTHBRIDGE
PARFAIT CLEANERS (12 BEANES LN in NORTHBRIDGE, MA)
AIR MINOR (AIRS/AFS) Conditionally Exempt Small Quantity Generators, less than 100 kg/month of hazardous waste (Resource Conservation and Recovery Act (tracking hazardous waste)) - notification Business SIC classification: DRYCLEANING PLANTS, EXCEPT RUG CLEANING Organizations: GEOVIN DRY CLEANERS (CONTACT/OWNER)
ACM PRODUCTS INC (PROVIDENCE RD in NORTHBRIDGE, MA)
(Resource Conservation and Recovery Act (tracking hazardous waste)) Alternative names: A C M PRODUCTS INC
KEARNS COLLISION REPAIR (1734 PROVIDENCE RD in NORTHBRIDGE, MA)
(Resource Conservation and Recovery Act (tracking hazardous waste)) Alternative names: KEARNS BROTHERS AUTO BODY INC
NORTHBRIDGE (NORTHBRIDGE in NORTHBRIDGE, MA)
AIR MINOR (AIRS/AFS) Business SIC classification: GENERAL GOVERNMENT
NORTHBRIDGE 122 RENTAL CENTER (1682 PROVIDENCE RD in NORTHBRIDGE, MA)
Conditionally Exempt Small Quantity Generators, less than 100 kg/month of hazardous waste (Resource Conservation and Recovery Act (tracking hazardous waste)) - notification Organizations: EDMUND TONRY (CONTACT/OWNER)
NORTHBRIDGE AUTO WRECKING (RTE 122 PROVIDENCE RD in NORTHBRIDGE, MA)
AIR MINOR (AIRS/AFS) Business SIC classification: NONCLASSIFIABLE ESTABLISHMENTS
NORTHBRIDGE FIRE DEPT (MAIN ST in NORTHBRIDGE, MA)
Small Quantity Generators, between 100 kg and 1000 kg of hazardous waste/month (Resource Conservation and Recovery Act (tracking hazardous waste)) - notification Organizations: BU & PR: TOWN OF NORTHBRIDGE (CONTACT/OWNER)
Alternative names: NORTHBRIDGE TOWN OF
MA NATIONAL GUARD MAINT SHOP 23 (50 LAKE ST in NORTHBRIDGE, MA)
Conditionally Exempt Small Quantity Generators, less than 100 kg/month of hazardous waste (Resource Conservation and Recovery Act (tracking hazardous waste)) - notification
NORTHBRIDGE LANDFILL (1201 QUAKER ST in NORTHBRIDGE, MA)
CRITERIA AND HAZARDOUS AIR POLLUTANT INVENTORY (Inventory of air pollution sources) Business SIC classification: REFUSE SYSTEMS Business NAICS classification: SOLID WASTE LANDFILL.
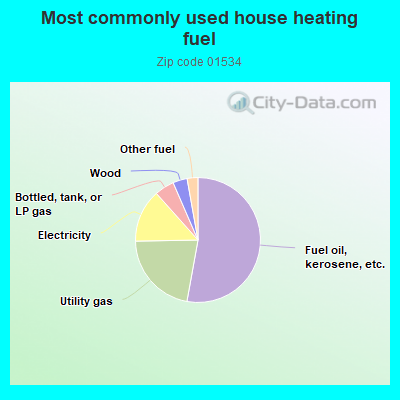
52.9%Fuel oil, kerosene, etc.
21.9%Utility gas
13.7%Electricity
5.1%Bottled, tank, or LP gas
3.7%Wood
2.8%Other fuel
Population in 1990: 4,564. Population change in the 1990s: +178 (+3.9%).
Place of birth for U.S.-born residents:
This state: 4,298
Northeast: 929
Midwest: 166
South: 72
West: 51
62% of the 01534 zip code residents lived in the same house 5 years ago. Out of people who lived in different houses, 66% lived in this county. Out of people who lived in different counties, 50% lived in Massachusetts.
92% of the 01534 zip code residents lived in the same house 1 year ago. Out of people who lived in different houses, 63% moved from this county. Out of people who lived in different houses, 11% moved from different county within same state. Out of people who lived in different houses, 24% moved from different state.
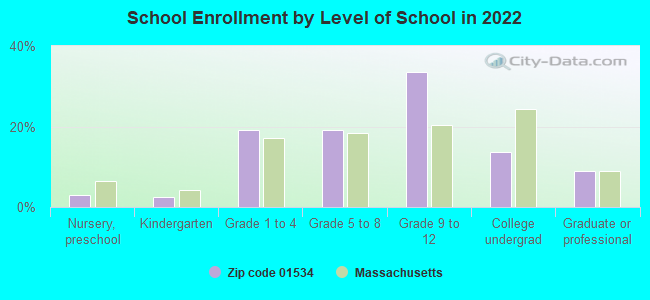
Private vs. public school enrollment:
Students in private schools in grades 1 to 8 (elementary and middle school): 117
Here:
24.3%
Massachusetts:
10.3%
Students in private schools in grades 9 to 12 (high school): 78
Here:
18.9%
Massachusetts:
12.3%
Students in private undergraduate colleges: 99
Here:
58.9%
Massachusetts:
51.2%
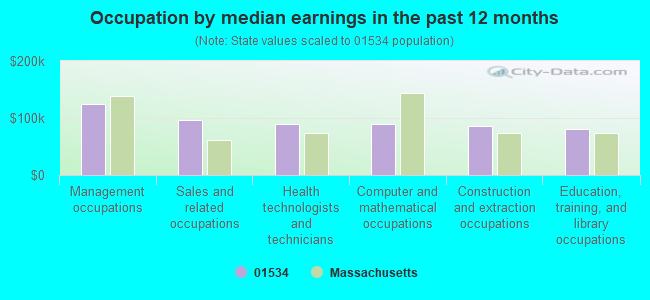
Occupation by median earnings in the past 12 months ($)
124,826Management occupations
95,940Sales and related occupations
89,632Health technologists and technicians
89,223Computer and mathematical occupations
85,578Construction and extraction occupations
81,267Education, training, and library occupations
Top industries in this zip code by the number of employees in 2005:
Health Care and Social Assistance: Nursing Care Facilities (250-499 employees: 1 establishment)
Construction: Poured Concrete Foundation and Structure Contractors (20-49: 1)
Health Care and Social Assistance: Residential Mental Retardation Facilities (10-19: 2)
Construction: Plumbing, Heating, and Air-Conditioning Contractors (10-19: 1, 5-9: 1)
Other Services (except Public Administration): Automotive Body, Paint, and Interior Repair and Maintenance (10-19: 1)
Mining: Support Activities for Nonmetallic Minerals (except Fuels) (10-19: 1)
People in group quarters in 2010:
150 people in nursing facilities/skilled-nursing facilities
11 people in group homes intended for adults
8 people in group homes for juveniles (non-correctional)
People in group quarters in 2000:
252 people in nursing homes
12 people in homes for the physically handicapped
8 people in homes for the mentally retarded
Fatal accident statistics in 2014:
Fatal accident count: 2
Vehicles involved in fatal accidents: 3
Fatal accidents caused by drunken drivers: 0
Fatalities: 2
Persons involved in fatal accidents: 6
Pedestrians involved in fatal accidents: 1
Fatal accident statistics in 2013:
Fatal accident count: 1
Vehicles involved in fatal accidents: 2
Fatal accidents caused by drunken drivers: 0
Fatalities: 1
Persons involved in fatal accidents: 2
Pedestrians involved in fatal accidents: 0
Home Mortgage Disclosure Act Aggregated Statistics For Year 2009 (Based on 6 partial tracts)
A) FHA, FSA/RHS & VA Home Purchase Loans
B) Conventional Home Purchase Loans
C) Refinancings
D) Home Improvement Loans
E) Loans on Dwellings For 5+ Families
F) Non-occupant Loans on < 5 Family Dwellings (A B C & D)
Number
Average Value
Number
Average Value
Number
Average Value
Number
Average Value
Number
Average Value
Number
Average Value
LOANS ORIGINATED
60
$212,305
96
$222,617
437
$226,914
22
$159,023
2
$288,720
18
$173,038
APPLICATIONS APPROVED, NOT ACCEPTED
7
$201,131
3
$316,370
34
$237,834
2
$20,625
0
$0
0
$0
APPLICATIONS DENIED
4
$170,675
10
$135,178
81
$221,995
7
$67,291
0
$0
3
$185,277
APPLICATIONS WITHDRAWN
4
$170,155
16
$198,068
64
$242,799
2
$97,160
0
$0
2
$131,360
FILES CLOSED FOR INCOMPLETENESS
0
$0
3
$109,863
19
$250,348
0
$0
0
$0
3
$151,110
Aggregated Statistics For Year 2008 (Based on 6 partial tracts)
A) FHA, FSA/RHS & VA Home Purchase Loans
B) Conventional Home Purchase Loans
C) Refinancings
D) Home Improvement Loans
E) Loans on Dwellings For 5+ Families
F) Non-occupant Loans on < 5 Family Dwellings (A B C & D)
Number
Average Value
Number
Average Value
Number
Average Value
Number
Average Value
Number
Average Value
Number
Average Value
LOANS ORIGINATED
24
$239,716
76
$244,807
184
$246,930
26
$53,508
1
$341,960
5
$469,414
APPLICATIONS APPROVED, NOT ACCEPTED
2
$177,170
20
$167,134
21
$297,850
1
$49,940
1
$16,280
2
$93,740
APPLICATIONS DENIED
9
$214,116
12
$180,518
82
$240,683
13
$77,022
0
$0
7
$116,976
APPLICATIONS WITHDRAWN
6
$274,713
11
$227,225
58
$217,098
2
$203,550
0
$0
6
$188,052
FILES CLOSED FOR INCOMPLETENESS
0
$0
5
$212,396
5
$226,702
1
$32,570
0
$0
2
$102,175
Aggregated Statistics For Year 2007 (Based on 6 partial tracts)
A) FHA, FSA/RHS & VA Home Purchase Loans
B) Conventional Home Purchase Loans
C) Refinancings
D) Home Improvement Loans
E) Loans on Dwellings For 5+ Families
F) Non-occupant Loans on < 5 Family Dwellings (A B C & D)
Number
Average Value
Number
Average Value
Number
Average Value
Number
Average Value
Number
Average Value
Number
Average Value
LOANS ORIGINATED
3
$232,657
191
$211,473
275
$209,619
47
$49,160
6
$359,337
22
$198,621
APPLICATIONS APPROVED, NOT ACCEPTED
0
$0
16
$225,679
41
$207,334
4
$13,642
3
$627,577
0
$0
APPLICATIONS DENIED
0
$0
25
$173,049
176
$228,880
22
$149,568
0
$0
3
$113,380
APPLICATIONS WITHDRAWN
0
$0
17
$215,789
86
$218,911
6
$96,187
0
$0
3
$127,893
FILES CLOSED FOR INCOMPLETENESS
0
$0
2
$348,480
22
$269,431
1
$331,110
0
$0
0
$0
Aggregated Statistics For Year 2006 (Based on 6 partial tracts)
A) FHA, FSA/RHS & VA Home Purchase Loans
B) Conventional Home Purchase Loans
C) Refinancings
D) Home Improvement Loans
E) Loans on Dwellings For 5+ Families
F) Non-occupant Loans on < 5 Family Dwellings (A B C & D)
Number
Average Value
Number
Average Value
Number
Average Value
Number
Average Value
Number
Average Value
Number
Average Value
LOANS ORIGINATED
2
$267,060
264
$213,380
352
$192,142
80
$89,488
8
$381,799
29
$190,812
APPLICATIONS APPROVED, NOT ACCEPTED
0
$0
29
$270,012
61
$198,477
12
$75,544
0
$0
8
$191,688
APPLICATIONS DENIED
0
$0
36
$185,183
154
$207,718
31
$126,945
0
$0
12
$135,357
APPLICATIONS WITHDRAWN
0
$0
24
$196,635
117
$206,884
14
$184,092
0
$0
6
$249,345
FILES CLOSED FOR INCOMPLETENESS
0
$0
7
$195,979
39
$237,026
2
$73,820
0
$0
1
$383,220
Aggregated Statistics For Year 2005 (Based on 6 partial tracts)
A) FHA, FSA/RHS & VA Home Purchase Loans
B) Conventional Home Purchase Loans
C) Refinancings
D) Home Improvement Loans
E) Loans on Dwellings For 5+ Families
F) Non-occupant Loans on < 5 Family Dwellings (A B C & D)
G) Loans On Manufactured Home Dwelling (A B C & D)
Number
Average Value
Number
Average Value
Number
Average Value
Number
Average Value
Number
Average Value
Number
Average Value
Number
Average Value
LOANS ORIGINATED
3
$269,857
337
$223,248
436
$200,660
73
$63,473
2
$599,935
26
$137,050
0
$0
APPLICATIONS APPROVED, NOT ACCEPTED
0
$0
25
$328,673
38
$253,586
4
$149,812
0
$0
2
$284,970
0
$0
APPLICATIONS DENIED
0
$0
52
$219,333
148
$213,998
34
$130,546
3
$479,110
7
$153,361
1
$182,380
APPLICATIONS WITHDRAWN
0
$0
40
$219,371
129
$188,016
7
$111,427
0
$0
4
$370,430
0
$0
FILES CLOSED FOR INCOMPLETENESS
0
$0
13
$155,837
49
$226,472
0
$0
0
$0
1
$358,250
0
$0
Aggregated Statistics For Year 2004 (Based on 6 partial tracts)
A) FHA, FSA/RHS & VA Home Purchase Loans
B) Conventional Home Purchase Loans
C) Refinancings
D) Home Improvement Loans
E) Loans on Dwellings For 5+ Families
F) Non-occupant Loans on < 5 Family Dwellings (A B C & D)
G) Loans On Manufactured Home Dwelling (A B C & D)
Number
Average Value
Number
Average Value
Number
Average Value
Number
Average Value
Number
Average Value
Number
Average Value
Number
Average Value
LOANS ORIGINATED
15
$240,173
387
$220,440
496
$191,300
80
$98,946
6
$2,823,137
33
$195,877
2
$112,490
APPLICATIONS APPROVED, NOT ACCEPTED
1
$288,770
30
$242,420
31
$223,137
5
$182,090
0
$0
4
$194,775
0
$0
APPLICATIONS DENIED
0
$0
33
$182,249
115
$202,605
31
$53,595
0
$0
14
$271,993
4
$46,410
APPLICATIONS WITHDRAWN
0
$0
36
$213,988
108
$173,140
7
$122,477
0
$0
7
$186,164
0
$0
FILES CLOSED FOR INCOMPLETENESS
0
$0
7
$202,027
85
$200,348
3
$97,703
0
$0
1
$390,820
0
$0
Aggregated Statistics For Year 2003 (Based on 6 partial tracts)
A) FHA, FSA/RHS & VA Home Purchase Loans
B) Conventional Home Purchase Loans
C) Refinancings
D) Home Improvement Loans
E) Loans on Dwellings For 5+ Families
F) Non-occupant Loans on < 5 Family Dwellings (A B C & D)
Number
Average Value
Number
Average Value
Number
Average Value
Number
Average Value
Number
Average Value
Number
Average Value
LOANS ORIGINATED
13
$216,768
279
$207,665
1,143
$164,249
17
$51,478
4
$164,045
46
$168,863
APPLICATIONS APPROVED, NOT ACCEPTED
2
$206,230
21
$212,823
94
$168,019
9
$73,410
0
$0
0
$0
APPLICATIONS DENIED
1
$250,770
32
$184,104
147
$165,791
21
$36,537
0
$0
7
$195,873
APPLICATIONS WITHDRAWN
2
$145,295
15
$235,237
126
$170,429
8
$23,598
0
$0
5
$173,430
FILES CLOSED FOR INCOMPLETENESS
0
$0
5
$146,396
10
$179,175
0
$0
0
$0
1
$122,670
Aggregated Statistics For Year 2002 (Based on 6 partial tracts)
A) FHA, FSA/RHS & VA Home Purchase Loans
B) Conventional Home Purchase Loans
C) Refinancings
D) Home Improvement Loans
E) Loans on Dwellings For 5+ Families
F) Non-occupant Loans on < 5 Family Dwellings (A B C & D)
Number
Average Value
Number
Average Value
Number
Average Value
Number
Average Value
Number
Average Value
Number
Average Value
LOANS ORIGINATED
30
$180,734
206
$189,051
822
$145,134
30
$44,530
2
$309,340
21
$149,790
APPLICATIONS APPROVED, NOT ACCEPTED
3
$155,023
18
$193,621
72
$139,608
8
$34,368
0
$0
1
$217,120
APPLICATIONS DENIED
1
$204,090
10
$215,468
86
$158,829
18
$25,581
0
$0
4
$167,795
APPLICATIONS WITHDRAWN
0
$0
18
$192,539
117
$144,857
11
$67,752
0
$0
2
$116,700
FILES CLOSED FOR INCOMPLETENESS
0
$0
4
$176,450
18
$142,609
0
$0
0
$0
0
$0
Aggregated Statistics For Year 2001 (Based on 6 partial tracts)
A) FHA, FSA/RHS & VA Home Purchase Loans
B) Conventional Home Purchase Loans
C) Refinancings
D) Home Improvement Loans
F) Non-occupant Loans on < 5 Family Dwellings (A B C & D)
Number
Average Value
Number
Average Value
Number
Average Value
Number
Average Value
Number
Average Value
LOANS ORIGINATED
35
$151,895
178
$171,008
570
$139,913
24
$47,634
11
$122,601
APPLICATIONS APPROVED, NOT ACCEPTED
4
$134,985
20
$206,698
42
$110,970
14
$27,788
1
$56,450
APPLICATIONS DENIED
2
$92,805
25
$137,555
74
$105,189
16
$17,826
6
$101,742
APPLICATIONS WITHDRAWN
1
$194,320
13
$130,022
105
$129,373
12
$55,097
9
$171,946
FILES CLOSED FOR INCOMPLETENESS
1
$170,440
0
$0
11
$116,425
2
$5,970
0
$0
Aggregated Statistics For Year 2000 (Based on 6 partial tracts)
A) FHA, FSA/RHS & VA Home Purchase Loans
B) Conventional Home Purchase Loans
C) Refinancings
D) Home Improvement Loans
F) Non-occupant Loans on < 5 Family Dwellings (A B C & D)
Number
Average Value
Number
Average Value
Number
Average Value
Number
Average Value
Number
Average Value
LOANS ORIGINATED
37
$129,672
163
$142,776
113
$106,080
43
$24,852
7
$106,596
APPLICATIONS APPROVED, NOT ACCEPTED
2
$161,235
14
$128,467
21
$112,359
17
$52,867
1
$129,190
APPLICATIONS DENIED
0
$0
20
$148,338
62
$66,061
18
$22,736
0
$0
APPLICATIONS WITHDRAWN
0
$0
15
$207,033
73
$95,448
6
$20,147
0
$0
FILES CLOSED FOR INCOMPLETENESS
1
$175,870
1
$97,700
3
$125,233
2
$42,185
0
$0
Aggregated Statistics For Year 1999 (Based on 3 partial tracts)
A) FHA, FSA/RHS & VA Home Purchase Loans
B) Conventional Home Purchase Loans
C) Refinancings
D) Home Improvement Loans
E) Loans on Dwellings For 5+ Families
F) Non-occupant Loans on < 5 Family Dwellings (A B C & D)
Detailed PMIC statistics for the following Tracts:7502.00
, 7503.00
2002 - 2018 National Fire Incident Reporting System (NFIRS) incidents
Based on the data from the years 2002 - 2018 the average number of fires per year is 13. The highest number of reported fires - 57 took place in 2016, and the least - 0 in 2005. The data has a rising trend.
When looking into fire subcategories, the most reports belonged to: Structure Fires (54.7%), and Outside Fires (30.8%).
Fire incident types reported to NFIRS in Zip Code 01534


 Nearest zip codes: 01588, 01525, 01560, 01568, 01519, 01569.


 Based on the data from the years 2002 - 2018 the average number of fires per year is 13. The highest number of reported fires - 57 took place in 2016, and the least - 0 in 2005. The data has a rising trend.
 When looking into fire subcategories, the most reports belonged to: Structure Fires (54.7%), and Outside Fires (30.8%).